Contribution Margin on a Pitch Deck: Which Costs Are Below
How startups show contribution margin on a pitch deck: which costs are subtracted, what the margin is a percentage of, whether the rows add up.
How to Show Contribution Margin on Your Pitch Deck So Investors Can Rebuild It
Thirteen slides from real pitch decks that report or project a contribution margin: a site's monthly profit before head office costs, a per-customer waterfall, a margin by city, a single percentage in a case study. For each, we record which costs are subtracted, what the margin is divided by, whether the rows add up to the total shown, and whether the figure is measured or forecast.
TL;DR
Contribution margin is revenue minus the costs that rise with each sale, unit or customer. Unlike gross margin, it has no standard definition: some companies subtract only delivery and payment costs, others also subtract marketing, customer service, interest or bad debt. That makes it useful, because it shows whether each extra unit adds money to cover fixed costs, and easy to flatter, because the company chooses what to leave out. A credible slide lists the cost lines, says what the percentage is a percentage of, adds up, and says whether the numbers are actual or planned.
In this set, Stay Ulo's February snapshot adds up to the rand; Edurino's waterfall separates contribution before and after sales costs; Sonder shows contribution margin and EBITDA margin by city side by side; JVSP defines its margin in a footnote. The problems: Stay Ulo's projection for its next building comes to R388,000 on its own lines, not the R351,220 shown; Carma's cost rows add to $8 and $17, not the $9 and $16 it reports; Everphone divides by capital spent rather than revenue; Mandaê labels a 40% contribution margin as gross profit; VOID and Clearbanc state a margin with no costs behind it; June Homes and Maza hide the percentage.
Contribution margin slides from real pitch decks
Each example records the exact slide, the contribution margin it states, the costs it subtracts, and whether the arithmetic holds. Checks and implied figures are our calculations.
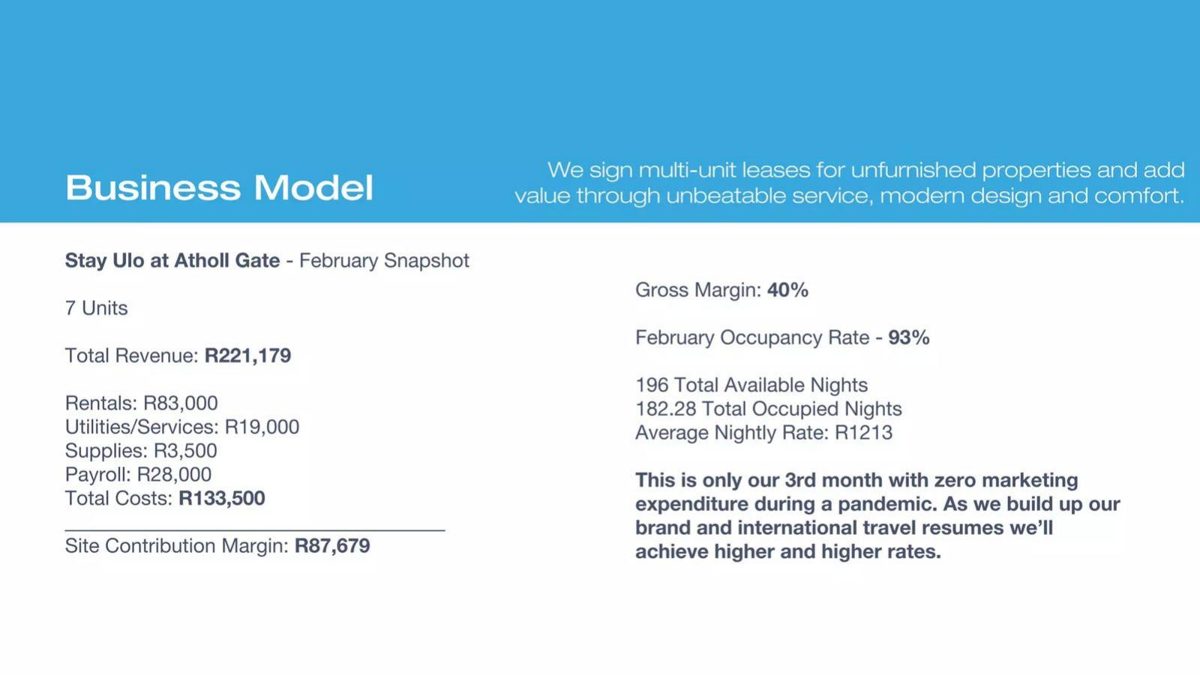
Stay Ulo unit economics slide — slide 11
Serviced apartments in South Africa. Business model slide.
Stay Ulo deck, slide 11. Exact stored slide matched to this analysis.
Our analysis: Measured site margin where every line adds up.
Evidence and limitation: Our checks: costs total R133,500; margin R87,679 is 39.6% of revenue; nights and occupancy reconcile.
What a founder can adapt: Show each variable cost, the total and the period.
Supporting analysis
What the deck claims: February snapshot, 7 units: revenue R221,179; rentals R83,000, utilities R19,000, supplies R3,500, payroll R28,000; total costs R133,500; "Site Contribution Margin: R87,679"; 93% occupancy; zero marketing.
Presentation choice: One site, one month, every cost listed.
When it does not fit: Don't call the same figure gross margin and contribution margin.
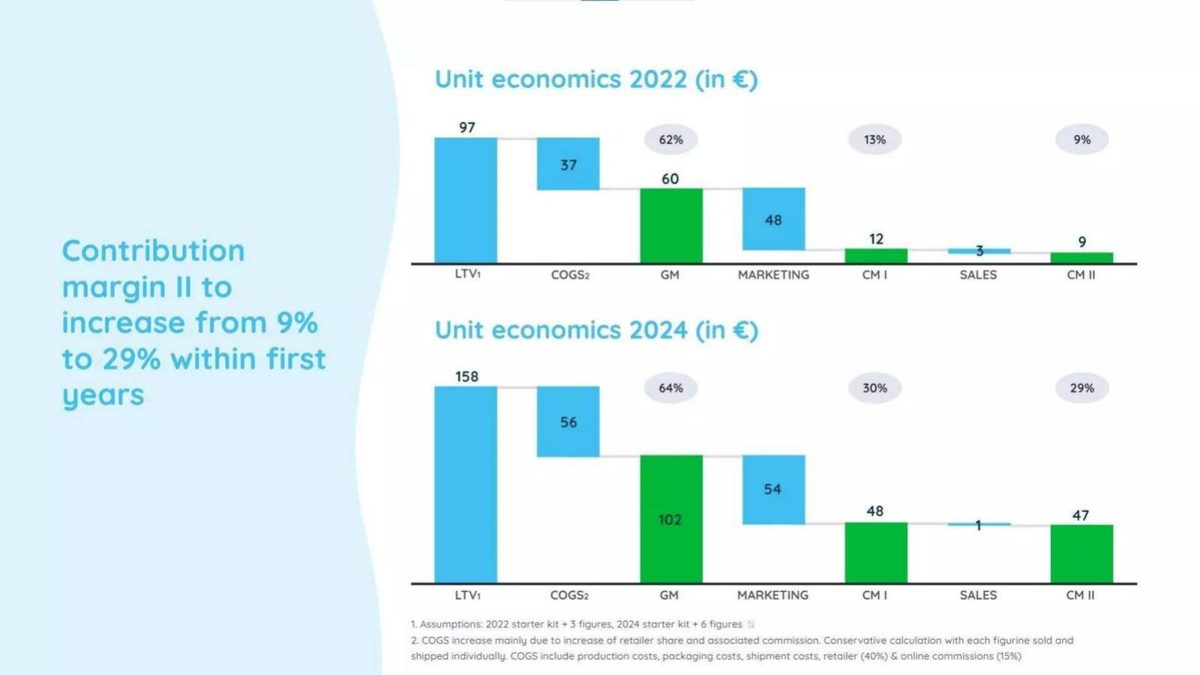
Children's learning games with figurines. Unit economics slide.
Edurino deck, slide 15. Exact stored slide matched to this analysis.
Our analysis: Named levels on a per-customer basis; 2024 is a plan.
Evidence and limitation: Our checks: all subtractions hold; percentages within about a point.
What a founder can adapt: Name each margin level and the cost that separates it.
Supporting analysis
What the deck claims: 2022: LTV €97, COGS €37, GM €60, marketing €48, CM I €12 (13%), sales €3, CM II €9 (9%); 2024: LTV €158, CM I €48 (30%), CM II €47 (29%).
Presentation choice: Each cost layer and margin level is visible.
When it does not fit: Don't round percentages away from the figures shown.
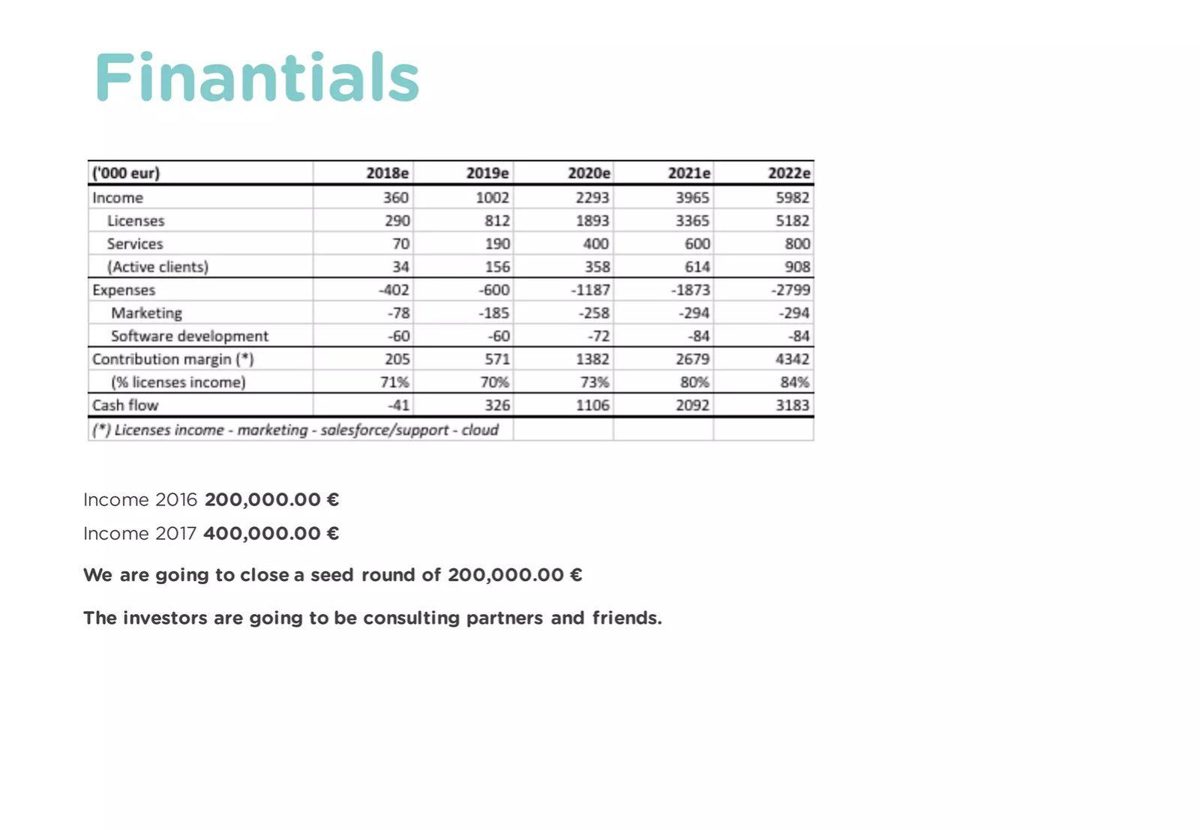
JVSP deck, slide 9. Exact stored slide matched to this analysis.
Our analysis: Defined margin on licence income only.
Evidence and limitation: Our checks: percentages and cash flow hold; about 7 of support and cloud cost in 2018 is implied but not listed.
What a founder can adapt: Define your margin in a footnote and list each cost.
Supporting analysis
What the deck claims: Contribution margin 205 to 4,342 (thousand euros), 71% to 84% of licence income; footnote: "Licenses income - marketing - salesforce/support - cloud".
Presentation choice: The footnote tells the reader what is excluded.
When it does not fit: Don't measure on one revenue stream without saying why.
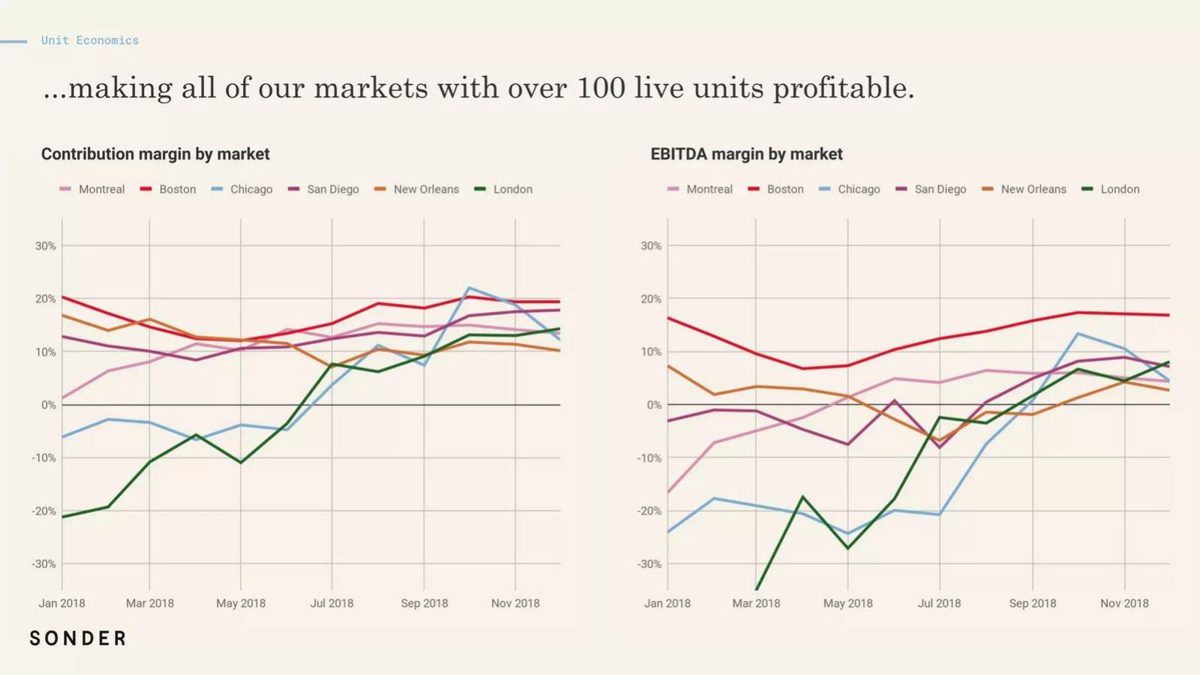
Sonder deck, slide 26. Exact stored slide matched to this analysis.
Our analysis: Two margins per market show local overhead.
Evidence and limitation: Read from the chart: all six end 2018 roughly 10–20% contribution and above zero EBITDA.
What a founder can adapt: Pair contribution with a margin after local overhead.
Supporting analysis
What the deck claims: "Contribution margin by market" and "EBITDA margin by market" for six cities, January to December 2018; "all of our markets with over 100 live units profitable".
Presentation choice: Investors see which cities cover their costs.
When it does not fit: Don't hide weak markets in a blended figure.
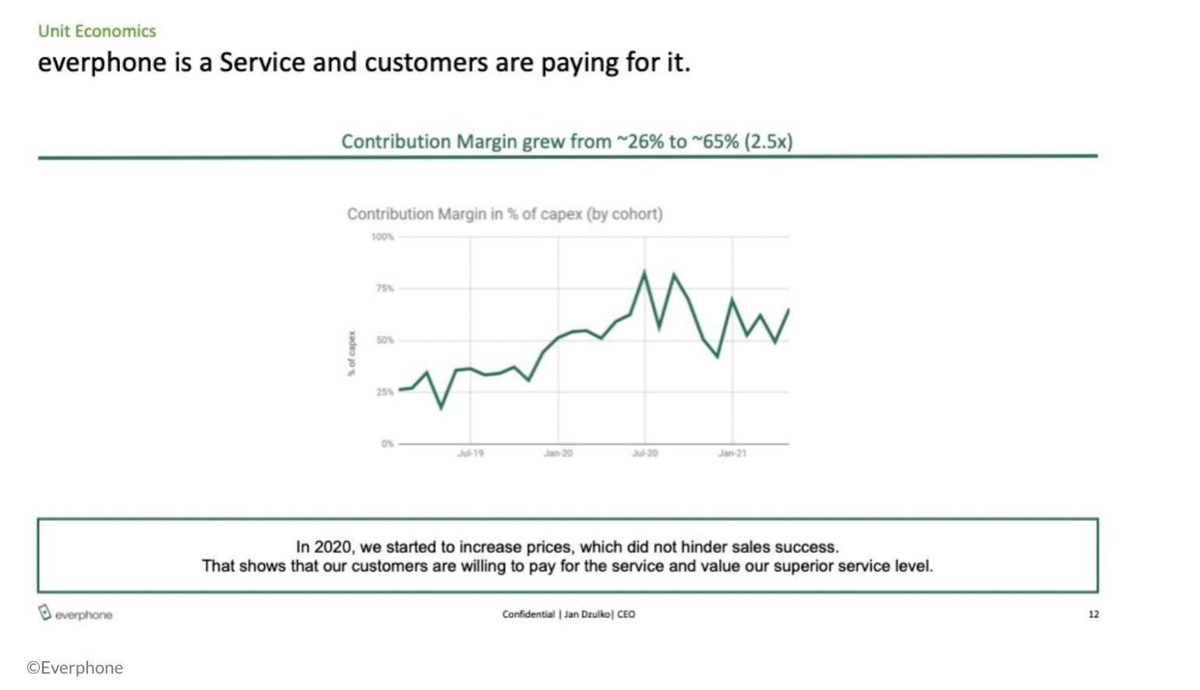
Everphone deck, slide 12. Exact stored slide matched to this analysis.
Our analysis: A return on capital, labelled as a margin.
Evidence and limitation: Our check: 65 ÷ 26 is 2.5; the series swings from above 80% to about 42%.
What a founder can adapt: Label a capex-based ratio as a return, or add a revenue-based margin.
Supporting analysis
What the deck claims: "Contribution Margin grew from ~26% to ~65% (2.5x)"; chart "Contribution Margin in % of capex (by cohort)"; prices raised in 2020.
Presentation choice: The denominator changes what the number means.
When it does not fit: Don't compare a capex ratio with revenue margins.
Revenue-based financing. Case study of Coastal Co.
Clearbanc deck, slide 19. Exact stored slide matched to this analysis.
Our analysis: Revenue presented as LTV; contribution claim unsupported.
Evidence and limitation: Our calculations: $18,000 fee is 0.45% of $4M; about $455 revenue and $34 marketing per subscriber; no variable costs shown.
What a founder can adapt: Show product and fulfilment costs per subscriber.
Supporting analysis
What the deck claims: $300K funding; 8.8K new subscribers; "$4M of LTV over the next 12 months"; "effective cost margin of 0.45%"; "$2+ in contribution margin" per dollar.
Presentation choice: Contribution needs costs, and none are on the slide.
When it does not fit: Don't call revenue contribution.
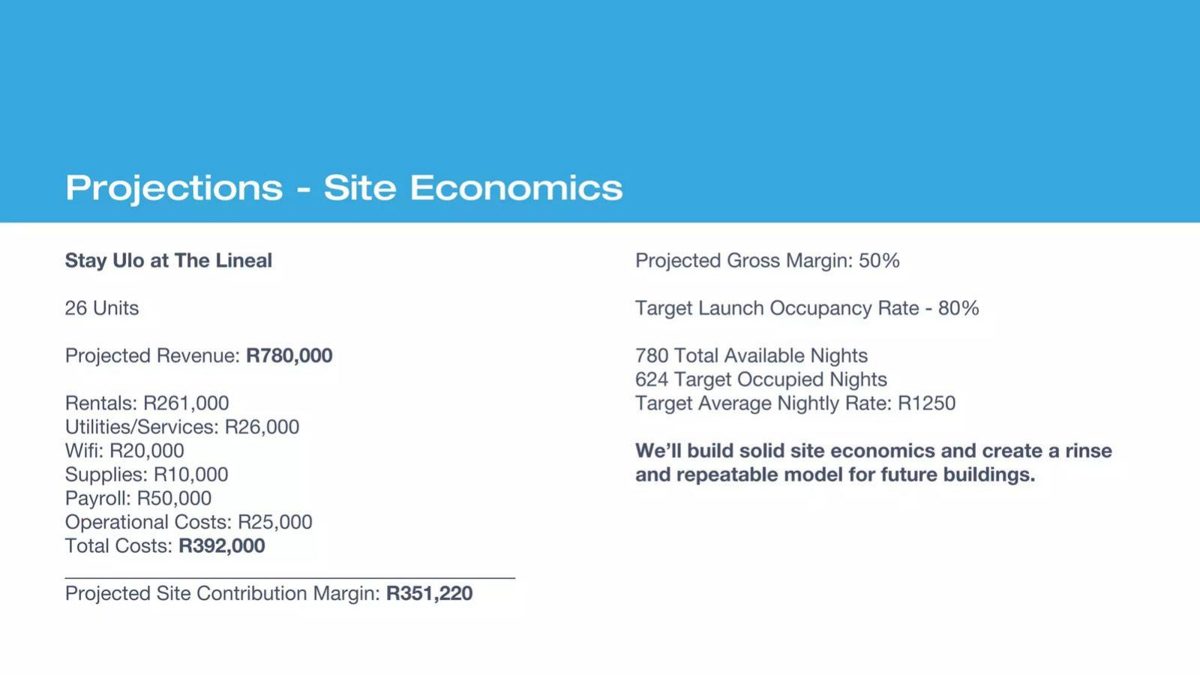
Before: Projected Revenue: R780,000 … Total Costs: R392,000 … Projected Site Contribution Margin: R351,220
After: Projected month: revenue R780,000 − costs R392,000 = site contribution R388,000 (50%), before head office and marketing.
What improved: Makes Stay Ulo's projection add up and states what is excluded.
What contribution margin tells an investor
Every sale brings in revenue and triggers some costs: the product itself, shipping, payment fees, a support call, perhaps the marketing that won the customer. Contribution margin is what remains after those variable costs. It is the amount each unit contributes toward the fixed costs of running the company, such as salaries, offices and product development, and eventually toward profit. If contribution is negative, growth makes losses bigger; if it is positive and large, growth brings the company toward break-even.
Gross margin (revenue minus cost of goods sold) has an accounting definition; contribution margin does not. The gross-margin guide covers that measure; this guide covers the layer below it. Companies decide which costs count as variable. A marketplace may subtract payment processing and customer support; a subscription business may subtract acquisition cost; a lender may subtract interest and default losses. Several decks in this set go further and name levels (CM I, CM II, CM III), each after another layer of cost.
This flexibility is why investors read contribution margin slides line by line. A 40% margin that excludes marketing and a 40% margin after marketing are very different businesses. So is a margin measured on one well-run location against one projected across a portfolio. Three questions settle most of it. Which costs are subtracted, and which are left for later? What is the denominator (revenue, net revenue, a single revenue stream, or something else)? Is the figure actual, for a named period, or a plan?
The arithmetic check is the same as for any waterfall: revenue minus each listed cost should equal the contribution shown, and contribution divided by the stated denominator should give the stated percentage. Small rounding gaps are normal; gaps larger than rounding usually mean a cost line is missing from the slide or a figure was changed without updating the others.
Contribution margin that adds up
Stay Ulo's page 11, "Business Model", gives a "February Snapshot" for its Atholl Gate building: 7 units, total revenue R221,179, rentals R83,000, utilities and services R19,000, supplies R3,500, payroll R28,000, total costs R133,500 and "Site Contribution Margin: R87,679". The right column shows gross margin 40%, February occupancy 93%, 196 available nights, 182.28 occupied nights and an average nightly rate of R1213, and says it was "only our 3rd month with zero marketing expenditure". Our checks: the four costs add to R133,500; R221,179 minus R133,500 is R87,679; that is 39.6% of revenue, the 40% shown; 7 units × 28 nights is 196; 182.28 over 196 is 93%; 182.28 × R1213 is about R221,100, close to the revenue. Every number reconciles. The slide also tells the reader what is not in it: marketing was zero, and head office costs are outside a site margin. The one naming issue is that the 40% is labelled gross margin while the rand figure is called contribution.
Edurino's page 15 shows two per-customer waterfalls, 2022 and 2024, headed "Contribution margin II to increase from 9% to 29% within first years". In 2022: LTV €97, COGS €37, gross margin €60 (62%), marketing €48, CM I €12 (13%), sales €3, CM II €9 (9%). In 2024: LTV €158, COGS €56, gross margin €102 (64%), marketing €54, CM I €48 (30%), sales €1, CM II €47 (29%). Footnotes say the 2022 starter kit includes 3 figures and the 2024 kit 6, and that COGS include production, packaging, shipment, a 40% retailer share and 15% online commissions. Our checks: every subtraction is right. The percentages are close but not exact: €12 over €97 is 12.4% (shown 13%), €102 over €158 is 64.6% (shown 64%) and €47 over €158 is 29.7% (shown 29%). The structure is the model to copy: each level is named, each cost is on the chart, and the base (lifetime revenue per customer) is stated. The 2024 column is a plan, and most of the improvement comes from selling twice as many figures per customer while marketing rises only €6.
JVSP's page 9, "Finantials", is a five-year forecast in thousands of euros: income 360 in 2018e rising to 5,982 in 2022e (licences 290 to 5,182, services 70 to 800), expenses including marketing and software development, "Contribution margin (*)" of 205 rising to 4,342, shown as 71% to 84% of licence income, and cash flow of −41 rising to 3,183. The footnote defines the margin: "Licenses income - marketing - salesforce/support - cloud". Our checks: 205 over 290 is 71% and 4,342 over 5,182 is 84%; income minus expenses gives the cash flow line (360 − 402 is −42, shown −41). The definition is the strength: a reader knows services revenue and software development are excluded. The weakness is that only marketing is shown among the subtracted costs; licence income minus marketing is 212 in 2018, so about 7 of sales, support and cloud cost is implied but not listed, and the margin is measured on licences only, which flatters it compared with total income.
Contribution margin over time and by market
Sonder's page 26 has two charts, "Contribution margin by market" and "EBITDA margin by market", for Montreal, Boston, Chicago, San Diego, New Orleans and London from January to December 2018, under the heading "...making all of our markets with over 100 live units profitable." Chicago starts around −6% contribution and London around −21%; by December all six are roughly between 10% and 20%. On EBITDA, several cities start well below zero and all six end the year above it, most between about 3% and 17%. Read together, the charts show the gap between the two measures (local overhead) and which cities cover it. The slide does not define which costs are in each measure, and values have to be read from the lines, but showing both margins for each market is more informative than a single blended percentage.
Everphone's page 12, "everphone is a Service and customers are paying for it", shows "Contribution Margin grew from ~26% to ~65% (2.5x)" on a chart titled "Contribution Margin in % of capex (by cohort)" from 2019 to early 2021, with a note that prices were raised in 2020 "which did not hinder sales success". Our check: 65 over 26 is 2.5. The unusual part is the denominator. For a device-as-a-service business, contribution as a share of the capital spent on devices is a return measure, not a margin on revenue, and it is not comparable with other companies' contribution margins. The line also swings a lot, peaking above 80% in mid-2020 and dipping to about 42% in late 2020, so the "~65%" end point is one reading of a volatile series.
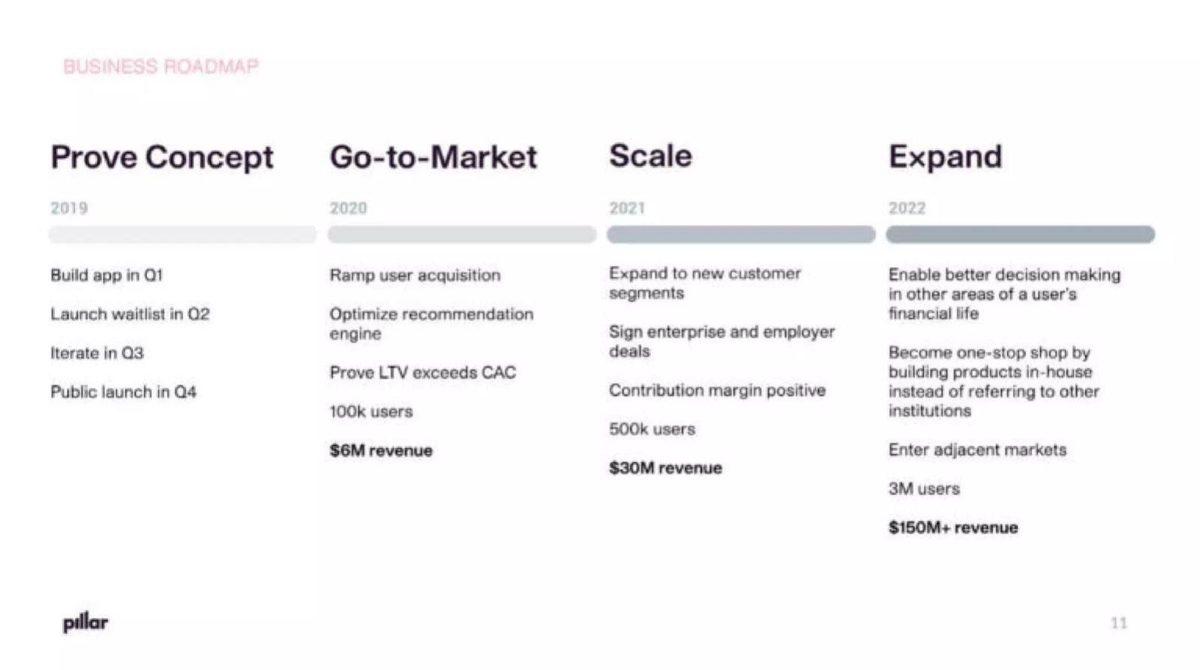
Pillar's page 11, "Business Roadmap", places "Contribution margin positive" under 2021 ("Scale"), alongside 500k users and $30M revenue, after 2020's "Prove LTV exceeds CAC", 100k users and $6M revenue. Our calculations: both years imply $60 of revenue per user, and 2022's 3M users and $150M+ imply about $50. A milestone like this is useful because it tells investors when the company expects each additional user to pay for itself. It would be stronger with a definition and a current figure: the slide does not say which costs are included or how far below zero contribution is today.
Contribution margin that does not add up or is not comparable
Stay Ulo's page 17, "Projections - Site Economics", applies the same format to its next building, The Lineal: 26 units, projected revenue R780,000, rentals R261,000, utilities and services R26,000, wifi R20,000, supplies R10,000, payroll R50,000, operational costs R25,000, total costs R392,000 and "Projected Site Contribution Margin: R351,220", with projected gross margin 50%, 80% target occupancy, 780 available nights, 624 target occupied nights and a target nightly rate of R1250. Our calculations: the six costs add to R392,000 and 624 × R1250 is R780,000, so both totals are right, but R780,000 minus R392,000 is R388,000, not R351,220. R388,000 is 49.7% of revenue, which matches the 50% shown; R351,220 is 45%. Either a cost line is missing or the margin was left from an earlier version. Next to the February snapshot, which reconciles perfectly, the projection shows how easily a template carries a stale number.
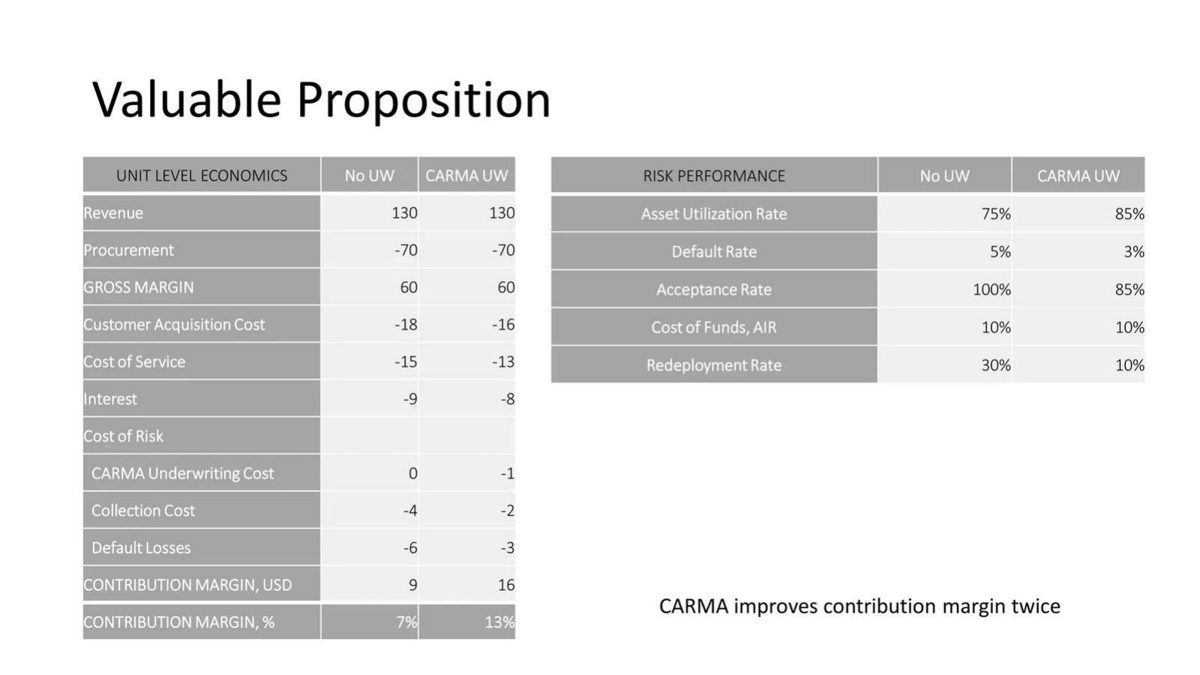
Carma's page 7, "Valuable Proposition", compares unit-level economics without and with its underwriting ("No UW" and "CARMA UW"): revenue 130 and 130, procurement −70 and −70, gross margin 60 and 60, customer acquisition −18 and −16, cost of service −15 and −13, interest −9 and −8, underwriting cost 0 and −1, collection −4 and −2, default losses −6 and −3, and "CONTRIBUTION MARGIN, USD" 9 and 16 (7% and 13%), with the line "CARMA improves contribution margin twice". A second table shows utilisation, default, acceptance and redeployment rates. Our calculations: 60 minus the listed costs is 8 without underwriting and 17 with it, not 9 and 16; 17 over 130 is 13%, the percentage shown, but 16 over 130 is 12%. The cost structure is admirably complete, including interest and bad debt, which lenders often leave out. But the totals do not follow from the rows, and 16 over 9 is 1.8 times, not twice.
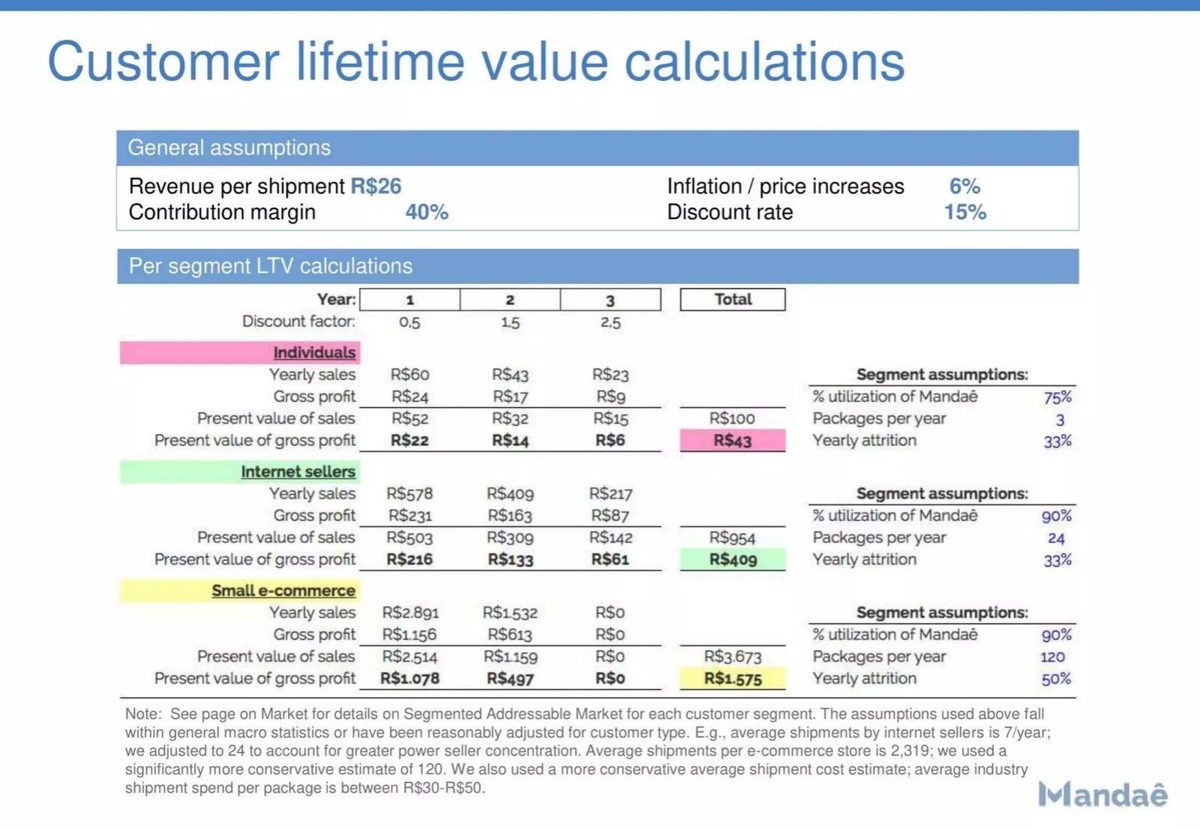
Mandaê's page 24, "Customer lifetime value calculations", states general assumptions of R$26 revenue per shipment, a 40% contribution margin, 6% inflation and a 15% discount rate, then computes three-year lifetime values for individuals, internet sellers and small e-commerce stores. Our checks: each "gross profit" row is 40% of sales (R$60 gives R$24; R$578 gives R$231; R$2,891 gives R$1,156), so the table labels as gross profit what its assumptions call contribution margin. The present values also match whole-year discounting (R$60 ÷ 1.15 is about R$52; R$43 ÷ 1.15² is about R$32) rather than the 0.5, 1.5 and 2.5 discount factors printed at the top. The note explaining the segment assumptions is thorough, but a reader cannot tell which costs the 40% excludes.
Contribution margin stated without its costs
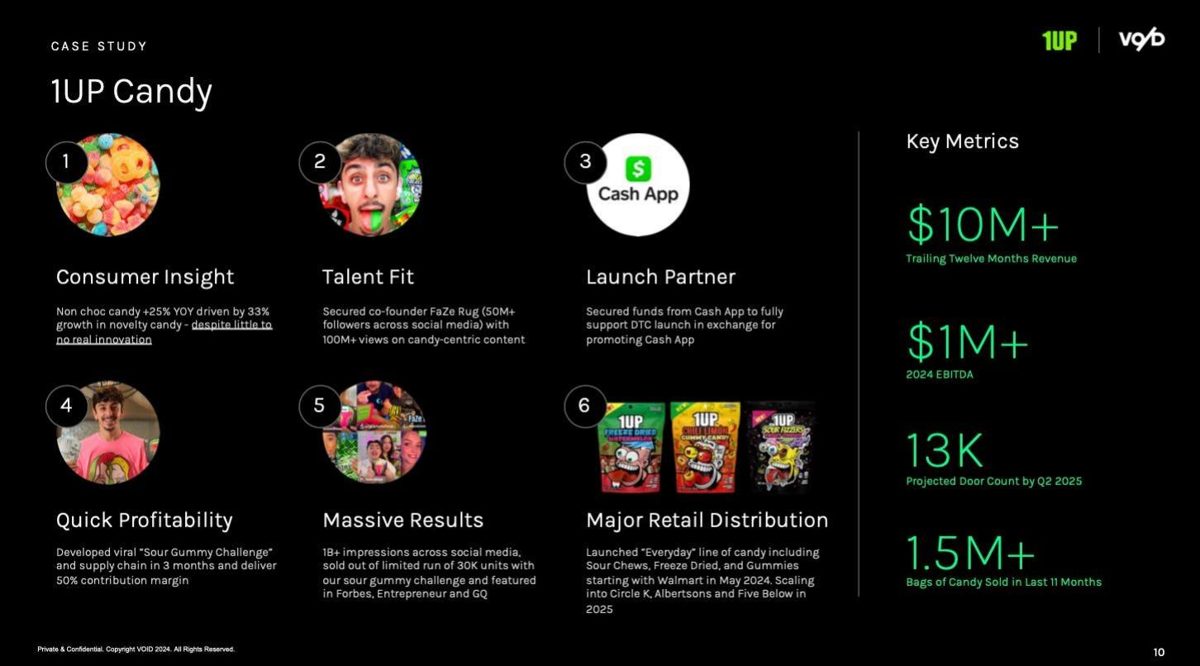
VOID's page 9 is a case study of 1UP Candy with key metrics of $10M+ trailing twelve months revenue, $1M+ 2024 EBITDA, 13K projected door count by Q2 2025 and 1.5M+ bags sold in the last 11 months. Under "Quick Profitability" it says the brand "developed viral 'Sour Gummy Challenge' and supply chain in 3 months and deliver 50% contribution margin". The slide gives no costs, no period and no definition, so the 50% cannot be compared with anything. Our calculation: $1M of EBITDA on $10M of revenue is a 10% EBITDA margin, which would leave about 40 points of revenue for fixed costs and anything excluded from contribution, if both figures refer to the same period.
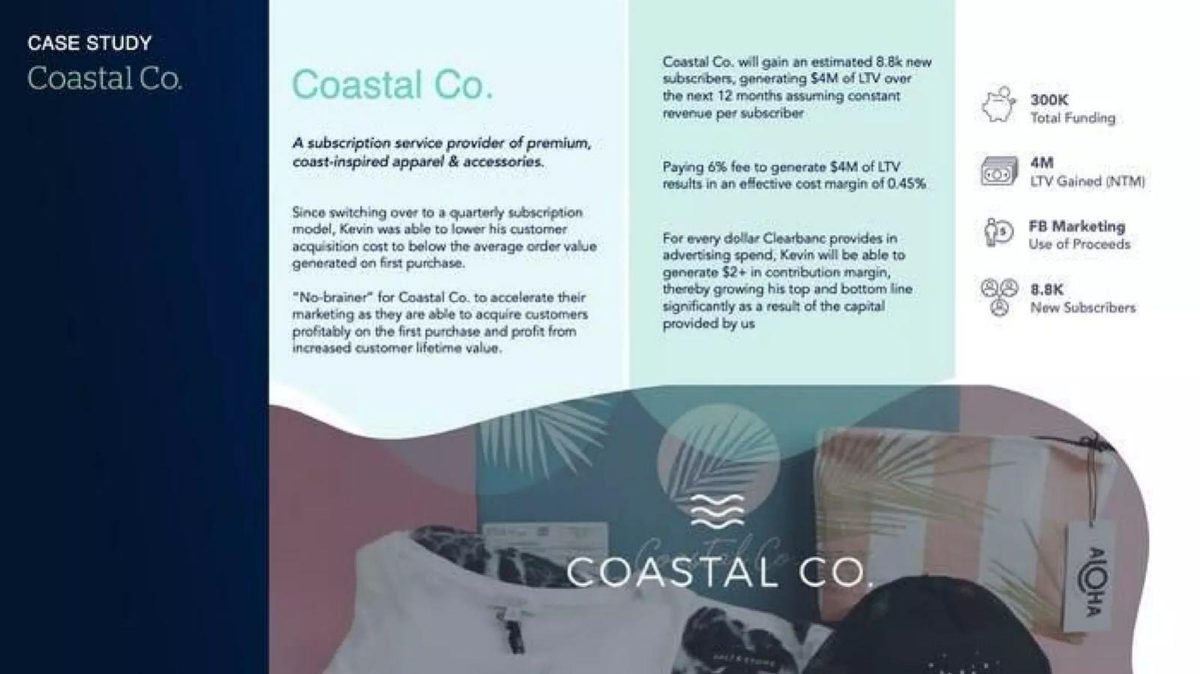
Clearbanc's page 19 is a case study of Coastal Co., a subscription apparel company, funded with $300K for Facebook marketing: 8.8K new subscribers and "$4M of LTV over the next 12 months assuming constant revenue per subscriber"; "Paying 6% fee to generate $4M of LTV results in an effective cost margin of 0.45%"; and "For every dollar Clearbanc provides in advertising spend, Kevin will be able to generate $2+ in contribution margin". Our calculations: a 6% fee on $300K is $18,000, which is 0.45% of $4M, so that line checks; $4M over 8.8K subscribers is about $455 of revenue each over a year, and $300K over 8.8K is about $34 of marketing each. But the $4M is revenue, and the slide gives no product, fulfilment or other variable costs, so the claim of $2+ of contribution per dollar is not shown by any figure on it.
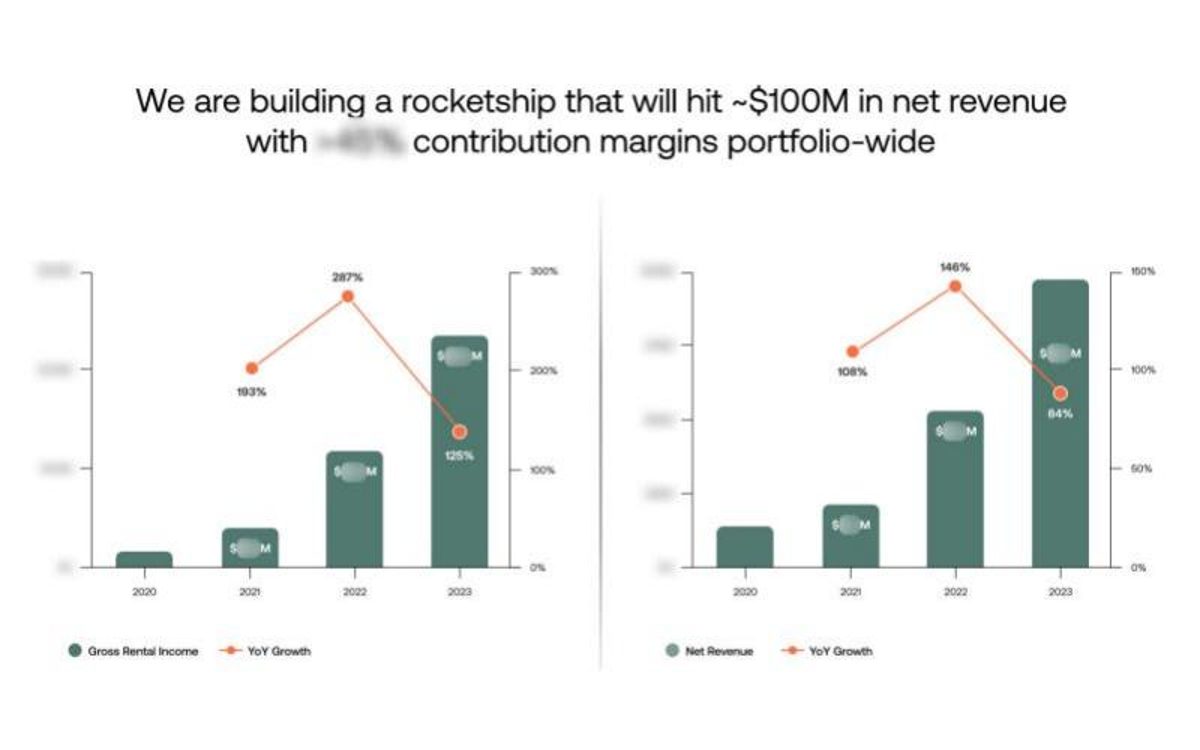
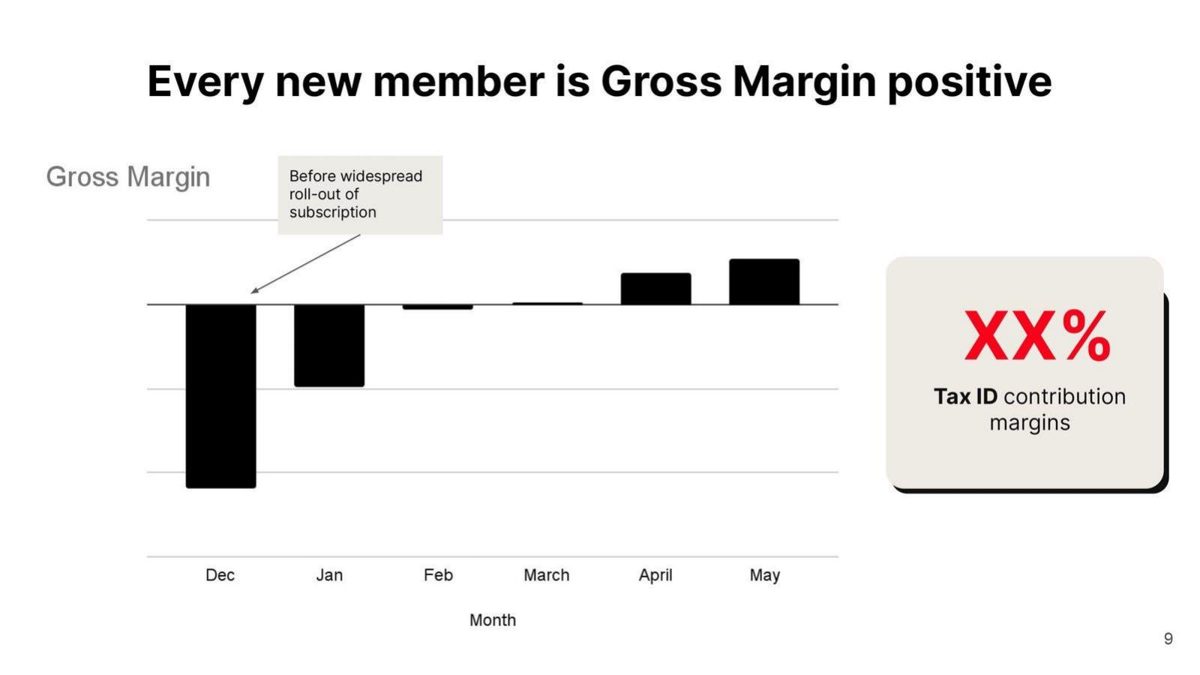
June Homes' page 19 says "We are building a rocketship that will hit ~$100M in net revenue with [masked] contribution margins portfolio-wide", with charts of gross rental income and net revenue from 2020 to 2023 whose values are masked in the shared copy; year-on-year growth labels (for example 287% and 149% in 2022) remain. Maza's page 9, "Every new member is Gross Margin positive", shows a monthly gross margin bar chart from December to May with no axis values, and a callout reading "XX% Tax ID contribution margins". Both slides may have carried the numbers in the original meeting, but as shared, the margin is the one figure an investor cannot read.
How to show contribution margin
Write the cost lines out and total them. Stay Ulo's February snapshot is the template: revenue, each variable cost, the total and the margin, with one period and one location. Then do the same arithmetic on every projection before sharing it.
Define the levels. If you show more than one contribution margin, name them and say what separates them, as Edurino does with CM I after marketing and CM II after sales costs. If you use a single figure, say whether acquisition cost is included; investors will ask.
State the denominator. Contribution as a share of total revenue is the default. If you divide by one revenue stream (JVSP's licences), by capital (Everphone's capex) or by lifetime revenue (Edurino's LTV), label it clearly, because it will not be comparable with other companies' margins.
Say whether the figure is actual or planned, and for which period. A measured month from one site and a projected portfolio average carry different weight. Pillar's roadmap puts a date on reaching positive contribution, which is useful; adding today's figure would make it testable.
Show contribution next to overhead. Sonder's pairing of contribution and EBITDA margin by city shows investors how far each market is from covering its own costs. A single blended margin can hide a loss-making market behind a profitable one.
Don't leave it blank. If the figure is confidential for a shared version, say so and give a range or the structure; a masked percentage under a headline about profitability invites the worst assumption.
Common mistakes
Rows don't add up. Recompute the total from the lines shown.
Costs not listed. Show what is subtracted.
Unclear denominator. Say what the percentage is of.
Levels not named. Label CM I, CM II and what separates them.
Actual and plan mixed. Say which figures are measured.
Placeholder left in. Fill in or remove masked margins.
Diagnostic checklist
Every subtracted cost is listed.
Revenue minus costs equals the contribution shown.
The percentage's denominator is stated.
Excluded costs (marketing, overhead) are named.
The period is stated and actuals are separated from plans.
Multiple margin levels are named.
Contribution is shown next to a margin after overhead where possible.
Frequently asked questions
What is the difference between gross margin and contribution margin?
Gross margin subtracts cost of goods sold; contribution margin subtracts all costs that vary with each sale, which can include delivery, support, marketing or bad debt. Edurino shows both on one waterfall.
Should contribution margin include customer acquisition cost?
Either can be right, but say which. Edurino's CM I is after marketing; Stay Ulo's site margin is from a month with zero marketing; Carma includes acquisition in its unit economics.
What should the percentage be divided by?
Revenue, unless you say otherwise. Everphone divides by capex and JVSP by licence income, which makes their figures hard to compare.
How do I check my own slide?
Subtract every listed cost from revenue and compare with the margin shown. Stay Ulo's projection and Carma's table both fail this check.
Can I show contribution margin as a milestone?
Yes, as Pillar does for 2021, but include today's figure and the definition so investors can see how far there is to go.
How we chose these examples
Search (2026-09-30): the durable corpus index (docs/seo/artifacts/corpus-search, 70,729 unique pages, deduplicated by deck-file sha256 + page) was searched for "contribution margin"; 43 pages matched, and after excluding public companies, investor-relations and IPO presentations, and pages already used in other guides, 29 remained.
Fourteen candidate pages were rendered from the original public deck files and read from the images; thirteen are used: Stay Ulo 11 and 17, Edurino 15, JVSP 9, Sonder 26, Everphone 12, Pillar 11, Carma 7, Mandaê 24, VOID 9, Clearbanc 19, June Homes 19 and Maza 9.
Left out after reading: Tonies 12 (a company-level financial targets table from what appears to be a listing-stage presentation; excluded under the public-company rule). Sonder 31 was rendered but not read (same deck as Sonder 26). Not read: Instructure and Evine investor presentations and MedReleaf (public companies); Compass Pathways 2, Eaze 9 and Everphone 2 (already used in other guides). The gross-margin guide covers cost of goods sold; this guide covers the contribution layer below it.
Figures are as printed on each slide; we did not have the companies' underlying data. How we built this: drafted and checked with AI assistance (editorial model review against the original slide images); no human editor has reviewed this guide.