The SaaS Magic Number in a Pitch Deck: Which Spend, Which
How to calculate and show sales efficiency (the magic number) on a pitch deck slide: new ARR versus the prior quarter's sales and marketing spend.
The Magic Number in a Pitch Deck: Show Which Spend Bought Which Revenue
The magic number answers one question investors ask of every SaaS company that wants money for sales hiring: for each dollar spent on sales and marketing, how much new recurring revenue came back? Three real decks show three ways of answering. Klue states its formula in words and charts four quarters against a benchmark line. Juro shows a single "gross sales efficiency" of 0.9 with no definition. BusRight calls a different measure, ARR booked per salesperson per month, "sales efficiency". This guide shows how to calculate the number consistently, what to put on the slide, and how to explain a trend.
TL;DR
The magic number is the increase in recurring revenue in a quarter, annualised, divided by the previous quarter's sales and marketing spend. With ARR: (this quarter's ending ARR − last quarter's ending ARR) ÷ last quarter's S&M spend. A figure near or above 1 means a quarter's spend returned roughly its own size in new annual recurring revenue. On a slide, print the number for at least three quarters, state the formula in one line (which revenue, gross or net of churn; which spend, including salaries or not; which quarter lag), and put it next to LTV/CAC or payback so investors can see whether falling efficiency is a cost problem or the price of growing faster.
Three real ways to show sales efficiency
Each slide was read from its original deck page. Our arithmetic and readings by eye are labelled; company figures are reported as printed and not verified.
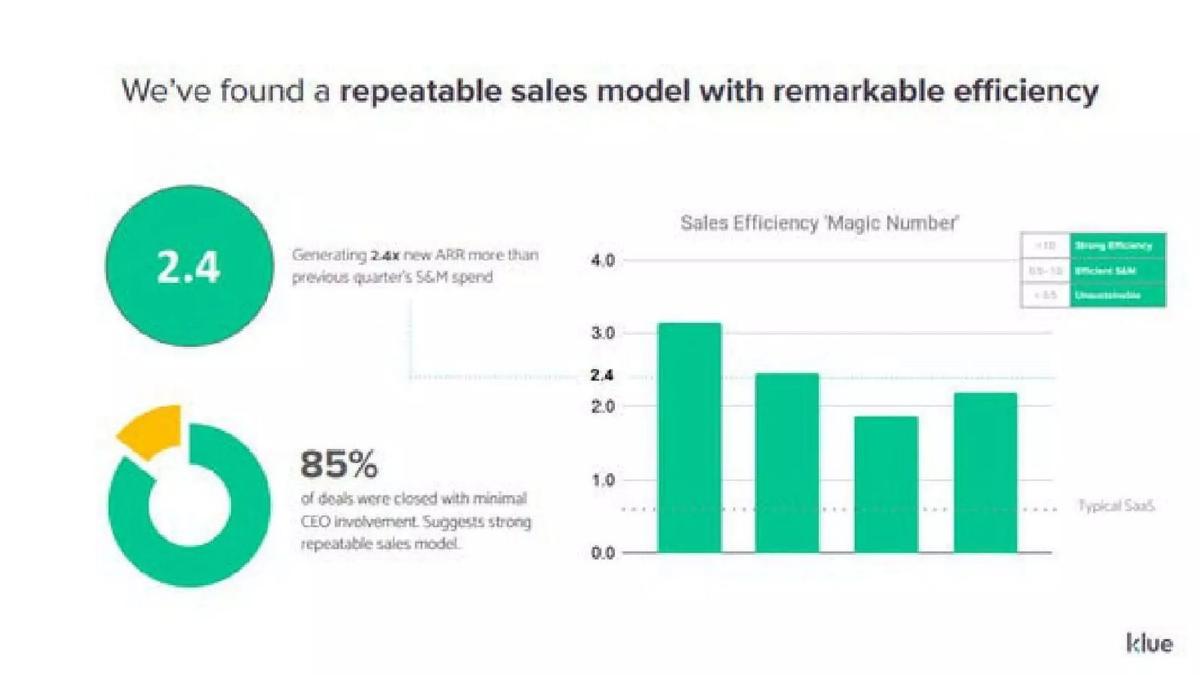
Klue unit economics slide — slide 16
Canadian competitive-intelligence software company; page 16, "We've found a repeatable sales model with remarkable efficiency".
Klue deck, slide 16. Exact stored slide matched to this analysis.
Our analysis: The clearest definition of the three: a reader can tell what was divided by what, and the benchmark line gives a scale. It loses credibility in the details: unlabelled quarters, a headline that isn't the latest figure, and a key too small to read.
Evidence and limitation: Our reading by eye: the bars are about 3.1, 2.4, 1.9 and 2.2; the quarters are not labelled. The headline 2.4 matches the second bar, not the latest. The "Typical SaaS" line sits a little above 0.5. The sentence states the numerator (new ARR) and the lag (previous quarter's S&M) but not whether churn is subtracted or what S&M includes.
What a founder can adapt: Label each bar with its quarter and value, make the headline the latest quarter (or say which quarter it is), and cite where the benchmark comes from.
Supporting analysis
What the deck claims: A circle "2.4": "Generating 2.4x new ARR more than previous quarter's S&M spend". A chart, "Sales Efficiency 'Magic Number'", four bars on a 0–4 axis, a dotted line at 2.4 and a lower dashed line labelled "Typical SaaS". A small key with three bands (strong efficiency, efficient S&M, unsustainable; thresholds too small to read reliably in the stored file). Also "85% of deals were closed with minimal CEO involvement. Suggests strong repeatable sales model."
Presentation choice: It shows how one sentence of formula and a reference line make the number interpretable.
When it does not fit: Don't headline a figure that isn't the latest without saying why.
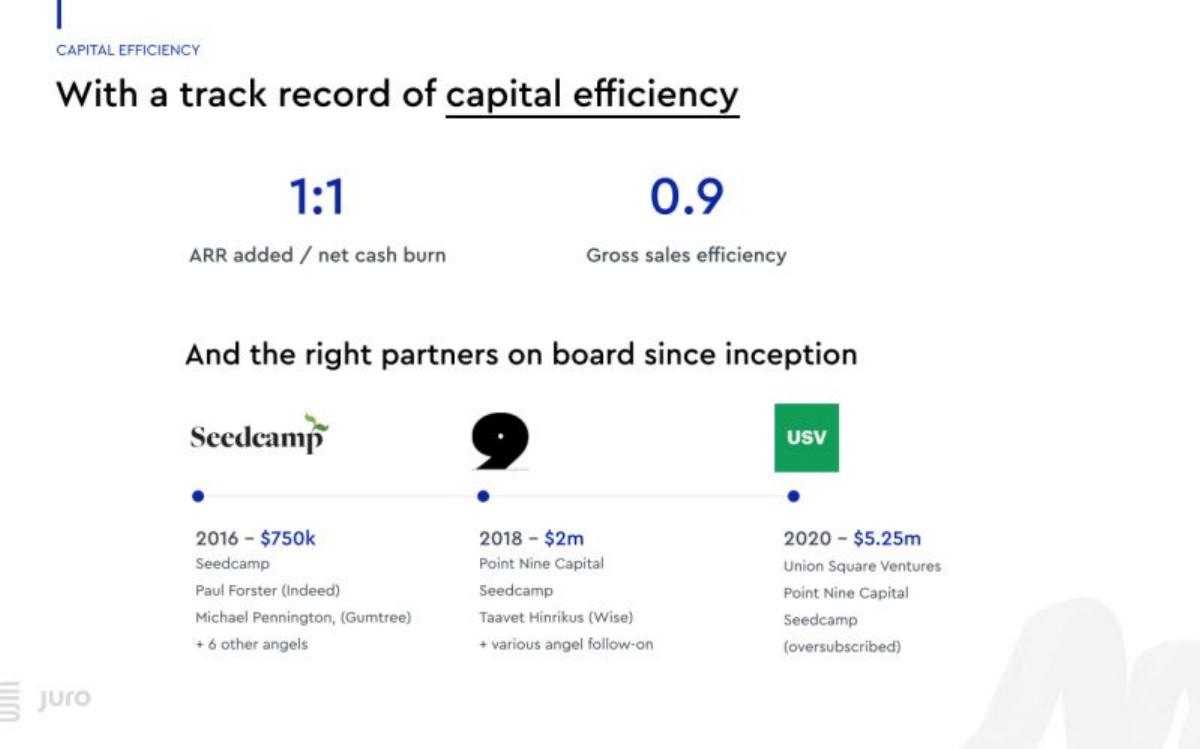
UK contract-management software company; page 13, "With a track record of capital efficiency", above its funding history.
Juro deck, slide 13. Exact stored slide matched to this analysis.
Our analysis: Placing sales efficiency next to a capital-efficiency figure is a good pairing, because together they separate how well sales spend converts from how much the whole company burns. But an undefined single number can't be compared with another company's or with Juro's own later figures.
Evidence and limitation: Our reading: the first figure is defined on the slide (ARR added per dollar of net burn, the inverse of a burn multiple of 1). The second is not: "gross" probably means new ARR before churn, but the slide gives no formula, period or spend basis. It is one figure, with no trend.
What a founder can adapt: Add the formula and period under the figure: "0.9 = Q[x] new + expansion ARR ÷ Q[x−1] S&M incl. salaries" (bracketed items are placeholders the slide does not give).
Supporting analysis
What the deck claims: Two figures: "1:1 ARR added / net cash burn" and "0.9 Gross sales efficiency". Below: funding rounds from 2016 ($750k, Seedcamp) to 2020 ($5.25m, Union Square Ventures).
Presentation choice: It shows the pairing of sales efficiency with burn, and the cost of not defining the number.
When it does not fit: Don't use "gross" without saying what it is gross of.
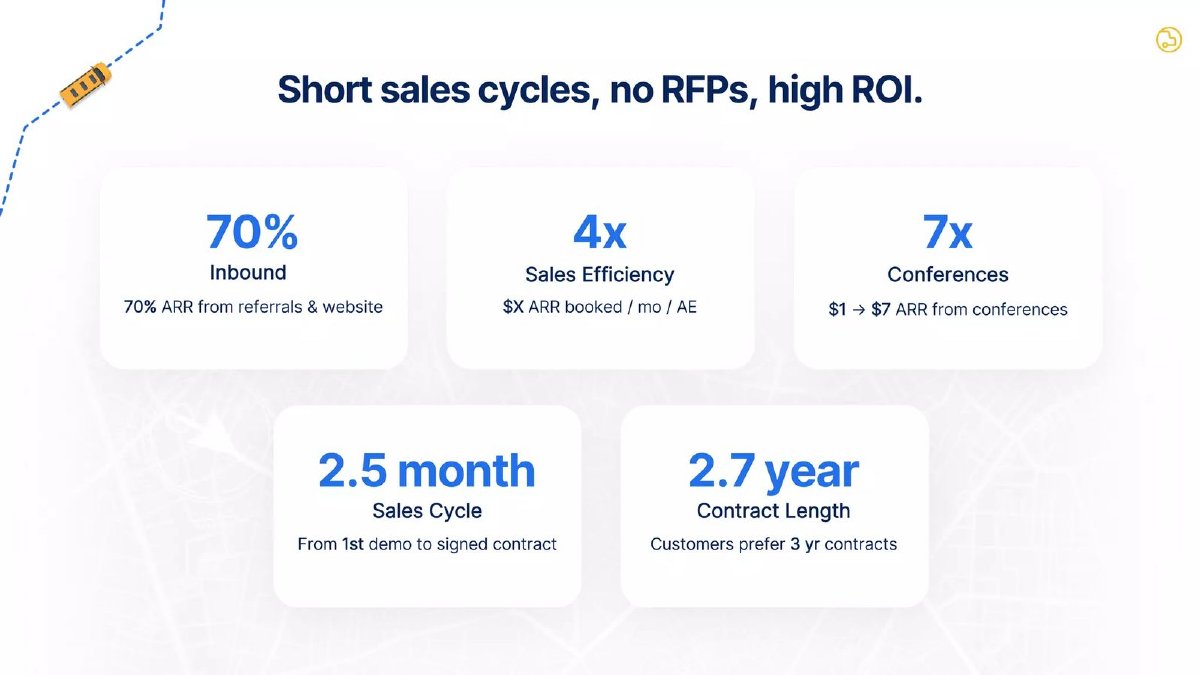
US school-transport routing software company; page 8 of its deck, "Short sales cycles, no RFPs, high ROI."
BusRight deck, slide 8. Exact stored slide matched to this analysis.
Our analysis: A useful warning: "sales efficiency" means different things in different decks. An investor who reads 4x as a magic number would draw the wrong conclusion. The slide's other tiles (short cycle, multi-year contracts) are strong supporting evidence, and a properly defined efficiency figure would make them more persuasive.
Evidence and limitation: Our reading: the "4x Sales Efficiency" tile is defined as ARR booked per month per account executive, which is a productivity measure, not a magic number, and "4x" has no stated base (4x what: cost of the AE, a benchmark, an earlier period?). The conference tile is closer to a magic number for one channel ($7 of ARR per $1 spent) but gives no period or cost basis.
What a founder can adapt: Either rename the tile ("ARR booked per AE per month: $[x], [y]x the AE's fully loaded cost") or add a separate magic number with its formula.
Supporting analysis
What the deck claims: Five tiles: "70% Inbound: 70% ARR from referrals & website"; "4x Sales Efficiency: $X ARR booked / mo / AE"; "7x Conferences: $1 → $7 ARR from conferences"; "2.5 month Sales Cycle: From 1st demo to signed contract"; "2.7 year Contract Length: Customers prefer 3 yr contracts".
Presentation choice: It shows how the same label can cover a different measure, and why the definition matters as much as the number.
When it does not fit: Don't print a multiple without saying what it is a multiple of.
After: Magic number (net new ARR ÷ prior-quarter S&M incl. headcount), Q[1]–Q[4]: [a], [b], [c], [d]; latest [d]. Fell in Q[3] as we [reason]; LTV/CAC [r] over the same quarters.
What improved: Built from Klue's page 16. Quarter labels, the net basis, the reason and LTV/CAC are placeholders the slide does not give.
After: ARR booked per AE per month: $[x] ([y]x fully loaded AE cost). Magic number Q[n]: [z].
What improved: Built from BusRight's page 8. Separates productivity from the magic number; bracketed values are placeholders.
What the magic number measures, and what it doesn't
Most growth metrics on a SaaS slide describe results: ARR, customer count, retention. The magic number connects a result to a cost. It takes the new recurring revenue added in a quarter and compares it with what was spent on sales and marketing to win it. Because deals take time to close, the usual version compares this quarter's growth with last quarter's spend.
One common formula, as described by Ben Murray of The SaaS CFO: take the quarter's recurring revenue minus the previous quarter's, multiply by four to annualise, and divide by the previous quarter's sales and marketing expense. If you already track ARR, the multiplication is built in: net new ARR for the quarter divided by the prior quarter's S&M spend gives the same result.
What it doesn't measure: profit. Murray's point is that a magic number of 1 means the incremental revenue takes about a year to repay one quarter's sales and marketing spend, before any cost of delivering the product. A company with 50% gross margins needs roughly two years to cover the same spend from gross profit. The number is also blind to how long customers stay, which is what LTV/CAC adds.
This guide is about presenting your own figures clearly. It is not accounting or investment advice, and the magic number has no standard definition, so state yours. (The SaaS CFO (Ben Murray))
Four choices that change the number
Revenue: net or gross. Net new ARR subtracts churn and contraction; some companies use only new and expansion ARR (gross). Gross gives a higher number and isolates what sales won; net shows what the business kept. Either is defensible if labelled. Juro's "gross sales efficiency" probably means a gross version, but the slide does not say.
Spend: what's in it. Sales and marketing spend can mean paid media only, or all sales and marketing salaries, commissions, tools and events. A short footnote such as "includes fixed headcount costs" tells a reader the figure is the conservative version; none of the three slides below says which costs are in. Leaving salaries out can double the number.
Lag: which quarter's spend. The common convention is the previous quarter. Klue says so in words ("new ARR more than previous quarter's S&M spend"). If your sales cycle is long, a one-quarter lag can understate efficiency in a hiring quarter and overstate it later; say so rather than switching lags from quarter to quarter.
Period: quarterly, not cumulative. A single figure for "last year" hides the trend, and the trend is usually the point.
A worked example (hypothetical)
Take an invented company. In Q1 it spends $300K on sales and marketing, including salaries. In Q2 its ARR rises from $2.00M to $2.36M: $420K from new customers and expansion, less $60K of churn and downgrades. Net new ARR is $360K.
Net magic number: 360 ÷ 300 = 1.2. Gross magic number (new and expansion only): 420 ÷ 300 = 1.4. If the company had counted only $150K of paid marketing and left out salaries, the net figure would read 2.4, twice as flattering and not comparable with anyone who includes headcount.
Now the gross-margin check. At 75% gross margin, $360K of new ARR earns $270K of gross profit a year, so the $300K of spend takes about 13 months to recover (300 ÷ 270 × 12). That payback figure, not the magic number alone, is what an investor will compare with how long customers stay. All figures in this example are invented for illustration.
When a falling magic number is, and isn't, a problem
Efficiency usually falls as a company spends more: the first salespeople sell to the warmest leads, and new hires take months to ramp. A fall is a concern when spend is flat and new ARR is shrinking, or when the number drops below the point where payback becomes longer than customers typically stay.
A fall that comes with a rise in a lifetime metric needs explaining rather than hiding. If the magic number falls over three quarters while LTV/CAC rises, both can be true at once: the company is spending more per quarter (so less new ARR per dollar this quarter), but the customers it wins are worth more over their lifetime. One sentence on the slide turns an apparent decline into a deliberate trade.
Klue's bars also fall then partly recover (by eye, about 3.1, 2.4, 1.9 and 2.2). Its headline "2.4" matches the second bar, not the latest, and the quarters are unlabelled, so a reader can't tell which period the headline describes. State the latest quarter, label every bar, and if you highlight a different quarter, say why.
How to lay it out on the slide
Put the formula in a one-line footnote directly under the figure, not in an appendix: which revenue (net or gross), which spend (with or without salaries) and which lag. Then show the last three or four quarters as a small table or labelled bars, with the latest quarter clearly marked as the headline. If you also show a benchmark line, name where the threshold comes from and treat it as a convention rather than a rule.
Place one counterweight metric beside the trend, usually LTV/CAC or payback in months, so a reader can judge a fall without asking. Keep the quarter labels identical across both metrics. If you have only one or two quarters of data, say so and show the monthly figures behind them instead of extrapolating a trend you do not yet have; an honest short history is easier to defend than a long one built from estimates.
Finally, keep the same layout from one round to the next. Investors who saw your seed deck will compare it with the Series A version, and a changed definition, lag or spend basis between the two reads as a moved goalpost unless the slide says what changed and why.
What investors will ask after seeing it
What is in the denominator? Expect to be asked whether salaries, commissions, marketing tools and events are included. Have the line items ready.
Does it match your other numbers? Net new ARR in the numerator should match the change in ARR on your traction slide; S&M spend should match your financial statements or monthly management accounts; and the magic number should be consistent with any CAC or payback figure you show. A magic number of 2 alongside an 18-month payback at 80% gross margin is hard to reconcile, so check before the meeting.
What happens with the new money? If you are raising to hire salespeople, investors will apply your magic number to your planned spend. If you plan to spend $1M a quarter on sales and marketing and your magic number is 1.2, they will expect about $1.2M of net new ARR a quarter once the team has ramped. Make sure your forecast is consistent with that, or explain why it isn't.
Common mistakes
Undefined number. State revenue basis, spend basis and lag in one line.
Salaries left out. Excluding headcount inflates the figure; if you do, say so.
One figure, no trend. Show at least three quarters.
Headline isn't the latest. Say which quarter the headline describes.
Fall left unexplained. Give the reason, and a metric such as LTV/CAC that puts it in context.
Same name, different measure. Don't call ARR per salesperson "sales efficiency" without defining it.
Diagnostic checklist
The formula is on the slide: revenue (net or gross) ÷ prior-quarter S&M spend.
The spend basis is stated, including whether salaries are in.
At least three quarters are shown, each labelled.
Any fall or rise has a one-line reason.
LTV/CAC, payback or gross margin sits beside it.
Net new ARR and spend match your traction slide and accounts.
Your forecast is consistent with the efficiency you show.
Frequently asked questions
What is a good SaaS magic number?
Around 1 or above is commonly described as efficient, and well below 1 as a reason to review sales and marketing spend before adding more. These are conventions, not rules, and depend on gross margin and how long customers stay.
How do you calculate the magic number with ARR?
Net new ARR in a quarter (ending ARR minus starting ARR) divided by the previous quarter's sales and marketing spend. With quarterly revenue instead of ARR, take the change in revenue, multiply by four, and divide by the previous quarter's spend.
Is the magic number the same as the burn multiple?
No. The magic number divides new ARR by sales and marketing spend; the burn multiple divides the company's total net burn by net new ARR. The first measures sales efficiency, the second the whole company's capital efficiency.
Should I include salaries in sales and marketing spend?
Usually yes, because most of the cost of selling is people. If you exclude them, say so, because the figure will not be comparable with companies that include them.
How we chose these examples
Discovery (2026-10-04): run 76 searched the deck collection for slides naming the magic number or sales efficiency and found Virti 9, Tive 9, Rippling ($175M deck) 12, Juro 13, Klue 16 and BusRight 8. Closest content read: the live capital-efficiency guide (burn multiple), the live sales-cycle guide (mentions the magic number in one line and quotes Virti on ramp and cycle), the LTV/CAC and payback guides. None teaches the calculation, the spend and revenue choices, the lag, or reading the number against LTV/CAC.
Run 77 rendered Virti 9, Tive 9, Juro 13, Klue 16 and BusRight 8 from the original deck files and read them at full size. Tive 9 was set aside because its magic number is blanked ("x.xx"); Rippling 12 is an illustrative layout and was not needed. v2 (2026-10-06) removed the Virti example and every figure derived from it, because the Virti deck is held under the whole-deck source rule; the three remaining decks (Klue, Juro, BusRight) were screened on every page edge and in full text with no confidentiality or distribution notice, and no deletion or removal request names them. All three are published teardowns. The BusRight 8 image already existed and was matched to the original; Klue 16 and Juro 13 were prepared at 1200px wide and uploaded through the standing slide-image workflow.
Readings of unlabelled charts are by eye and described as such. Ratios are our arithmetic from printed values. Company figures are reported as printed and not verified. This guide explains presentation, not accounting or investment advice. Slide readings and analysis are an AI editorial model review, not human-checked.