How to present affiliate revenue on a pitch deck: commission rate, order value, purchases per user and what you keep.
How to Present Affiliate Revenue on a Pitch Deck
Eight slides from seven real pitch decks show how founders explain affiliate revenue, the commission a startup earns for sending customers to another seller: the rate, the order value it applies to, how often users buy, and what the startup keeps. We recomputed every figure the slides let us check.
TL;DR
An affiliate revenue slide should multiply out one user: average order value, purchases a year, commission rate, and what you keep after any share you pass on. The ShoppingPro does exactly this: a $70 order, 12 orders a year and a 2.5% commission give $21 per user per year; after passing 67% back to users as cashback, it keeps about $7. Holiday Online states a 10% commission per booking and what one listing is worth (about £500 in year one, £1,000 after), so its 2,000-listing target and its £2M revenue goal can be checked against each other. HomeHub builds a five-year affiliate forecast line by line, but three of its yearly totals don't match its own inputs. Zonez multiplies a 4% commission by Etsy's sales and gets $113.6 million, which only works if those sales are $2.84 billion, not the $2.84 million the slide prints. Fat Joe's Cars, Wndrlust and Pixt show a fee, a commission range or a chart, with little behind them.
Affiliate revenue slides from real pitch decks
Each example shows the exact stored slide above its analysis and links to the full teardown. Stage and year are given only where the deck states them. Figures are the company's own claims; where we checked arithmetic, we say so.
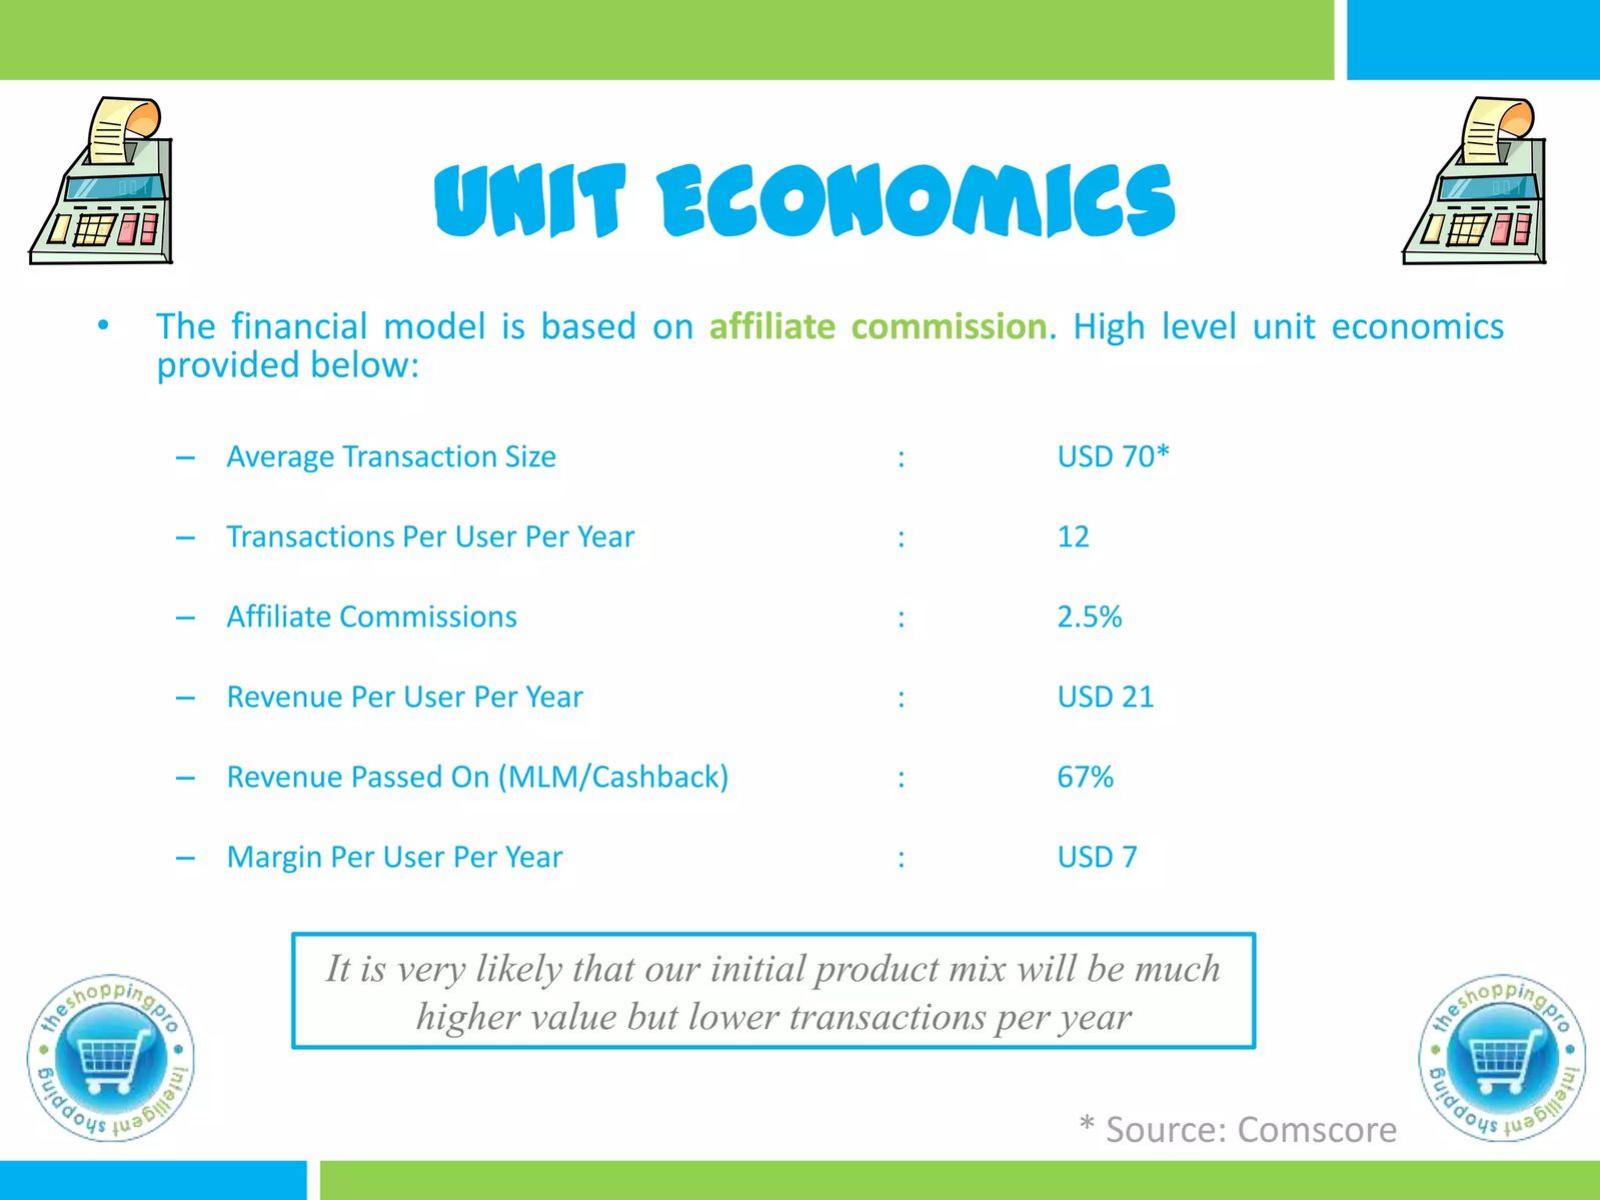
The ShoppingPro business model slide — slide 16
Cashback shopping app earning affiliate commission on purchases.
The ShoppingPro deck, slide 16. Exact stored slide matched to this analysis.
Our analysis: The strongest example: one user's affiliate revenue is built step by step, including the share passed back, and every figure checks out.
Evidence and limitation: Don't show only gross commission if you pass a share back to users.
What a founder can adapt: Use the same six lines for your own model, and add where the commission rate comes from.
Supporting analysis
What the deck claims: Average transaction size USD 70 (Comscore); 12 transactions per user per year; affiliate commissions 2.5%; revenue per user per year USD 21; revenue passed on (MLM/cashback) 67%; margin per user per year USD 7.
Presentation choice: The strongest example: one user's affiliate revenue is built step by step, including the share passed back, and every figure checks out.
When it does not fit: Don't show only gross commission if you pass a share back to users.
Holiday rental booking site. Projections run 2020 to 2023.
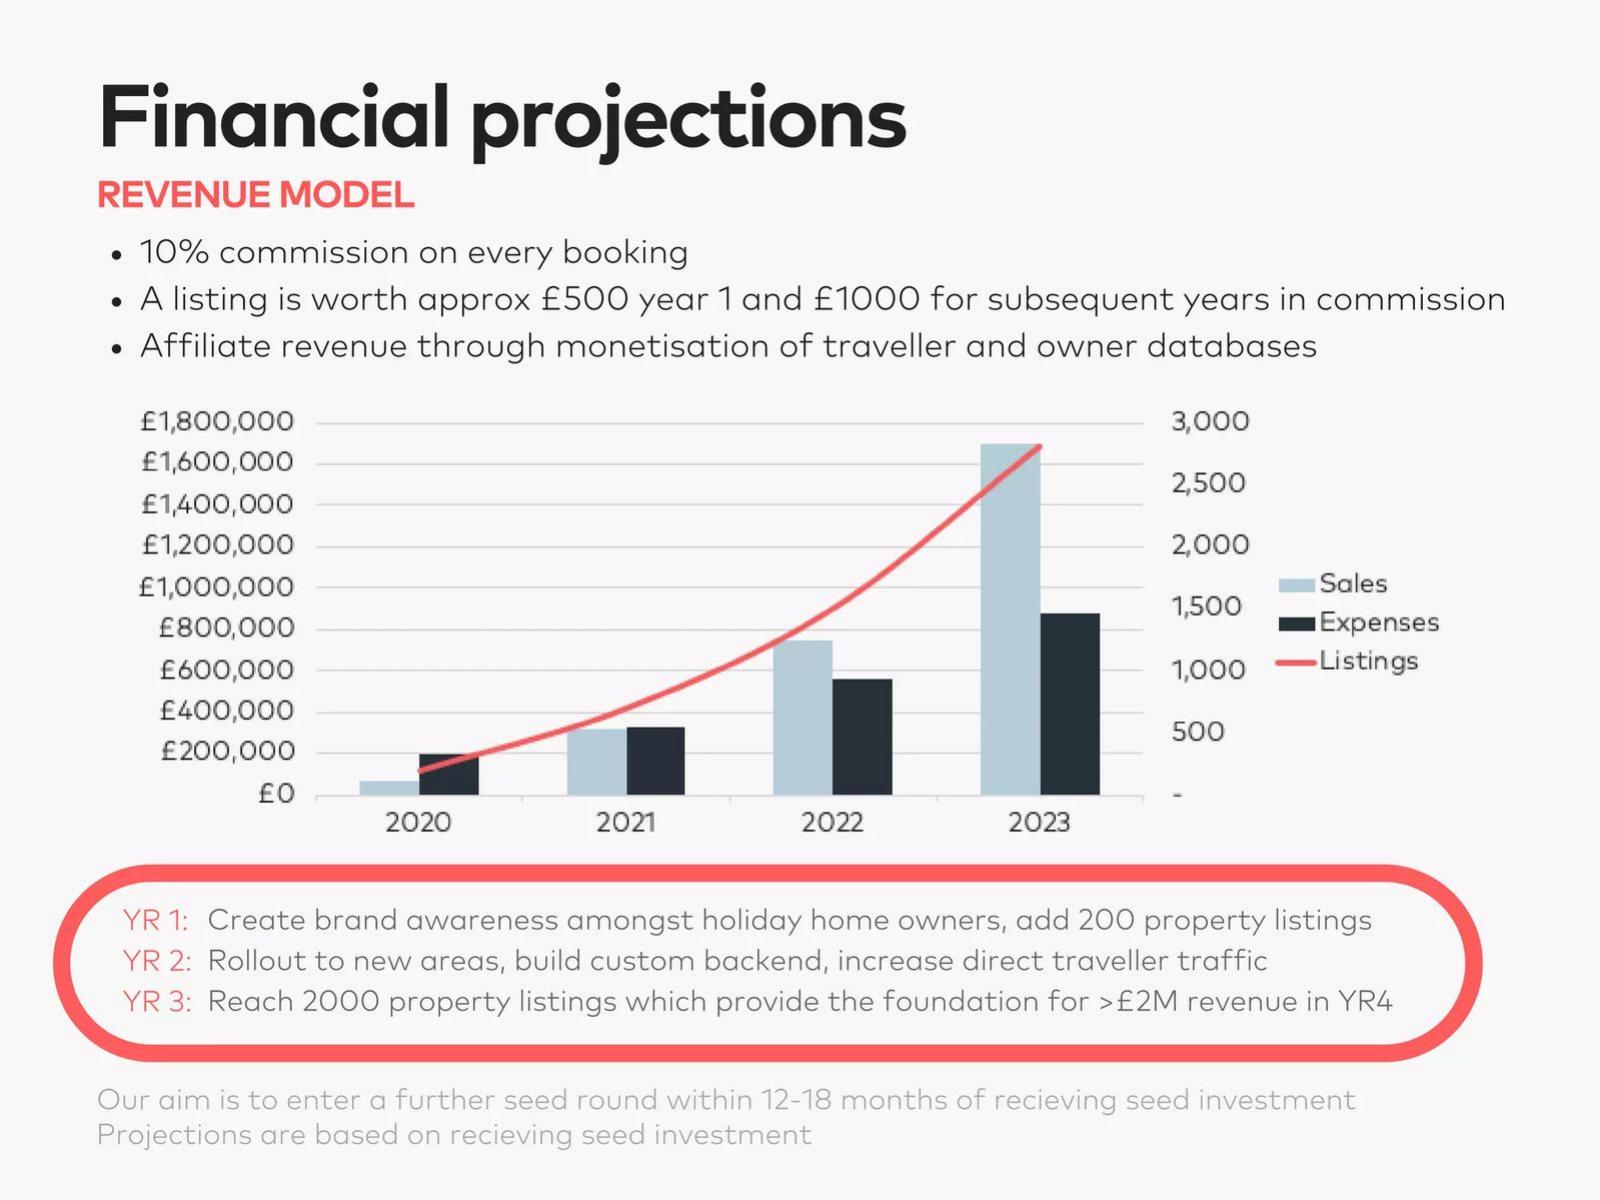
Holiday Online deck, slide 13. Exact stored slide matched to this analysis.
Our analysis: Commission is tied to a countable unit, so the listing target and the revenue goal can be checked against each other (2,000 × £1,000 is about £2M).
Evidence and limitation: A vague extra stream like "monetisation of databases" with no rate weakens an otherwise checkable slide.
What a founder can adapt: Express affiliate revenue per unit you report: per listing, per active user or per booking.
Supporting analysis
What the deck claims: "10% commission on every booking"; "A listing is worth approx £500 year 1 and £1000 for subsequent years in commission"; goal of 2,000 property listings by year three as "the foundation for more than £2M revenue in YR4".
Presentation choice: Commission is tied to a countable unit, so the listing target and the revenue goal can be checked against each other (2,000 × £1,000 is about £2M).
When it does not fit: A vague extra stream like "monetisation of databases" with no rate weakens an otherwise checkable slide.
Furniture search engine. Pre-seed deck, February 2014.
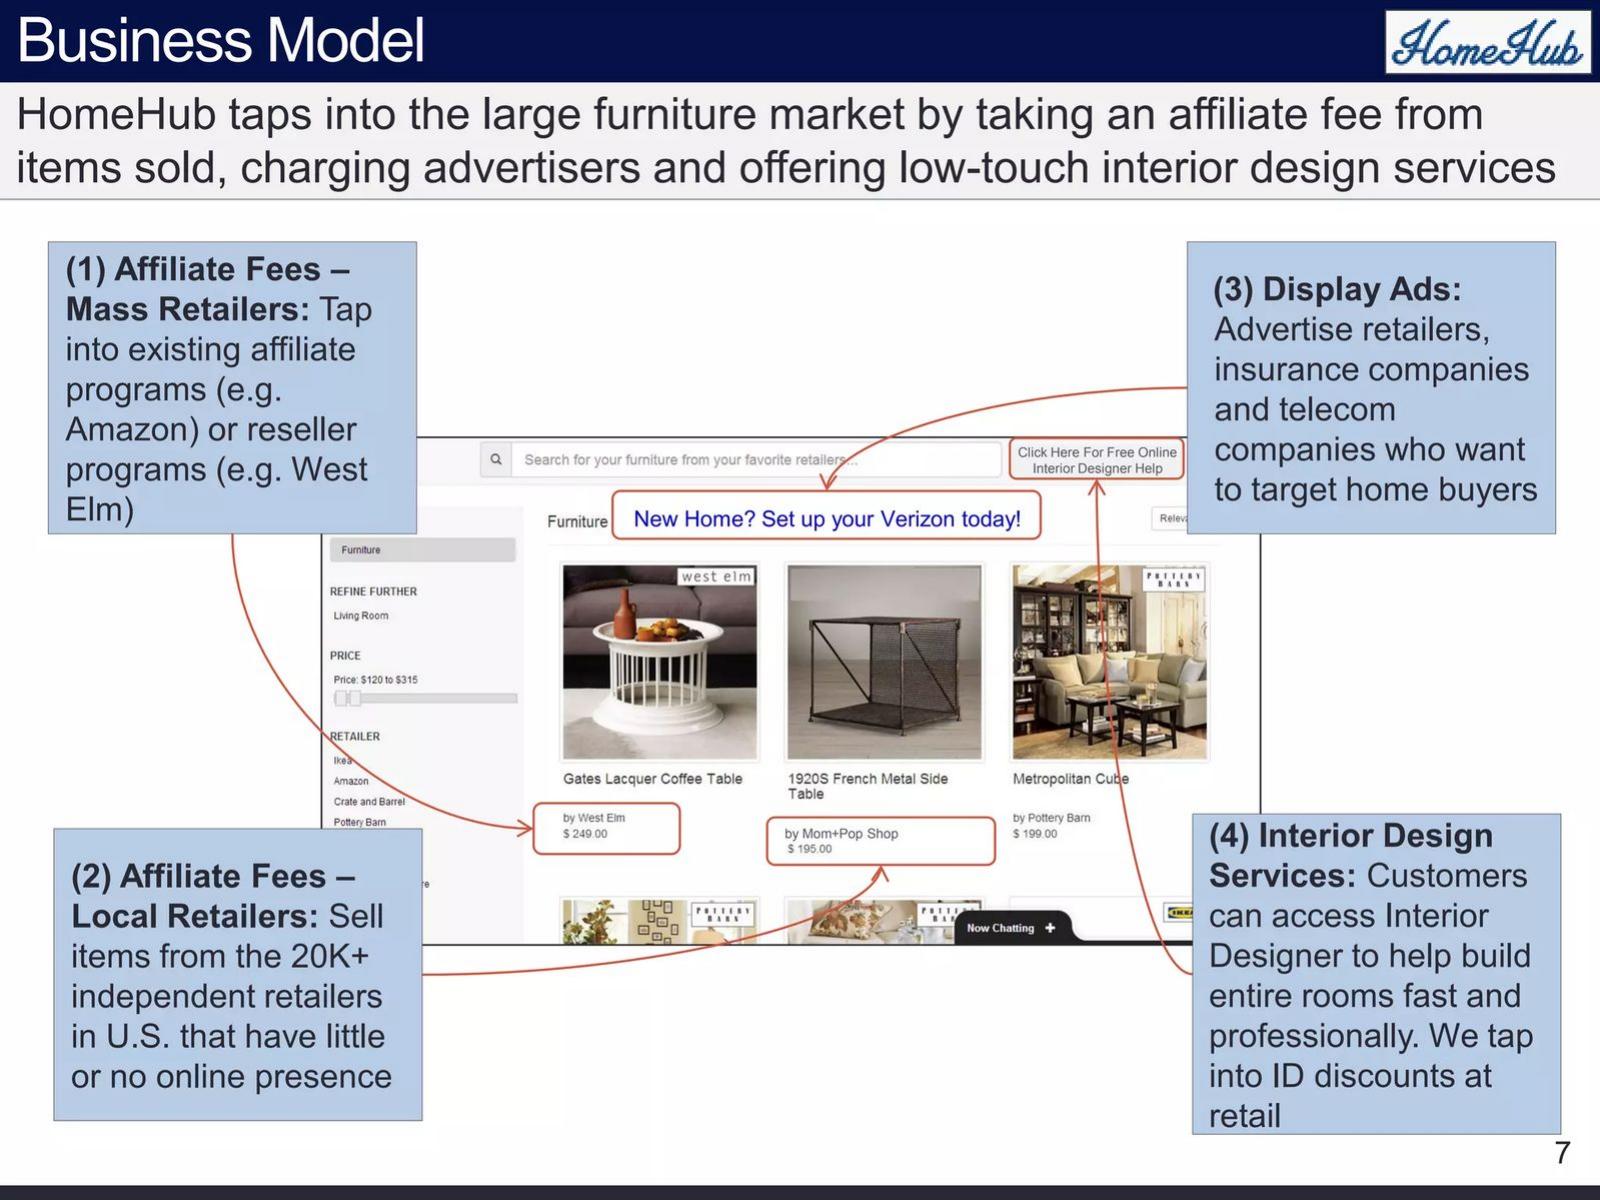
HomeHub deck, slide 7. Exact stored slide matched to this analysis.
Our analysis: Names where each affiliate fee comes from and shows it on the actual product.
Evidence and limitation: Listing local retailers as affiliate partners without evidence they will pay a fee.
What a founder can adapt: Point each revenue stream at the place in your product where it is earned.
Supporting analysis
What the deck claims: Four streams around a product screenshot: affiliate fees from mass retailers "(e.g. Amazon) or reseller programs (e.g. West Elm)", affiliate fees from "the 20K+ independent retailers in U.S.", display ads and interior design services.
Presentation choice: Names where each affiliate fee comes from and shows it on the actual product.
When it does not fit: Listing local retailers as affiliate partners without evidence they will pay a fee.
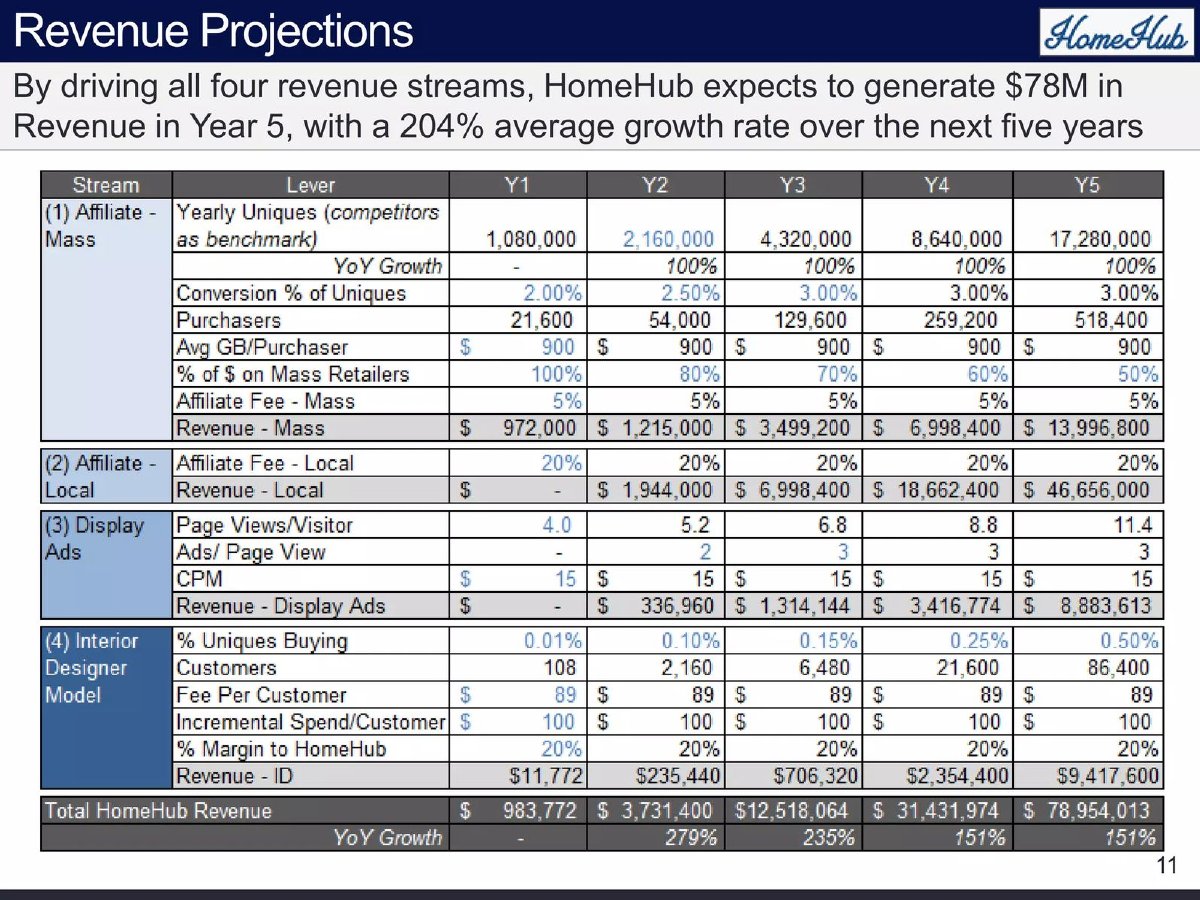
HomeHub deck, slide 11. Exact stored slide matched to this analysis.
Our analysis: An example to learn from: the build-up is complete, but the mass-retailer line is wrong in years two, three and five against its own inputs (for example, year two should be $1,944,000, not $1,215,000).
Evidence and limitation: Don't let one wrong cell flow through to the headline total.
What a founder can adapt: Recompute every row from its inputs before sending a forecast table.
Supporting analysis
What the deck claims: Visitors double yearly to 17,280,000; 2–3% buy at $900 each; mass retailers pay 5% and local retailers 20%; total revenue $78,954,013 in year five.
Presentation choice: An example to learn from: the build-up is complete, but the mass-retailer line is wrong in years two, three and five against its own inputs (for example, year two should be $1,944,000, not $1,215,000).
When it does not fit: Don't let one wrong cell flow through to the headline total.
Platform for artists, musicians and fashion designers.
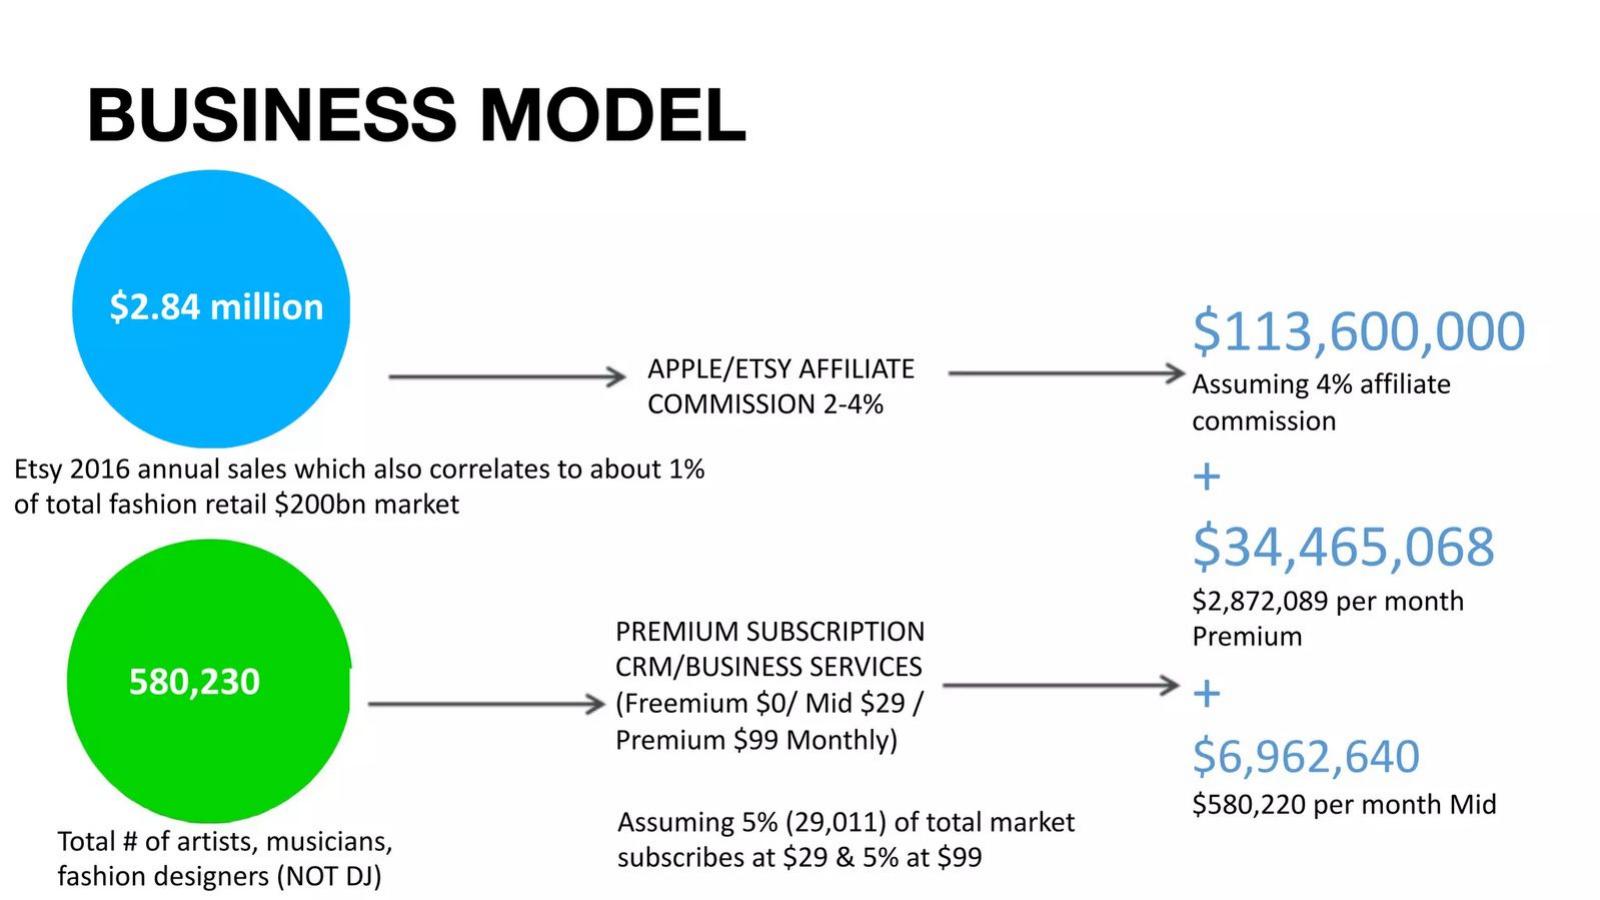
Zonez deck, slide 13. Exact stored slide matched to this analysis.
Our analysis: An example to learn from: the commission line needs $2.84 billion, not million, and the $29 tier is calculated at $20 a month.
Evidence and limitation: Assuming you earn commission on a whole merchant's sales.
What a founder can adapt: Write the full unit on every figure and recompute each product.
Supporting analysis
What the deck claims: "$2.84 million" Etsy 2016 sales × "Apple/Etsy affiliate commission 2-4%" = "$113,600,000, assuming 4% affiliate commission", plus premium subscriptions at $29 and $99 a month.
Presentation choice: An example to learn from: the commission line needs $2.84 billion, not million, and the $29 tier is calculated at $20 a month.
When it does not fit: Assuming you earn commission on a whole merchant's sales.
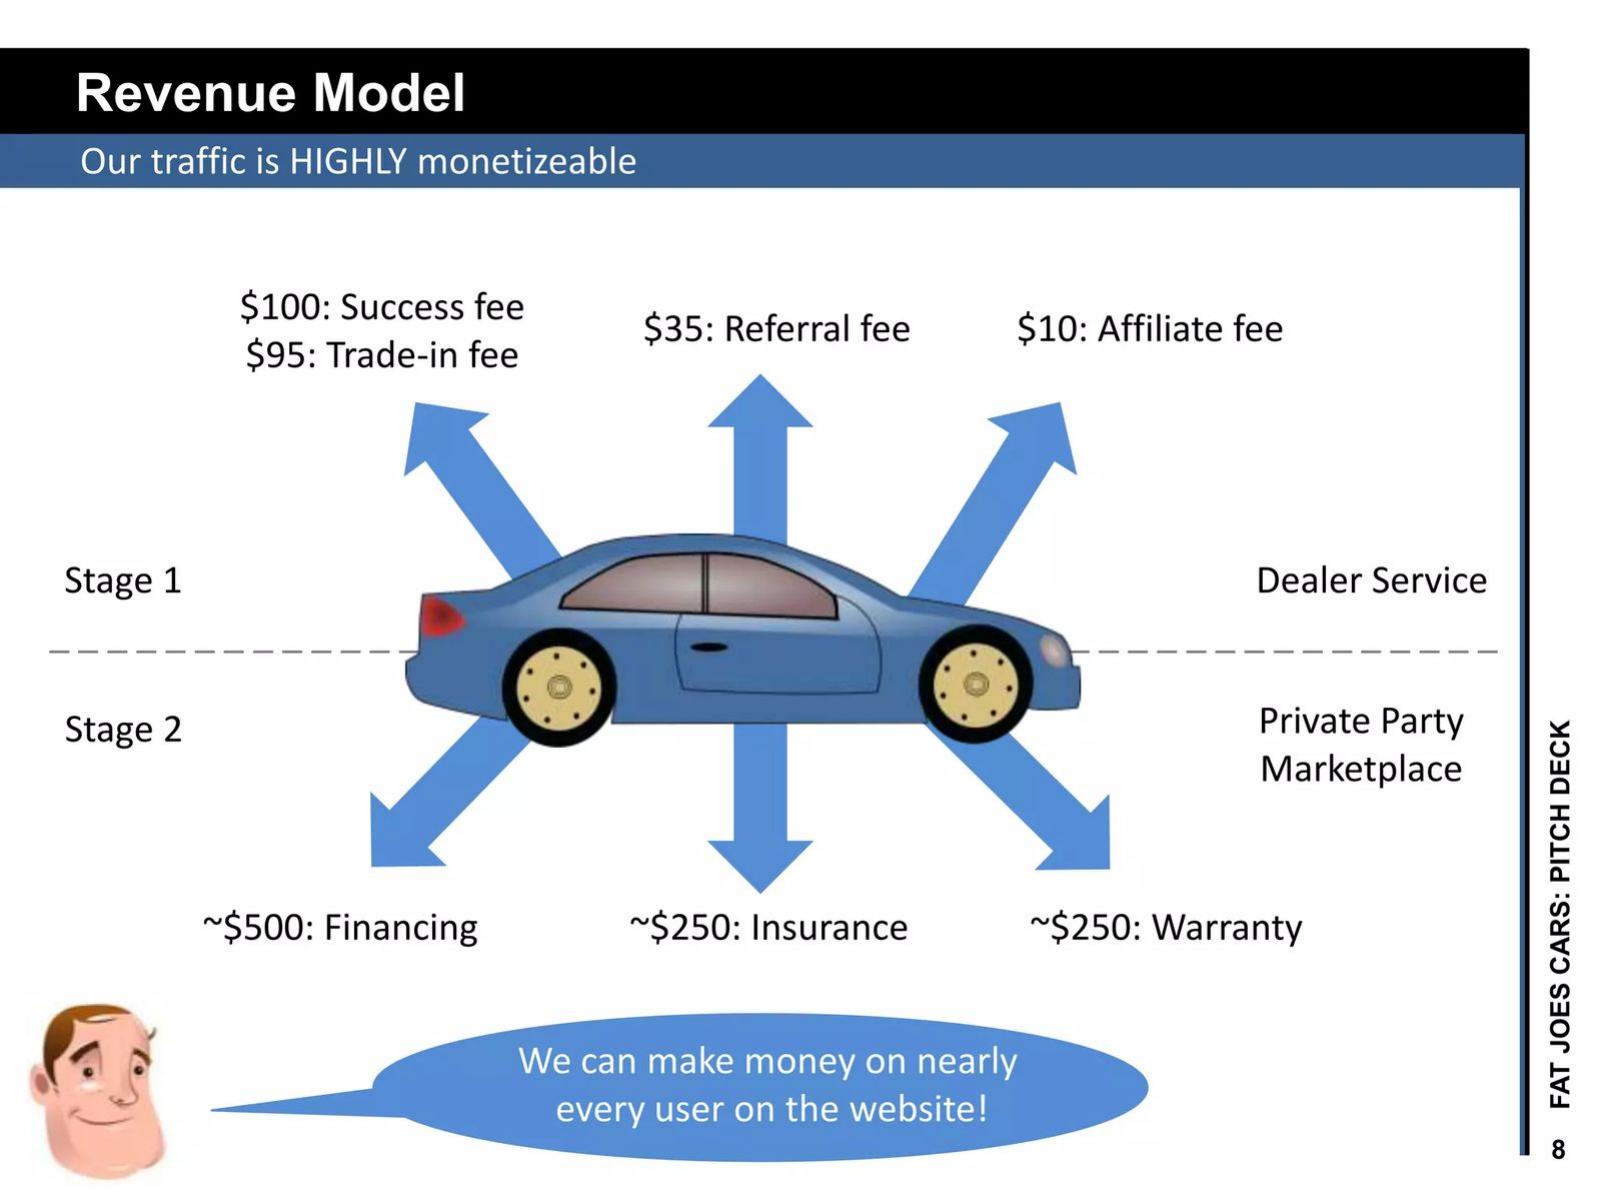
Fat Joe's Cars deck, slide 8. Exact stored slide matched to this analysis.
Our analysis: Clear amounts for each fee, including affiliate, but no take-up rates, so revenue per user can't be estimated.
Evidence and limitation: Implying every user pays every fee.
What a founder can adapt: Add the share of users expected to trigger each fee.
Supporting analysis
What the deck claims: $100 success fee, $95 trade-in fee, $35 referral fee, $10 affiliate fee; about $500 financing, $250 insurance and $250 warranty. "We can make money on nearly every user on the website!"
Presentation choice: Clear amounts for each fee, including affiliate, but no take-up rates, so revenue per user can't be estimated.
When it does not fit: Implying every user pays every fee.
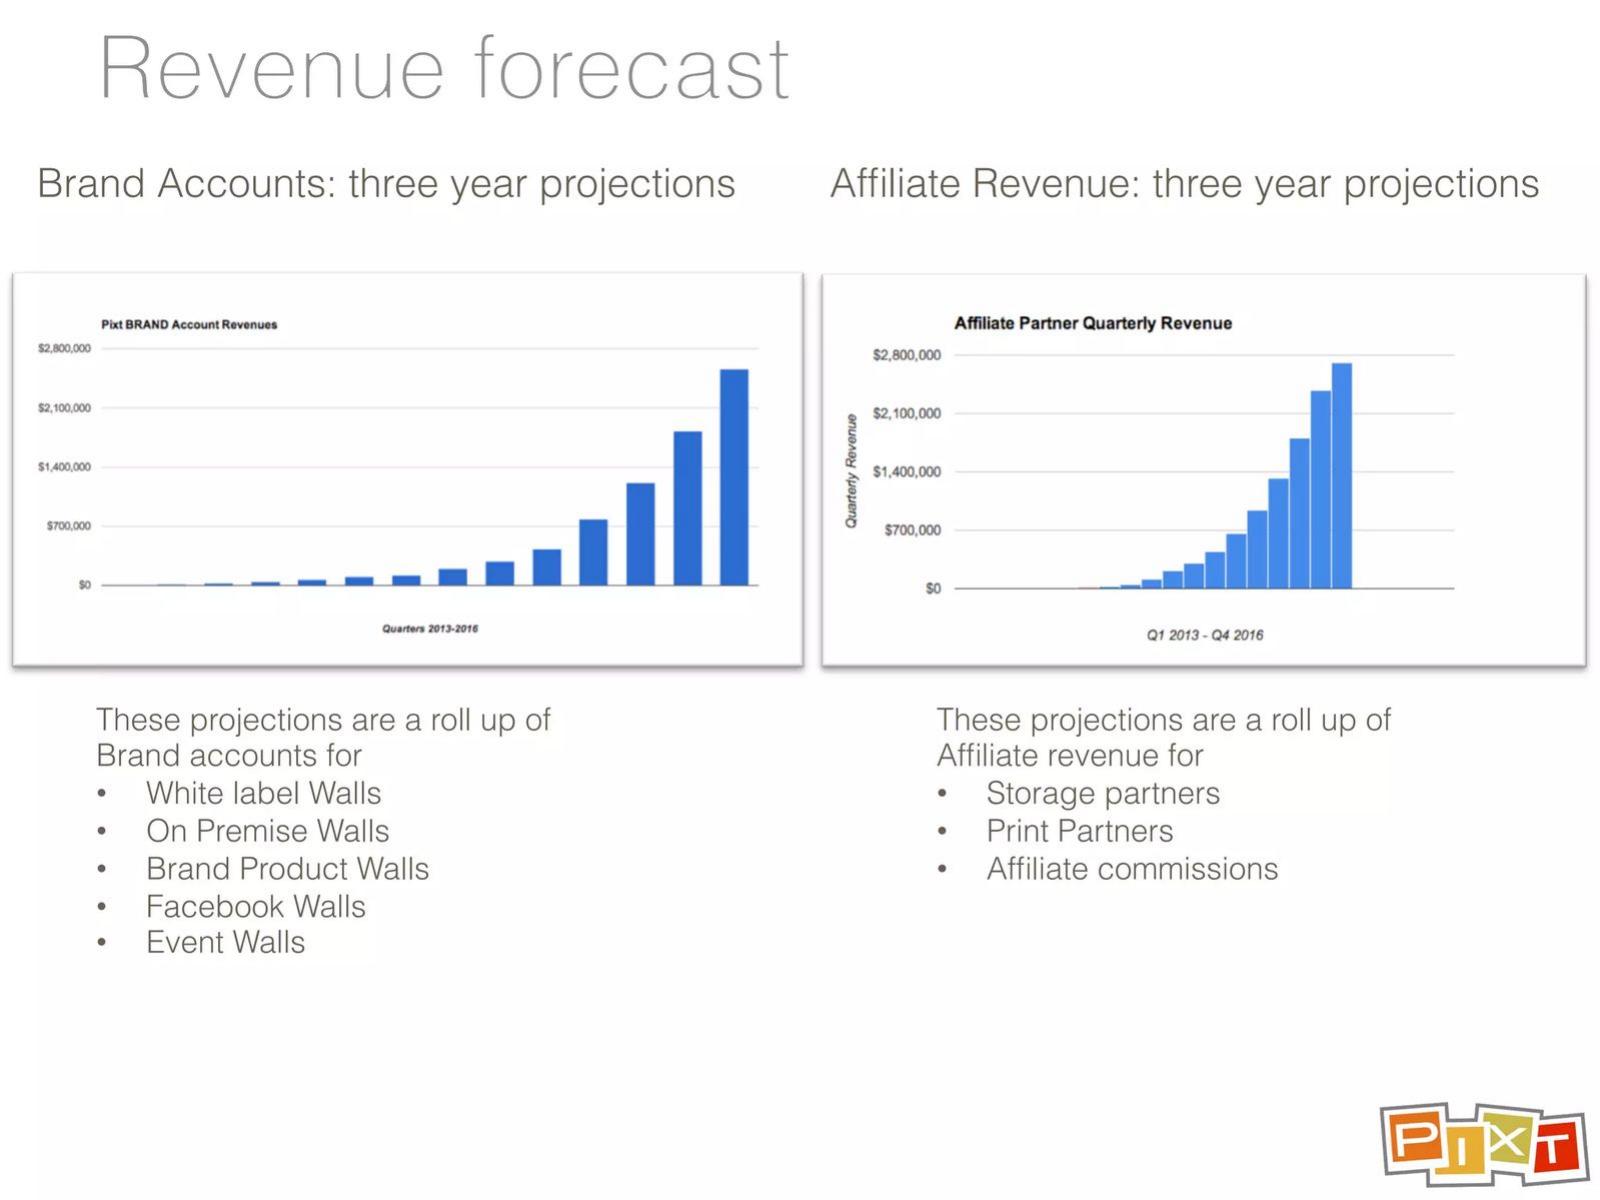
Pixt deck, slide 10. Exact stored slide matched to this analysis.
Our analysis: A weak example to learn from: a forecast chart with no rate, user count or split between sources.
Evidence and limitation: A chart alone gives investors nothing to test.
What a founder can adapt: Print the inputs beside any affiliate forecast chart.
Supporting analysis
What the deck claims: Affiliate partner quarterly revenue chart, Q1 2013 to Q4 2016, rising to about $2.7M a quarter; "a roll up of affiliate revenue for storage partners, print partners, affiliate commissions".
Presentation choice: A weak example to learn from: a forecast chart with no rate, user count or split between sources.
When it does not fit: A chart alone gives investors nothing to test.
The strongest slides build revenue from one user or one unit, and their figures check out.
Example
Commission rate
Per-user or per-unit value
Share passed on
Arithmetic checks
The ShoppingPro
2.5%
Yes ($21 gross, $7 kept)
Yes (67%)
Yes
Holiday Online
10%
Yes (£500–£1,000 per listing)
Not applicable
Yes
HomeHub (model)
Not on this slide
No
Not applicable
Not applicable
HomeHub (forecast)
5% and 20%
Yes ($900 per purchaser)
Not applicable
No (three years wrong)
Zonez
2–4%
No
Not applicable
No (unit error, $29 tier at $20)
Fat Joe's Cars
$10 fixed fee
Fee only, no take-up
Not applicable
Not applicable
Wndrlust
7–20%
No
Not applicable
Not applicable
Pixt
Not stated
No
Not applicable
Not applicable
Key Takeaways
Show one user's affiliate revenue: order value × purchases a year × commission rate.
Subtract anything you pass on (cashback, revenue share) and show what you keep.
Name the merchants or programmes the commission comes from and the rate each pays.
Check that forecast totals match their inputs; investors will multiply them out.
Watch units: a commission on millions cannot produce a hundred million.
Test your affiliate slide before you send it
Answer these with numbers, even if they are targets.
Merchants. Which merchants or programmes pay you, and what rate does each pay?
Order value. What is the average order, and where does that figure come from?
Frequency. How many purchases does an active user make a year?
Kept. What share do you pass back as cashback or rewards, and what do you keep?
Check. Have you recomputed every forecast row from its inputs, with full units?
Copyable framework: [Average order] × [orders a year] × [commission rate] = [gross per user]; minus [share passed on] = [kept per user]; × [active users] = [affiliate revenue]
Illustrative example 1 — written by us
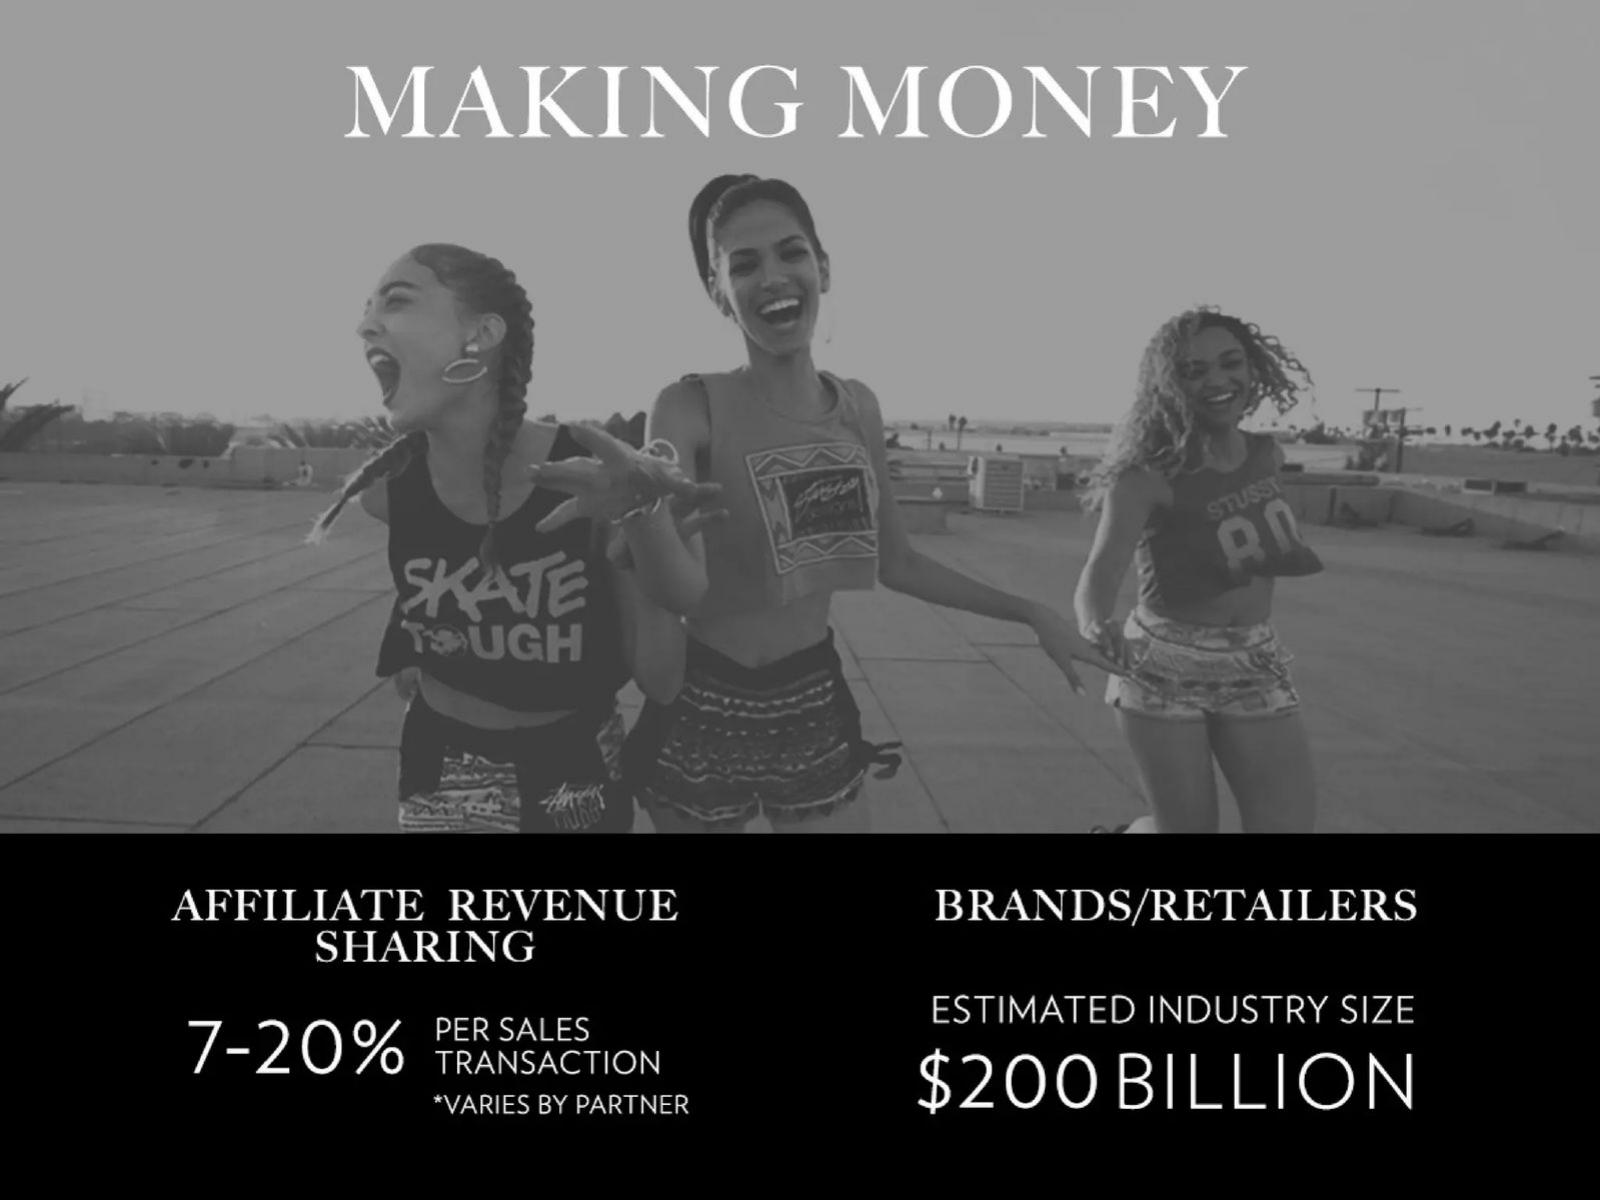
Before: Affiliate revenue sharing: 7-20% per sales transaction, varies by partner.
After: Affiliate revenue: [partner] pays [rate], [partner] pays [rate]; [average order] × [orders a year] × [blended rate] = [revenue per user] a year
What improved: Our illustrative rewrite, not Wndrlust's text. Bracketed parts are placeholders, not company facts. It turns a range into a figure an investor can test.
What this guide covers
Affiliate revenue is the commission a startup earns when a user it sends to another seller buys something. Price comparison sites, deal and cashback apps, content sites, travel booking platforms and marketplaces that link out to retailers all earn this way. The startup doesn't hold stock or take payment; the merchant does, and pays a percentage or a fixed fee per sale.
That makes affiliate income look easy to forecast: users times purchases times commission. It is also why investors check it closely. Commission rates are set by the merchant and can be cut at any time, order values vary by category, and only a small share of visitors ever buy. A good slide shows the chain of assumptions so each one can be questioned. A weak one gives a percentage and a large total.
Our business model guides cover marketplaces, subscriptions, advertising, hardware, licensing, franchising and white label. The media business model guide mentions affiliate links in passing, but none explains how to present affiliate revenue itself. We found a little over twenty startup slides in our corpus that discuss affiliate commissions with some detail. Eight slides from seven decks were readable, came from companies that were private when they made the deck, and differ enough to teach something.
Start with one user
The clearest way to present affiliate income is to work out what one user earns you in a year. It needs four numbers: the average order value, how many orders a user makes a year, the commission rate, and the share of the commission you keep.
The ShoppingPro, a shopping app built around cashback, puts all of these on a slide titled "Unit economics". It opens: "The financial model is based on affiliate commission." Then it lists an average transaction size of USD 70 (sourced to Comscore), 12 transactions per user per year, affiliate commissions of 2.5%, revenue per user per year of USD 21, revenue passed on (MLM/cashback) of 67%, and margin per user per year of USD 7.
We checked it: $70 × 12 × 2.5% is $21.00, and keeping 33% of that leaves $6.93, which the slide rounds to $7. Every step is visible, so an investor can change any one number and see the effect. The slide even warns against its own assumption: "It is very likely that our initial product mix will be much higher value but lower transactions per year." What it doesn't do is say where the 2.5% comes from. Commission rates differ widely between merchants and product categories, and a blended rate needs at least a short explanation.
The other number that matters is the 67% passed on. Cashback and referral schemes are how many affiliate businesses attract users, but they turn a $21 user into a $7 one. Showing both figures, as The ShoppingPro does, is honest. Many decks show only the gross commission.
Tie the commission to something you can count
Affiliate revenue is easier to believe when it is linked to a unit the startup controls and can report: listings, active users, bookings. Then the forecast becomes a question of how many of those units you will have.
Holiday Online, a holiday rental booking site, does this on its financial projections slide. The revenue model has three lines: "10% commission on every booking", "A listing is worth approx £500 year 1 and £1000 for subsequent years in commission" and "Affiliate revenue through monetisation of traveller and owner databases". Below a chart of sales, expenses and listings from 2020 to 2023, it sets yearly goals: 200 property listings in year one, and 2,000 listings by year three, "which provide the foundation for more than £2M revenue in YR4".
Those numbers agree with each other: 2,000 established listings at about £1,000 of commission each is about £2M. The value per listing also implies something the slide doesn't say. At a 10% commission, £1,000 a year means about £10,000 of bookings per listing, which an investor might compare with typical holiday rental income in its area. The weaker part is the third bullet. "Monetisation of traveller and owner databases" has no rate, partner or amount, and it is not clear whether it is in the chart.
Check that the forecast matches its own inputs
A detailed forecast table invites investors to multiply it out. If the totals don't follow from the inputs, the error costs more credibility than a simpler slide would have.
HomeHub, a furniture search engine, explains its model on one slide and forecasts it on another. Its business model slide names two affiliate streams: fees from mass retailers through existing programmes "(e.g. Amazon) or reseller programs (e.g. West Elm)", and fees from "the 20K+ independent retailers in U.S. that have little or no online presence". Display ads and interior design services make up the rest.
The forecast slide turns this into a five-year table. Yearly unique visitors double from 1,080,000 to 17,280,000; between 2% and 3% buy; each spends $900; a falling share of spending goes to mass retailers (100% in year one down to 50% in year five) at a 5% fee, and the rest to local retailers at 20%. Total revenue reaches $78,954,013 in year five.
We recomputed the mass-retailer line. Year one ($972,000) and year four ($6,998,400) are correct. Year two should be 54,000 × $900 × 80% × 5% = $1,944,000, but the slide shows $1,215,000. Year three should be $4,082,400 but shows $3,499,200, and year five should be $11,664,000 but shows $13,996,800. The year three and year five figures are what a 60% mass share would give, so the table appears to use the wrong cell in two years. The local-retailer line and the totals follow from what is printed, so the headline total carries these errors.
Two other assumptions deserve a sentence each on a slide like this. The visitor numbers are labelled "competitors as benchmark" with no named competitor, and the 20% local fee is four times the mass rate with nothing to show independent shops have agreed to it. That local line is $46.7M of the $79M in year five.
Watch the units
Affiliate forecasts often start from a merchant's or a market's total sales. A missing "billion" or an extra one is easy to make and easy for an investor to spot.
Zonez, a platform for artists, musicians and fashion designers, combines affiliate commission with subscriptions on its business model slide. The top line starts from a circle labelled "$2.84 million", described as "Etsy 2016 annual sales which also correlates to about 1% of total fashion retail $200bn market", applies an "Apple/Etsy affiliate commission 2-4%" and arrives at "$113,600,000, assuming 4% affiliate commission".
Four per cent of $2.84 million is $113,600, not $113.6 million. The result only works if the starting figure is $2.84 billion, and the slide's own note says the same thing: 1% of a $200bn market is $2bn, not $2m. The label is wrong by a factor of a thousand. Even with the unit fixed, the line assumes Zonez earns commission on all of Etsy's sales, which no single affiliate does.
The subscription line has its own slip. It assumes 5% of 580,230 creators (29,011) pay $29 a month and another 5% pay $99. The $99 tier checks out: 29,011 × $99 is $2,872,089 a month, or $34,465,068 a year. But the $29 tier is shown as $580,220 a month, which is 29,011 × $20, not $29. At $29 it would be $841,319 a month. A deck can survive one of these errors if a founder corrects it in the meeting; two on one slide make an investor doubt the rest of the model.
When affiliate is one fee among many
Many startups earn affiliate income alongside other fees. That is fine, but the slide should still say how often each fee is earned, not only how much.
Fat Joe's Cars, a used car website, puts six arrows around a car on its revenue model slide, under the headline "Our traffic is HIGHLY monetizeable". Stage one (dealer service) earns a $100 success fee, a $95 trade-in fee, a $35 referral fee and a $10 affiliate fee. Stage two (private party marketplace) earns about $500 from financing, $250 from insurance and $250 from warranty. A cartoon says: "We can make money on nearly every user on the website!"
The amounts are clear. What is missing is how many users trigger each one. A $10 affiliate fee earned on most visits is very different from a $500 financing fee earned on one sale in a hundred. Adding a take-up rate under each arrow would turn the picture into a revenue estimate per user.
Weak examples to learn from
Wndrlust, a fashion discovery app, gives its "Making money" slide mostly to a photo. The text reads "Affiliate revenue sharing: 7-20% per sales transaction, varies by partner" and "Brands/retailers: estimated industry size $200 billion". A range from 7% to 20% nearly triples revenue between its ends, and the industry size has no source and no link to what Wndrlust could earn. Naming two or three partner brands with their actual rates would make this slide useful.
Pixt, a photo wall app, shows two charts of quarterly revenue from 2013 to 2016. The affiliate chart rises to about $2.7M a quarter by the end of 2016 and is described only as "a roll up of affiliate revenue for storage partners, print partners, affiliate commissions". There is no rate, no user count and no split between the three sources, so there is nothing to test. The deck dates from May 2013, when Pixt was raising a seed round; a chart reaching millions per quarter needs the inputs printed beside it.
Common mistakes
Rate with no base. Say what order value the commission applies to.
Gross only. Show what you keep after cashback or revenue share.
Wrong cells. Recompute every forecast row from its inputs.
Unit slips. Write million or billion on every figure and check the product.
Fees without take-up. Say how many users trigger each fee.
Diagnostic checklist
Merchants or programmes named, with rates.
Average order value and purchase frequency stated.
Revenue per user, gross and kept.
Forecast rows recomputed from their inputs.
Units checked on every figure.
Frequently asked questions
How we chose these examples
Corpus: published pitch deck teardowns on StartupFundraising.com. Founder-uploaded private decks are excluded.
Selection (2026-10-01): we searched extracted slide text for affiliate commissions or fees mentioned with rates, revenue or forecasts, then read each candidate from images made from the original deck files.
Eligibility: each company was private when its deck was made. HomeHub's February 2014 deck seeks a $150K pre-seed round; Pixt's May 2013 deck comes from a seed-stage company (about $612K raised in total per Tracxn); The ShoppingPro, Zonez, Holiday Online, Fat Joe's Cars and Wndrlust are early-stage startups whose decks seek early funding and show no sign of a listing.
Not used: a Roshi slide (its affiliate mention had no rate or revenue) and other slides that mention affiliate links only as a marketing channel.
Overlap check: no other guide covers affiliate revenue. The media business model guide mentions affiliate links only in passing; the marketplace, advertising, subscription, white-label and franchise guides cover other models.
Review: all eight slide images were inspected on 2026-10-01 and matched to company, deck and slide number, and the arithmetic on The ShoppingPro, Holiday Online, HomeHub and Zonez slides was recomputed (AI editorial model review). No person has yet completed an editorial review of this page.
Figures are the companies' own claims; we checked arithmetic, not underlying data. We make no claim that any slide caused a fundraising outcome.