AI Running Costs on a Pitch Deck: Show Cost per Use
When every use of your product pays a model provider or another platform, investors ask what each use costs.
AI Running Costs: How to Show Cost per Use and Margin on Your Pitch Deck
Five slides from four startups whose product pays someone else every time a customer uses it: Supernormal charts its cost per recorded meeting hour against GPT-4, OpenBuilder bets its pricing on falling model costs, Connectly resells WhatsApp and SMS messages at a stated margin, and Nanonets shows a gross margin it has blanked out. We check what each one lets an investor work out.
TL;DR
If your product calls an AI model, a messaging network or another paid service each time a customer uses it, that cost grows with usage. Investors will want three numbers: what one unit of use costs you (per meeting hour, per message, per page, per task), how that cost has moved and why, and what you charge for the same unit, so the margin can be read. A fourth helps: what happens to margin if your heaviest users use far more than average.
Supernormal comes closest on the first two: its chart shows its own models' cost per recorded hour falling below $1 while GPT-4 stays above $6 (read from the chart). But it never shows the price, so the margin can't be read. Connectly states the margin on the pass-through cost ("~5-20%") but not the cost itself. OpenBuilder's plan depends on costs falling, without a cost figure. Nanonets claims a gross margin and hides the number.
Running-cost and margin slides from real pitch decks
Each example records what the slide shows about cost per use, its trend, the price and the margin. "Read from the chart" and "our calculation" mark our readings and arithmetic; everything else is quoted from the slide.
Supernormal business model slide — slide 14
AI meeting-notes app. 2023 seed deck; model cost chart.
Supernormal deck, slide 14. Exact stored slide matched to this analysis.
Our analysis: The clearest cost-per-use trend in the set.
Evidence and limitation: Our calculation: V3 about a tenth of GPT-4 per hour at the last quarter. Quarters have no years; benchmark undefined; no price shown.
What a founder can adapt: Add years, define the benchmark and put the price per hour beside it.
Supporting analysis
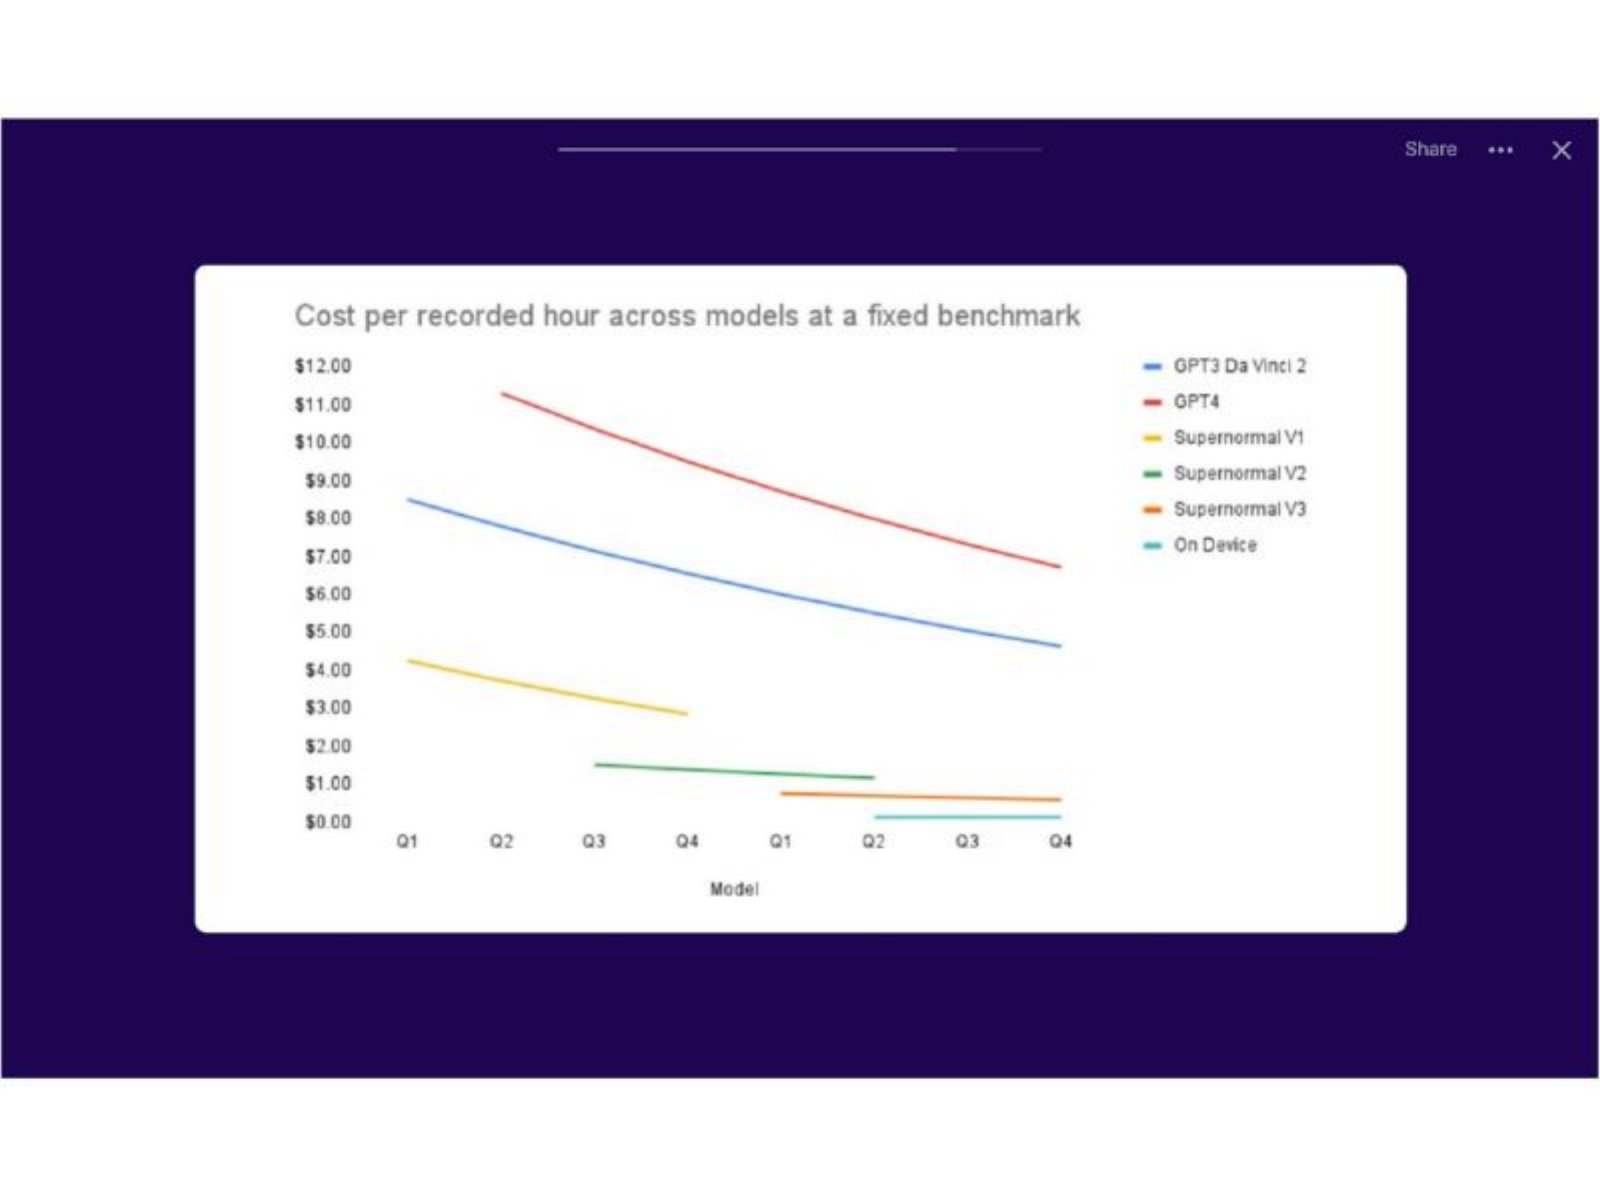
What the deck claims: "Cost per recorded hour across models at a fixed benchmark": GPT-4 about $11.30 to $6.70, GPT-3 Da Vinci 2 about $8.50 to $4.60, Supernormal V1 to V3 from about $4.20 down to $0.60, "On Device" near $0.10 (read from the chart).
Presentation choice: A unit and a trend the reader can follow.
When it does not fit: Don't show cost without price.
AI app builder for non-technical users. 2025 seed deck; problem page.
OpenBuilder deck, slide 3. Exact stored slide matched to this analysis.
Our analysis: A pricing thesis built on falling costs.
Evidence and limitation: States a cost trend as the reason the market will change; gives no cost figure or source.
What a founder can adapt: Show today's cost per user and the trend you assume, with a source.
Supporting analysis
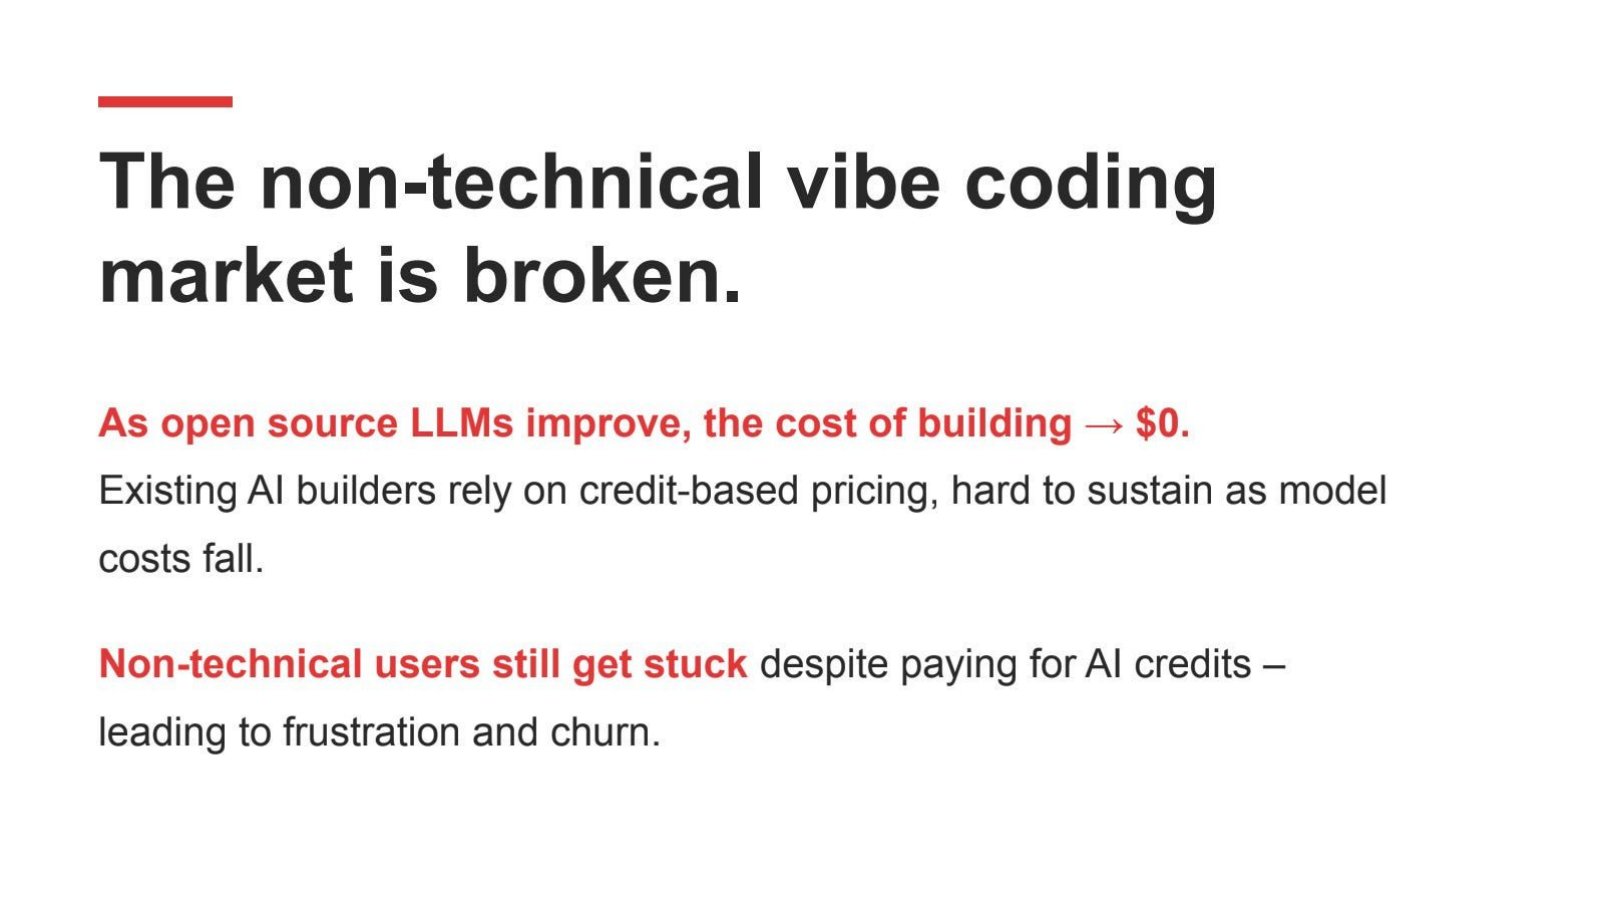
What the deck claims: "As open source LLMs improve, the cost of building → $0." "Existing AI builders rely on credit-based pricing, hard to sustain as model costs fall."
Presentation choice: Investors will test the trend the plan depends on.
When it does not fit: Don't treat "→ $0" as a number.
OpenBuilder deck, slide 4. Exact stored slide matched to this analysis.
Our analysis: Flat fee for unlimited use, the case where cost data matters most.
Evidence and limitation: Fee not stated; "500x lower" has no baseline; heavy-user cost not addressed.
What a founder can adapt: Give the fee and cost per user at average and heavy use.
Supporting analysis
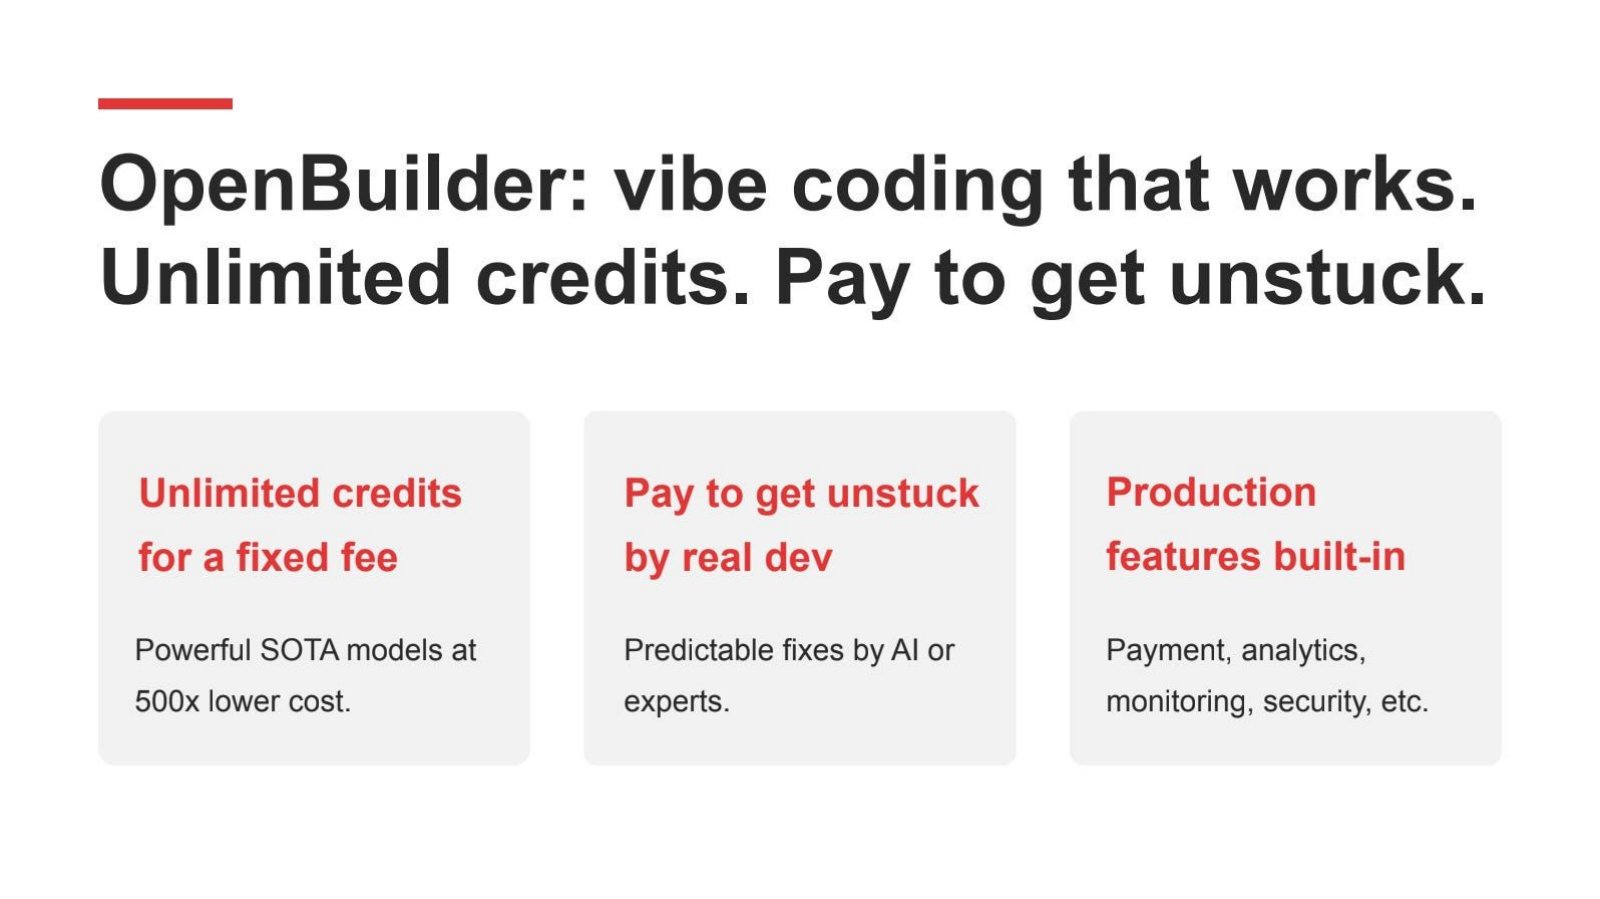
What the deck claims: "Unlimited credits for a fixed fee", "Powerful SOTA models at 500x lower cost"; "Pay to get unstuck by real dev", "Predictable fixes by AI or experts".
Presentation choice: Unlimited plans are where heavy users erode margin.
When it does not fit: Don't quote a cost ratio without its baseline.
Messaging commerce platform. 2022 Series A deck; business model page.
Connectly deck, slide 14. Exact stored slide matched to this analysis.
Our analysis: Honest about a low-margin revenue line.
Evidence and limitation: Margin on resold messages stated; message cost and share of revenue not given; markup vs share of price unclear.
What a founder can adapt: Give the licence/message split of a typical contract.
Supporting analysis
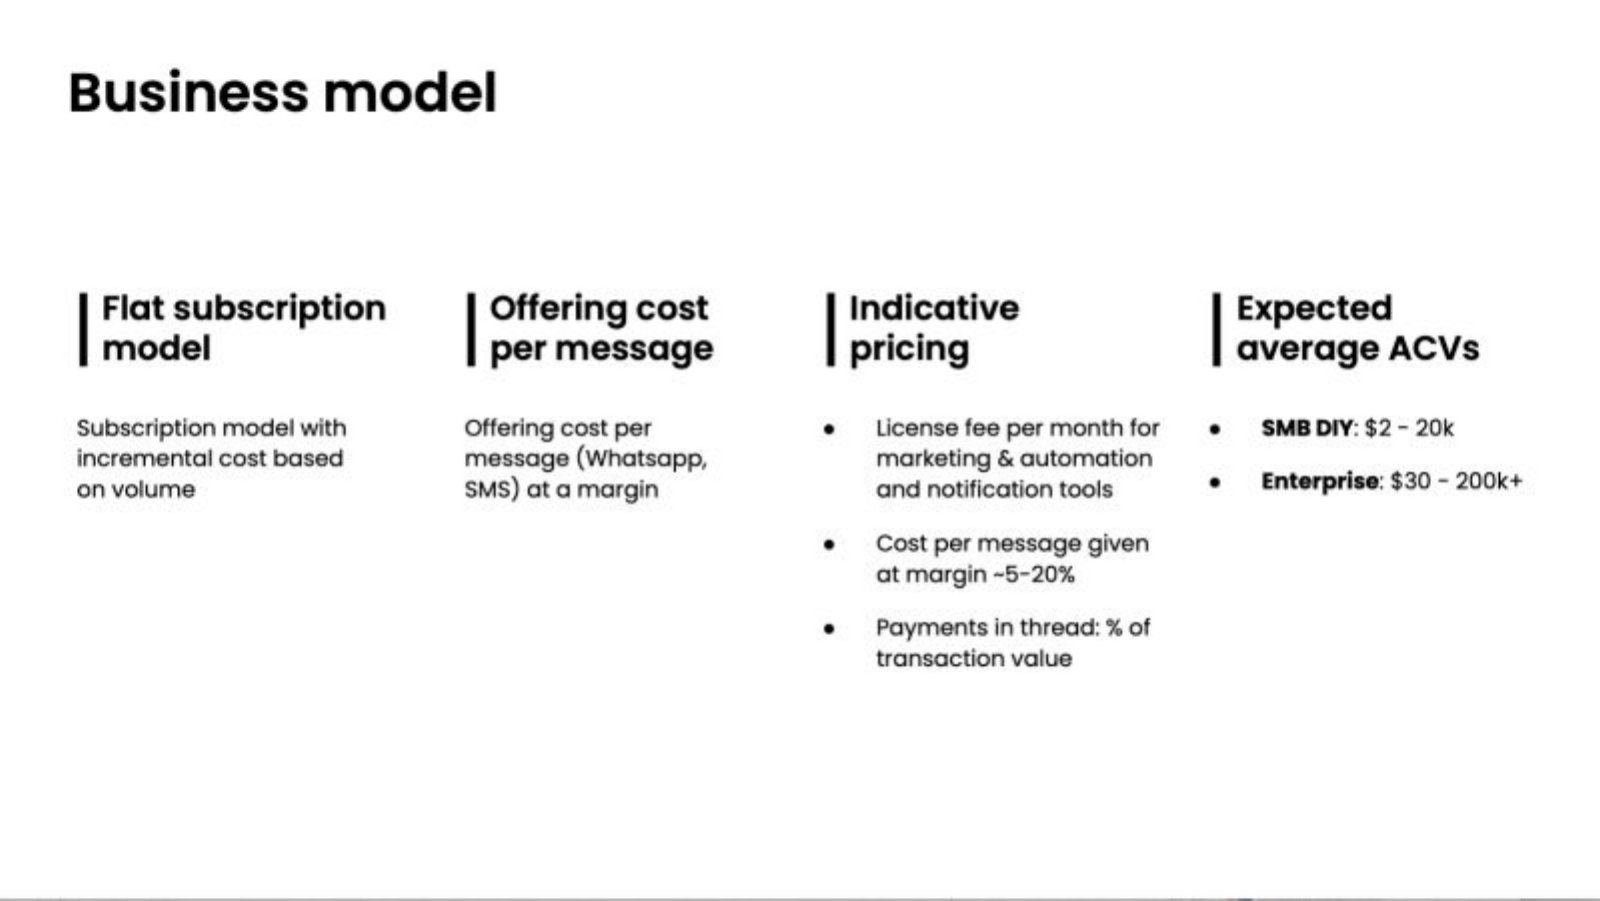
What the deck claims: "Offering cost per message (Whatsapp, SMS) at a margin"; "Cost per message given at margin ~5-20%"; licence fee per month; "Payments in thread: % of transaction value"; ACVs "SMB DIY: $2 - 20k", "Enterprise: $30 - 200k+".
Presentation choice: Investors value pass-through revenue differently.
When it does not fit: Don't leave "margin" undefined as markup or share.
Columns report what each slide states; checks are our readings and calculations.
Example
Cost per unit
Cost trend
Price per unit
Margin
Supernormal p14
Yes (per recorded hour)
Yes (years missing)
No
No
OpenBuilder p3
No
Claimed, no figures
No
No
OpenBuilder p4
No (500x, no baseline)
No
Fixed fee, amount not given
No
Connectly p14
No
No
Licence fee, amount not given
~5-20% on messages
Nanonets p14
No
No
No
Blanked (XX)
Key Takeaways
Pick a unit of use your customer recognises and give your cost for it. Supernormal uses cost per recorded hour.
Show how the cost moved and what moved it. Supernormal's own models replace GPT-4 and fall below $1 an hour (read from the chart).
Put the price per unit beside the cost, or the margin can't be read. None of the five slides does both.
If you resell another platform's service, say the cost and your margin. Connectly gives only the margin, ~5-20%.
Don't build pricing on a cost trend you don't show. OpenBuilder's flat fee depends on falling model costs, with no figures.
If you claim a gross margin, give the number or leave the claim out. Nanonets shows ">XX% Gross Margin".
Show your running costs
Fill in each line for one unit of use. If a figure is confidential, keep the label and describe the trend.
Unit. The unit of use your customer recognises.
Cost. Your cost per unit today, with the date.
Trend. How the cost moved and what drove it.
Price. What the customer pays per unit or per month.
Margin. Gross margin per unit, at average and heavy use.
Pass-through. Third-party costs resold, your markup and their share of revenue.
Copyable framework: One [unit] costs us [cost] ([date]), down from [earlier cost] because [driver]. Customers pay [price]; gross margin [x]% on average use, [y]% for the heaviest 10% of users.
Illustrative example 1 — written by us
Before: Our proprietary models are 10x cheaper than GPT-4.
After: One recorded hour costs us $0.60 (Q4 2023), down from $4.20 with our first model, versus about $6.70 on GPT-4. Teams pay $10 per seat per month and record about 8 hours each: about 52% gross margin on model cost, 30% for the heaviest tenth.
What improved: Our illustrative rewrite; the price, hours and margins are invented for the example, and the costs are approximate readings of Supernormal's chart. It adds dates, a price and margin at average and heavy use.
The question this guide answers
Most software costs little to serve one more customer. AI products are different: every summary, answer or generated page sends a request to a model, and someone pays for the computing. The same is true for products that send WhatsApp messages, text messages or payments through another company's network. These costs rise with usage, so a flat price can lose money on heavy users, and a falling cost can turn a thin margin into a healthy one.
Our AI business model guide covers the pricing unit (per result, per conversation, per AI worker, per credit) and asks founders to show or at least address gross margin. It gives one line on running costs and a template. It doesn't explain how to show the cost per use, how to present its trend, or how to combine cost and price so an investor can read the margin. That is this guide's question: if each use of your product costs you money, what should the business model slide show about it?
How we chose and read the examples
We searched the extracted text of the deck library for inference cost, cost per call or query, GPU cost, model cost and margin on per-message or per-use fees. Most matches were listed companies, infrastructure vendors describing their customers' costs, or decks marked confidential, which we excluded; one AI infrastructure deck with a hidden gross margin was excluded on that ground. Five slides from four private startups remained: Supernormal page 14, OpenBuilder pages 3 and 4, Connectly page 14 and Nanonets page 14. We also read OpenBuilder's page 8 for one quoted line; that slide is illustrated in our AI competition guide.
Each slide was rendered from the original deck file and read at full size. All four companies were private when their decks were made: Connectly's and Nanonets' decks are from 2022, Supernormal's from 2023 and OpenBuilder's from 2025, according to our teardown records. Values read from a chart are marked as such. Arithmetic labelled "our calculation" is ours. We did not check any company's costs or margins against its accounts.
Show the cost per unit of use, and its trend
Supernormal, which writes meeting notes automatically, uses page 14 for one chart: "Cost per recorded hour across models at a fixed benchmark". Six lines run across eight quarters (Q1 to Q4, then Q1 to Q4 again). "GPT3 Da Vinci 2" starts near $8.50 and falls to about $4.60. "GPT4" starts in the second quarter near $11.30 and falls to about $6.70. Supernormal's own models step down: "Supernormal V1" from about $4.20 to $2.80, "V2" from about $1.50 to $1.15, "V3" from about $0.75 to $0.60, and an "On Device" line near $0.10 (all values read from the chart).
This is the right kind of slide. It picks a unit the reader understands, a recorded hour of meeting, and shows the company's own cost falling faster than the general-purpose models it competes with or replaces. At the last quarter, V3 costs roughly a tenth of GPT-4 per hour (our calculation from the chart readings). It also shows the cause: each new in-house model version, not just cheaper prices from the model provider.
Three things are missing. The quarters have no years, so the reader can't tell which period the chart covers or whether the later points are forecasts. The "fixed benchmark" isn't defined, so it's unclear whether a recorded hour means the same workload on every line. And there is no price: the deck's traction pages target "$4M ARR with 200K+ DAU" but never say what a customer pays per hour or per seat, so the reader can't turn a cost of $0.60 an hour into a margin.
Don't bet your pricing on a cost trend you don't show
OpenBuilder, an AI app builder for non-technical users, makes falling model costs the heart of its plan. Page 3 says "As open source LLMs improve, the cost of building → $0" and that "Existing AI builders rely on credit-based pricing, hard to sustain as model costs fall." Page 4 offers "Unlimited credits for a fixed fee" using "Powerful SOTA models at 500x lower cost", plus "Pay to get unstuck by real dev". Page 8 adds "Inference costs drop 10x every year."
The logic is coherent: if the cost of each request falls fast enough, unlimited use for a flat fee becomes affordable, and revenue can come from the human help that remains costly. But a flat fee with unlimited use is exactly the case where heavy users can wipe out margin, so it's where cost figures matter most. The deck doesn't say what a typical user's monthly usage costs today, what the fixed fee is, what "500x lower" is measured against, or where the "10x every year" trend comes from.
To make this pitch credible, show today's cost per active user per month at average and heavy use, the fee, and the margin at each level. If the plan depends on costs falling, show the cost you've already achieved and the trend behind your forecast, with a source.
If you resell another platform's service, show both the cost and the margin
Connectly, which helps businesses sell over WhatsApp and other messaging apps, puts its revenue lines on page 14, "Business model": a "Flat subscription model" ("Subscription model with incremental cost based on volume"), "Offering cost per message" ("Offering cost per message (Whatsapp, SMS) at a margin"), "Indicative pricing" ("License fee per month for marketing & automation and notification tools", "Cost per message given at margin ~5-20%", "Payments in thread: % of transaction value") and "Expected average ACVs" ("SMB DIY: $2 - 20k", "Enterprise: $30 - 200k+").
This is the pass-through version of the same question. Connectly pays WhatsApp or a text-message carrier for each message and charges its customer a little more. Stating the margin, about 5% to 20%, is unusually honest: it tells the investor that message revenue is low-margin and shouldn't be valued like software revenue. What's missing is the size of each line. If a customer's spending is mostly messages at a 5% to 20% margin, the blended gross margin is low; if it's mostly licence fees, it's high. Giving the typical split of a customer's annual contract between licence and messages would let the reader calculate the blended margin.
It's also unclear whether "~5-20%" is a markup on cost or a share of the price. A 20% markup on a $1.00 message gives a price of $1.20 and a margin of about 17% of the price (our calculation). Say which you mean.
A margin claim needs its number
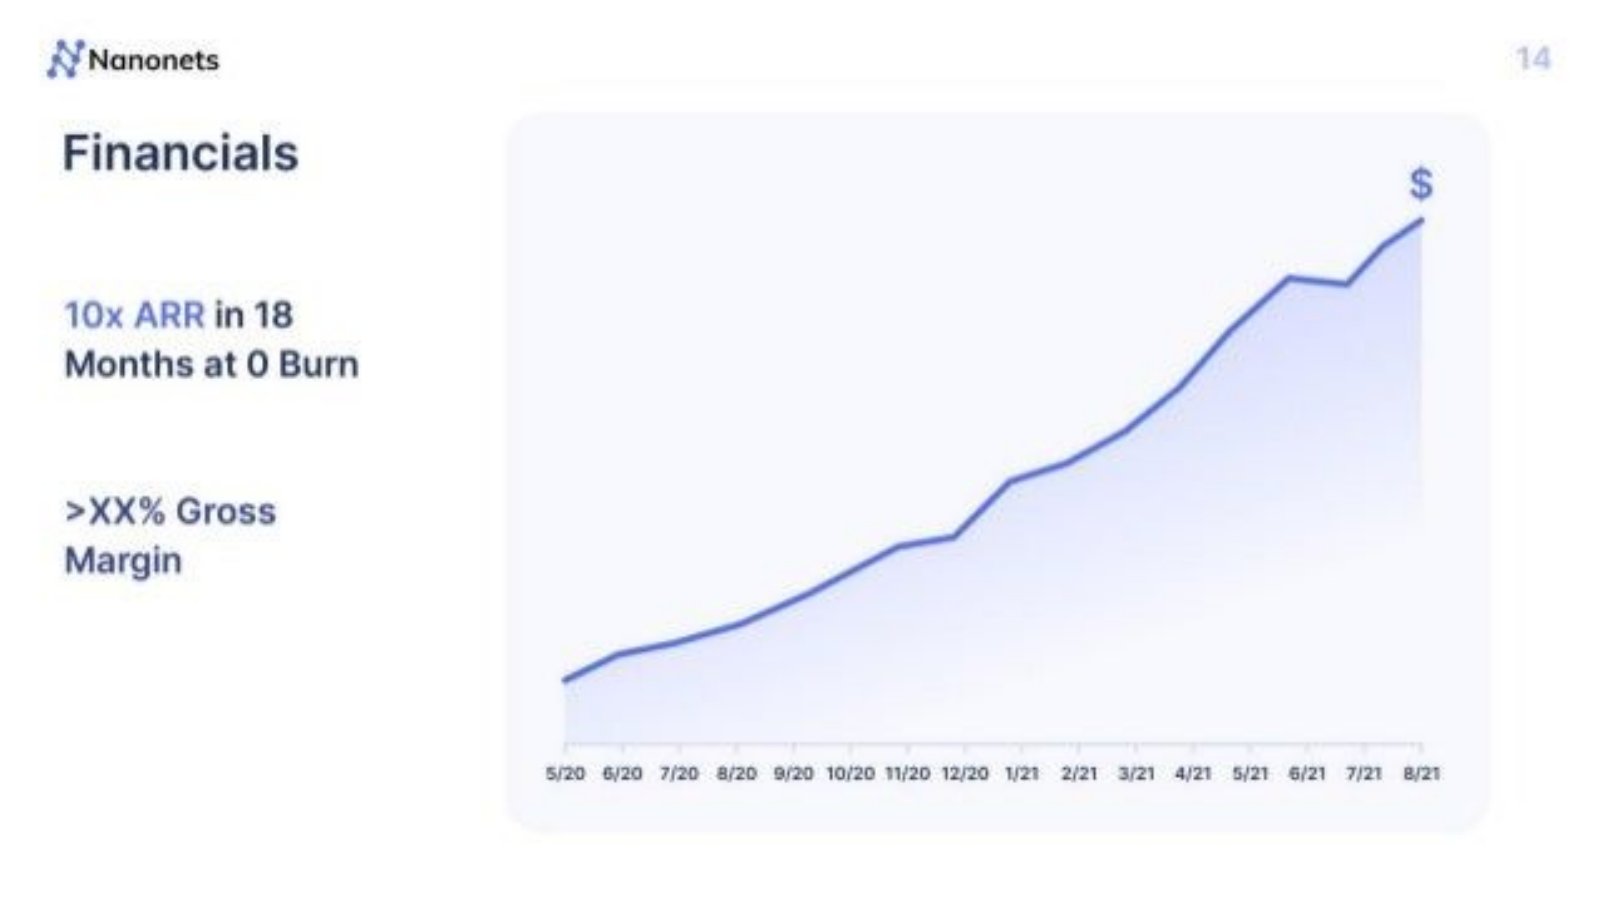
Nanonets, which extracts data from documents with AI, uses page 14, "Financials", for two claims beside a revenue chart: "10x ARR in 18 Months at 0 Burn" and ">XX% Gross Margin". The chart's horizontal axis runs from 5/20 to 8/21; its vertical axis has no scale, only a "$" at the top.
Placeholders like "XX" are common in decks shared publicly after a round, where the company removes sensitive numbers. But for a reader, ">XX% Gross Margin" says only that a margin exists. If you share a version of your deck without the number, replace the claim with something the reader can still use, such as the cost per page processed or whether margin rose or fell over the period. The chart also covers 15 months, from May 2020 to August 2021 (our count), while the claim says 18; a chart should cover the period its headline describes.
What to put on your slide
Choose one unit of use your customer understands (a meeting hour, a message, a page, a task, an active user per month) and give three numbers for it: your cost, your price, and the margin between them. Then show the trend in cost, with dates and what drove it: your own models, cheaper providers, caching, smaller models or work moved onto the user's device. If you resell a third-party service, give its cost and your markup separately from your software revenue, and the typical mix in a customer's spending.
Finally, address the heavy user. If your price is flat and usage isn't capped, show cost per user at the 90th percentile of usage as well as the average, and say what limits or price steps protect your margin. Investors who have seen AI margins squeezed will ask; a slide that answers first is more convincing than one that says costs are falling.
Common mistakes
Cost without price. Put the price per unit beside the cost.
Trend without dates. Label quarters with years and mark forecasts.
Ratio without baseline. Say what "500x lower" compares against.
Ignoring heavy users. Show margin at high usage, not only the average.
Pass-through mixed in. Separate resold costs from software revenue.
Placeholder margin. Replace XX with a number or a usable trend.
Diagnostic checklist
A unit of use is named and its cost given with a date.
The cost trend has dates and a stated cause.
The price for the same unit is shown.
Gross margin is shown at average and heavy use.
Resold third-party costs and their markup are separated.
No placeholders remain in the version you send.
Frequently asked questions
Should an AI startup show its model costs on the pitch deck?
Yes, as cost per unit of use beside the price. Supernormal shows cost per recorded hour by model but no price, so its margin can't be read.
How do I show that my AI costs are falling?
Chart your own cost per unit over dated periods and say what drove each drop. Supernormal's chart shows each in-house model version cheaper than the last, but its quarters have no years.
Is a flat fee with unlimited AI usage a good pricing model?
It can be if costs are low enough, but show margin for heavy users. OpenBuilder offers unlimited credits for a fixed fee and gives no cost or fee figures.
How should I present revenue from reselling messages or API calls?
Separately from software revenue, with your markup. Connectly says ~5-20% on WhatsApp and SMS messages; add the cost and the share of each contract.
What if I don't want to share my gross margin?
Give something usable instead, such as cost per unit or the direction of margin. Nanonets' ">XX% Gross Margin" tells the reader nothing.
How we chose these examples
Selection (2026-10-02): the AI business model guide covers pricing units and asks for margin to be shown or addressed, with one line on running costs; no published guide or queued draft explains how to present cost per use, its trend and the resulting margin.
Five pages from four original deck files were rendered and read at full size: Supernormal 14, OpenBuilder 3 and 4, Connectly 14, Nanonets 14; OpenBuilder page 8 was read for one quoted line. One AI infrastructure deck marked confidential was excluded. Chart values are our readings. This guide was written with an AI editorial model and checked against the slide images by model review.
Eligibility was judged at each deck's date; all four companies were private. Costs, margins and growth are the companies' own claims and were not independently verified.