Delivery and Logistics Business Model Slide Examples: 7
How delivery and logistics startups explain how they make money in a pitch deck: money per shipment, commissions, monthly minimums and per-call pricing.
Logistics Business Model Slide: Show What You Earn on Each Delivery
Delivery and logistics startups live on thin margins. A courier platform might charge a few dollars for a parcel and pay most of it to a driver or carrier, so investors look past the headline price to what the company keeps on each delivery, and how many deliveries it needs to cover its costs. This guide compares seven real business model slides from delivery and logistics startups: three that show the sum per shipment in full, one that prices itself against rivals, and three that describe a model without numbers investors can use.
TL;DR
Show what you earn on each delivery and how many deliveries you expect. Global Xpress gives its buying and selling price for a 2 kg parcel (250 and 300 INR). TopDelivery lists a fee per shipment, per return and a monthly minimum for each customer size. GoApe multiplies riders, orders per hour and days to get 102,960 orders a month, then profit per order to get a yearly total, and the sums check out. Check Eat charges a flat USD $0.50 per purchase against rivals' 14% to 35%. Locus, Postmates and Eziban describe how they charge but give no figure investors can calculate from.
Delivery and logistics business model slides from real pitch decks
Each example shows the exact stored slide above its analysis and links to the full teardown. Slides with figures you can check come first; slides that describe a model without numbers follow. Text is as shown on the slides; comments and arithmetic checks are ours.
GoApe business model slide — slide 24
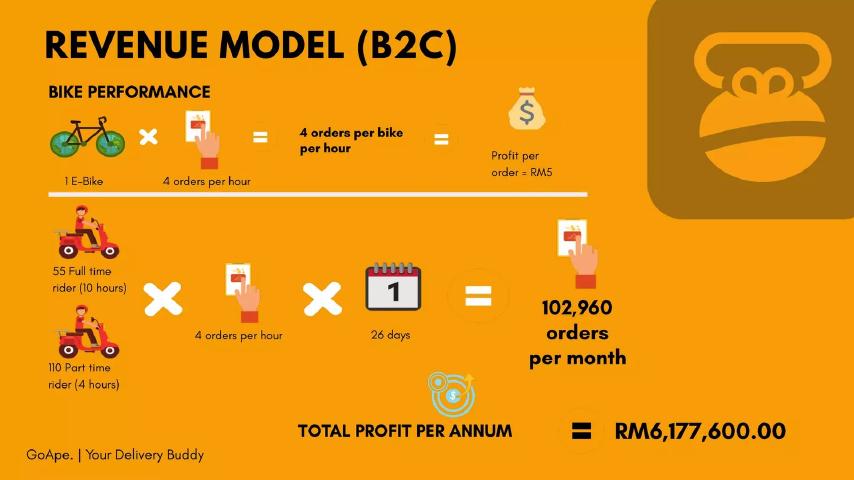
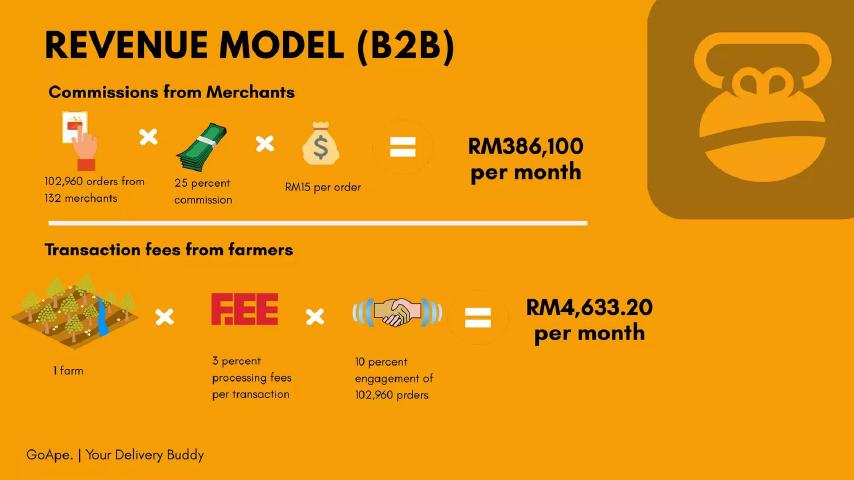
Malaysian delivery company with its own e-bike riders. Two slides: "Revenue Model (B2C)" and "Revenue Model (B2B)".
GoApe deck, slide 24. Exact stored slide matched to this analysis.GoApe deck, slide 25. Exact stored slide matched to this analysis.
Our analysis: The sums check out: 55 riders x 10 hours plus 110 x 4 hours, x 4 orders x 26 days, is 102,960; x RM5 x 12 months is RM6,177,600; x 25% x RM15 is RM386,100.
Evidence and limitation: Company projection.
What a founder can adapt: Lay out riders, hours, orders per hour and earnings per order in one line.
Supporting analysis
What the deck claims: B2C: "1 E-Bike" x "4 orders per hour"; "Profit per order = RM5"; "55 Full time rider (10 hours)" and "110 Part time rider (4 hours)" x "4 orders per hour" x "26 days" = "102,960 orders per month"; "Total profit per annum = RM6,177,600.00". B2B: "102,960 orders from 132 merchants" x "25 percent commission" x "RM15 per order" = "RM386,100 per month"; farmers' "3 percent processing fees per transaction" x "10 percent engagement of 102,960 prders" = "RM4,633.20 per month".
Presentation choice: Every input is visible, so investors can change any assumption and redo the maths.
When it does not fit: Leaving unclear whether the RM5 profit already includes the merchant commission.
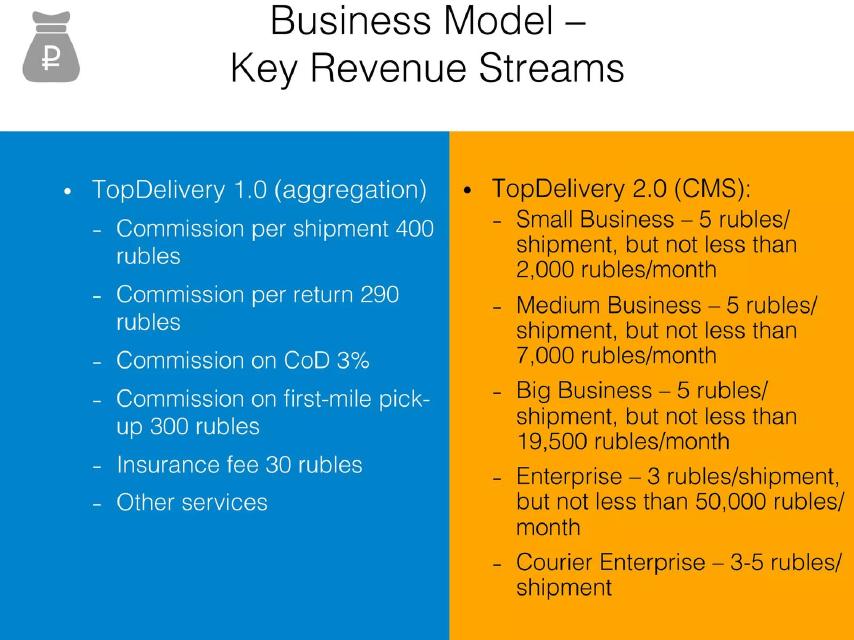
Russian delivery aggregation and software company. Slide titled "Business Model – Key Revenue Streams".
TopDelivery deck, slide 10. Exact stored slide matched to this analysis.
Our analysis: Every fee is priced, and monthly minimums protect revenue from small customers.
Evidence and limitation: Company price list.
What a founder can adapt: Add a monthly minimum if small customers cost more to serve than they pay.
Supporting analysis
What the deck claims: "TopDelivery 1.0 (aggregation)": "Commission per shipment 400 rubles", "Commission per return 290 rubles", "Commission on CoD 3%", "Commission on first-mile pick-up 300 rubles", "Insurance fee 30 rubles". "TopDelivery 2.0 (CMS)": "Small Business – 5 rubles/shipment, but not less than 2,000 rubles/month" up to "Enterprise – 3 rubles/shipment, but not less than 50,000 rubles/month"; "Courier Enterprise – 3-5 rubles/shipment".
Presentation choice: Investors can see both products' prices and how pricing changes with customer size.
When it does not fit: Leaving out how many shipments each product handles today.
Global Xpress Solutions business model slide — slide 14
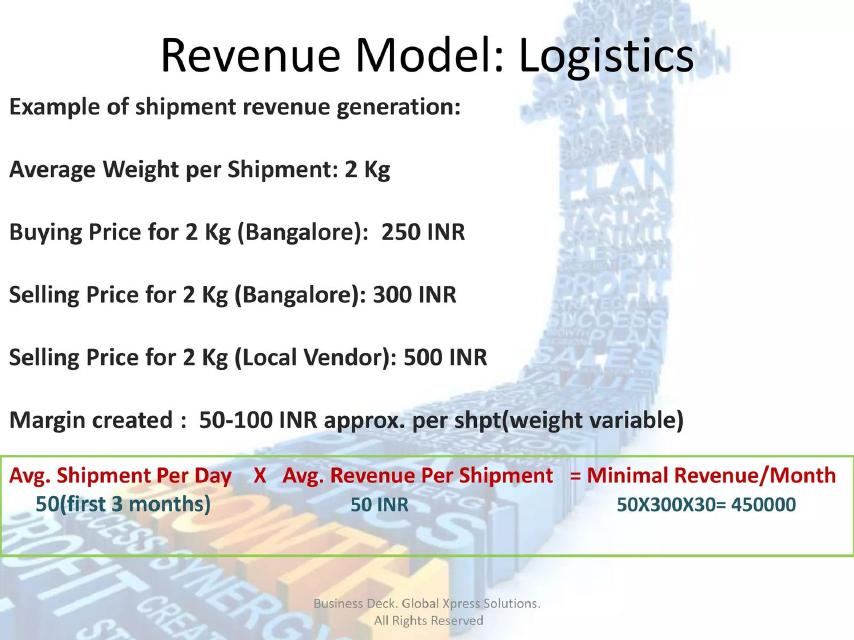
Indian courier aggregator. Slide titled "Revenue Model: Logistics".
Global Xpress Solutions deck, slide 14. Exact stored slide matched to this analysis.
Our analysis: The buy and sell prices are clear, but the final sum multiplies by the 300 INR selling price, not the 50 INR it labels as revenue per shipment. At 50 INR, the monthly figure would be 75,000.
Evidence and limitation: Company example and projection.
What a founder can adapt: Show buy price, sell price and margin, then multiply by the margin if you call it revenue.
Supporting analysis
What the deck claims: "Average Weight per Shipment: 2 Kg"; "Buying Price for 2 Kg (Bangalore): 250 INR"; "Selling Price for 2 Kg (Bangalore): 300 INR"; "Selling Price for 2 Kg (Local Vendor): 500 INR"; "Margin created: 50-100 INR approx. per shpt(weight variable)". "Avg. Shipment Per Day 50 (first 3 months) x Avg. Revenue Per Shipment 50 INR = Minimal Revenue/Month 50X300X30= 450000".
Presentation choice: A strong layout weakened by one wrong number; investors would spot it.
When it does not fit: Labelling one number and multiplying by another.
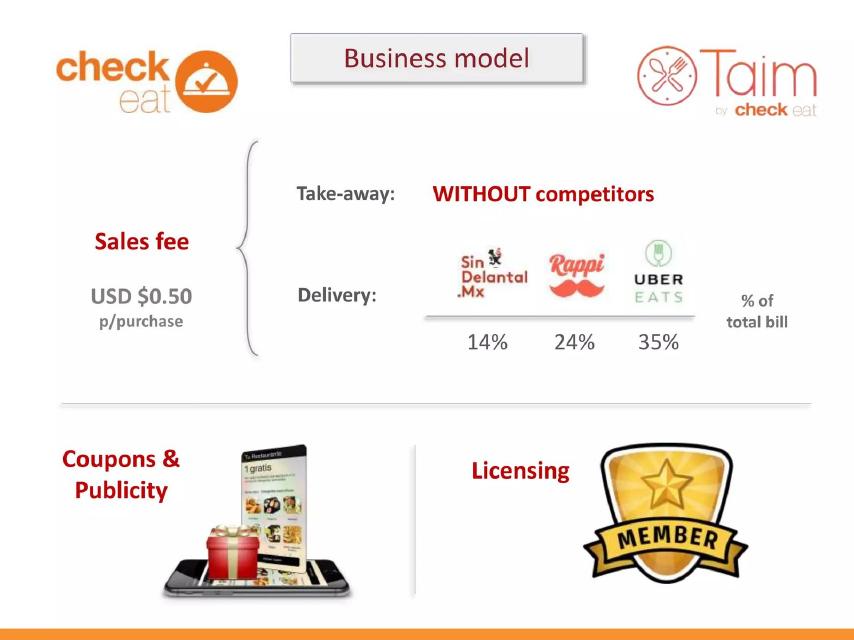
Check Eat deck, slide 12. Exact stored slide matched to this analysis.
Our analysis: A flat fee set against rivals' percentages makes the price advantage clear.
Evidence and limitation: Company price; competitor rates as stated on the slide.
What a founder can adapt: If you charge less than rivals, put their rates beside yours.
Supporting analysis
What the deck claims: "Sales fee USD $0.50 p/purchase". "Take-away: WITHOUT competitors". "Delivery": Sin Delantal.Mx "14%", Rappi "24%", Uber Eats "35%" "% of total bill". Also "Coupons & Publicity" and "Licensing".
Presentation choice: Restaurants see the saving at a glance; investors see the price.
When it does not fit: Not showing how much a $0.50 fee earns at your expected volume, or what coupons and licensing earn.
Indian delivery routing software. Slide titled "Revenue Model".
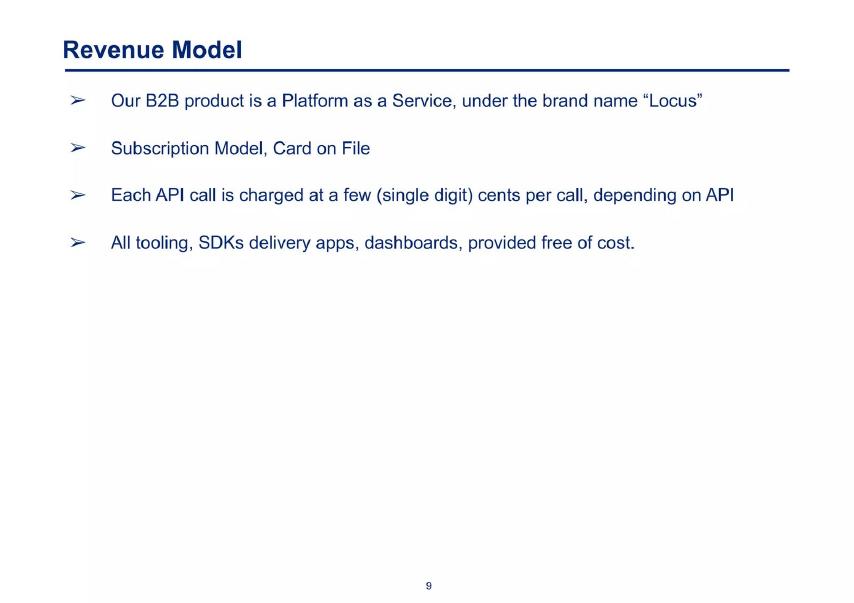
Locus deck, slide 9. Exact stored slide matched to this analysis.
Our analysis: Says how it charges, but "a few cents" and no usage figure leave revenue unknown.
Evidence and limitation: Company description.
What a founder can adapt: Give the price per call and the calls a typical customer makes each month.
Supporting analysis
What the deck claims: "Our B2B product is a Platform as a Service, under the brand name 'Locus'"; "Subscription Model, Card on File"; "Each API call is charged at a few (single digit) cents per call, depending on API"; "All tooling, SDKs delivery apps, dashboards, provided free of cost."
Presentation choice: Shown for contrast. Investors cannot estimate what one customer is worth.
When it does not fit: Ranges like "a few cents" in place of a price.
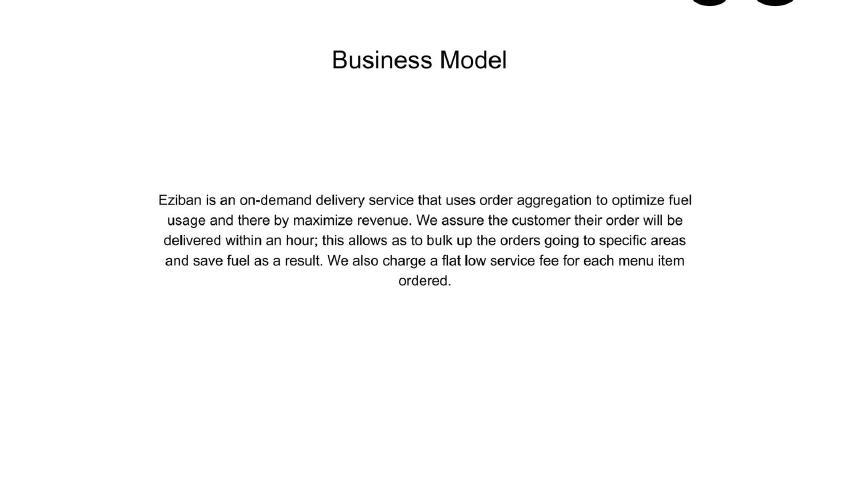
Eziban deck, slide 10. Exact stored slide matched to this analysis.
Our analysis: Explains a cost saving and a fee, but gives no amount for either.
Evidence and limitation: Company description.
What a founder can adapt: Turn the paragraph into the fee amount, fuel saved per batch and orders per batch.
Supporting analysis
What the deck claims: "Eziban is an on-demand delivery service that uses order aggregation to optimize fuel usage and there by maximize revenue. We assure the customer their order will be delivered within an hour; this allows as to bulk up the orders going to specific areas and save fuel as a result. We also charge a flat low service fee for each menu item ordered."
Presentation choice: Shown as a warning. A paragraph with no numbers gives investors nothing to check.
When it does not fit: "Flat low service fee" without the fee.
Whether each slide gives a price, what the company keeps, and the volume behind it.
Example
Price or fee
What it keeps
Volume
GoApe
RM15 per order (B2B)
RM5 profit per order
102,960 orders a month
TopDelivery
400 rubles per shipment; 3–5 rubles in software
Not shown
Monthly minimums only
Global Xpress
300 INR per 2 kg
50–100 INR per shipment
50 shipments a day
Check Eat
USD $0.50 per purchase
Not shown
Not shown
Locus
"A few cents" per call
Not shown
Not shown
Postmates
Not given
Not shown
Not shown
Eziban
Not given
Not shown
Not shown
Key Takeaways
Give what you keep per delivery, not only the price.
Show the volume sum: riders or customers times deliveries.
Check that each multiplication uses the right number.
Separate revenue from margin; they are not the same.
Replace phrases like "a few cents" with a figure.
Build your logistics business model slide
Work out the sum for one delivery before you design the slide.
Price. What does the customer pay per delivery or per month?
Pass-on cost. What do you pay the driver, carrier or fuel supplier for that delivery?
What you keep. What is left per delivery?
Volume. How many deliveries a month, and how did you work it out?
Copyable framework: Customers pay [price] per [delivery]. We pay [cost] to [driver/carrier], keeping [margin]. [Riders/customers] x [deliveries each] = [volume] a month, so [margin x volume] a month.
Illustrative example 1 — written by us
Before: We charge a low delivery fee and scale through order aggregation.
After: Customers pay $4 per delivery. Rider pay and fuel cost $3, so we keep $1. 40 riders x 3 orders an hour x 8 hours x 25 days = 24,000 orders, or $24,000 a month.
What improved: Our illustrative rewrite; all figures are invented for the example. It shows price, cost, margin and the volume sum.
What this guide adds
The general business model guide covers how any startup explains its revenue, and the marketplace guide covers commission models in general. This guide covers delivery and logistics specifically, where the price paid by the customer is mostly passed on to drivers or carriers and the money left per delivery decides whether the business works.
How we read each slide
We read each stored slide image and quote the text on it. Where a slide shows a calculation, we redid the multiplication ourselves and say whether it matches. We have not checked any company's actual revenue, fees or volumes, and we make no claim that any slide affected a fundraising outcome.
The common logistics revenue models
Resale margin: the startup buys delivery from carriers and resells it at a higher price, as Global Xpress does (buy at 250 INR, sell at 300 INR). The key number is the margin per shipment.
Per-shipment fees: the startup charges a fixed fee for each parcel, return or pick-up, as TopDelivery does. Monthly minimums protect revenue from small customers.
Own fleet: the startup runs its own riders and earns on each order, as GoApe does. The key numbers are orders per rider per hour, hours worked and profit per order.
Flat platform fee: the startup charges a small fixed fee instead of a percentage, as Check Eat does. It wins on price but earns little per order.
Software: the startup sells routing or dispatch tools by subscription or per use, as Locus does. The key numbers are price per call or seat and the number of customers.
What investors check on a logistics business model slide
Is the figure revenue or margin? A courier that sells a parcel for 300 and pays 250 earns 50. A sum that multiplies by 300 shows sales, not what the company keeps. Global Xpress's slide falls into exactly this trap.
Do the volumes make sense? Orders per rider per hour, hours per shift and working days are all things investors can compare with what they know. GoApe's four orders per hour is easy to judge; a slide that gives only a monthly total is not.
Are revenue streams counted twice? When the same order earns money from the customer and from the merchant, both can be real, but investors will ask whether the profit figure already includes the commission. GoApe shows its two slides separately without saying how they relate.
What happens at low volume? Monthly minimums, like TopDelivery's, show the company has thought about small customers who cost more to serve than they pay.
Common mistakes on logistics business model slides
Multiplying by the wrong number: Global Xpress labels 50 INR as average revenue per shipment, then multiplies by 300 to reach 450,000 a month.
Vague pricing: Locus says each call costs "a few (single digit) cents", which leaves investors to guess.
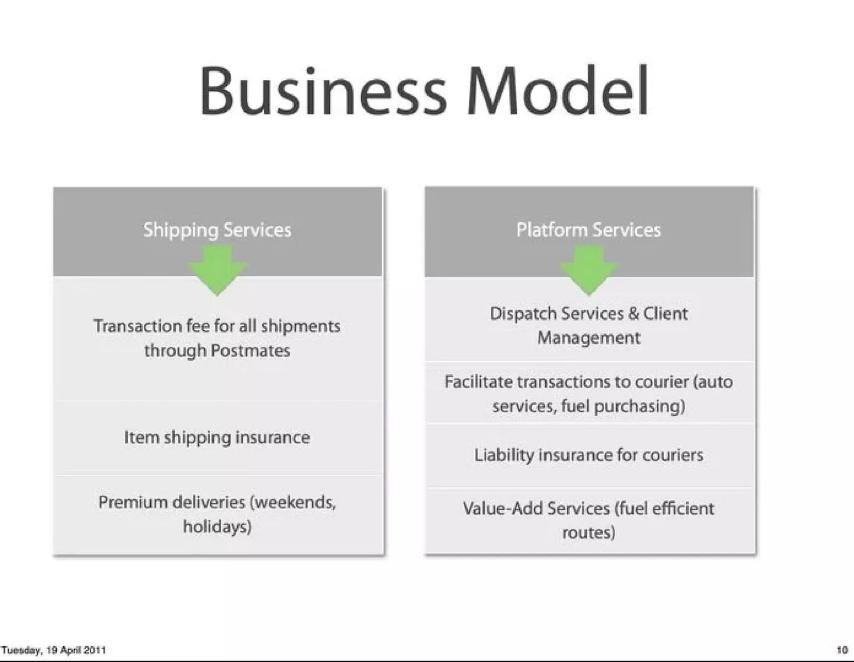
Lists without figures: Postmates names seven services but gives no price for any of them.
Paragraphs instead of numbers: Eziban explains its flat service fee in a sentence but never says how much it is.
Choosing which numbers to show
Start with one delivery. Show the price the customer pays, what you pay the driver or carrier, and what is left. Then show how many deliveries you expect in a month, and multiply. That chain of three or four numbers is what most investors want, and it fits on one slide.
Use volumes you can defend. Orders per hour, routes per day or parcels per customer drawn from your own operation are stronger than an industry average. If the numbers are a plan rather than a record, label them as a plan.
Keep extra services for later. Insurance fees, premium delivery and value-added services can matter, but a slide that lists them all hides the main source of money. Name the main one and give its numbers first.
Finally, redo every multiplication on the slide before you send the deck. Two of the seven slides here show their working, and one of those two uses the wrong number. Investors in delivery businesses tend to check these sums in the meeting, so an error costs more trust than leaving the sum out.
Adapting the slide to your type of logistics business
Couriers that resell carrier capacity should show buy price, sell price and margin side by side, and say whether the margin holds for heavier or longer shipments. Global Xpress notes that its margin varies with weight, which is useful context.
Companies that run their own fleet should show the rider sum: how many riders, how many hours, how many orders per hour, and what each order earns after rider pay and fuel. GoApe's slide is a good model for the layout, though it should say what its profit per order is after.
Software and platform companies should show price per customer per month and the number of customers, or price per use and expected usage. If tools are free and only usage is charged, as Locus says, give the expected usage per customer.
Food and local delivery platforms should show the fee per order and how it compares with what restaurants or shops pay elsewhere, as Check Eat does, and then what the platform keeps after paying for delivery.
Common mistakes
Wrong number in the sum. Multiply by the figure you labelled, not another one.
Revenue called margin. Say whether a figure is sales or what you keep.
Vague pricing. "A few cents" is not a price.
Service lists. Name the main fee and its amount first.
No volume. Show how many deliveries the price applies to.
Double counting. Say how customer and merchant earnings relate.
Diagnostic checklist
Price per delivery or per month stated.
Cost passed to drivers or carriers shown.
Margin per delivery given.
Volume sum shown with its inputs.
Each multiplication checked.
Extra services kept secondary.
Frequently asked questions
How do delivery and logistics startups make money?
By reselling carrier capacity at a margin (Global Xpress), charging per-shipment fees (TopDelivery), earning on orders delivered by their own riders (GoApe), charging flat platform fees (Check Eat), or selling routing software (Locus).
What should a logistics business model slide include?
The price per delivery, what is paid to drivers or carriers, what the company keeps, and how many deliveries it expects, with the multiplication shown.
What is the most common mistake?
Mixing up revenue and margin. Global Xpress labels 50 INR as revenue per shipment but multiplies by its 300 INR selling price.
Should I compare my fees with competitors on this slide?
It helps if price is your advantage. Check Eat sets its USD $0.50 fee beside rivals' 14% to 35% of the bill.
How we chose these examples
Corpus: published pitch deck teardowns on StartupFundraising.com. Founder-uploaded private decks are excluded.
Selection (2026-10-01): we searched extracted slide text across the full corpus for business model or revenue model slides that mention delivery, shipping, freight, couriers or logistics. We shortlisted 9 slides not used in other guides, viewed all of them and kept 7 companies (8 slides; GoApe has two).
Not used: Koffie p8 (no revenue content) and Liefergrün p8 (text too small to read).
Review: stored slide images were read at full size on 2026-10-01 against company, deck and slide number, and every calculation shown on a slide was redone (editorial model review). No person has yet completed an editorial review of this page. We did not verify any company's revenue, fees or volumes.