Channel Partner and Reseller Go-to-Market Pitch Deck Slides
How to present selling through resellers, distributors and channel partners on a pitch deck: who the partner is, what share they keep, what you keep.
How to Present Channel Partners and Resellers on a Go-to-Market Slide
Eight slides from real pitch decks show how founders explain selling through other companies: resellers who take a commission, distributors and retailers who add their own margin, platforms that bundle your product, and one company that chose to cut resellers out.
TL;DR
A channel partner slide should name the partner, say what share of each sale the partner keeps and what you keep, and show how many customers the partner can reach. TourMega puts both sides of its model on one slide: selling direct, it earns 10–30% commission from suppliers; selling through hotels and other distribution partners, it pays them and keeps 5–15%. Workep, which planned to sell through Google resellers, shows the arithmetic: $1 million of revenue, $200,000 (20%) to the resellers, $800,000 left before costs. Public Goods shows what a chain of middlemen does to price: $2 at the factory, $4 from the brand, $8 from the distributor. McLovin lists six retail and distributor customers by store count and pet revenue; its totals add up, but one row's percentage does not match its dollar figure. MetaCert sells through an app-building platform that offers its service to every app made on it. Relevize sizes the market for partner sales with sourced figures. Convious is the contrast: its pitch is helping venues stop paying resellers. AppBind is the weak example, with two percentages and no source.
Channel partner and reseller slides from real pitch decks
Each example shows the exact stored slide above its analysis and links to the full teardown. Stage and year are given only where the deck states them. Figures are the company's own claims.
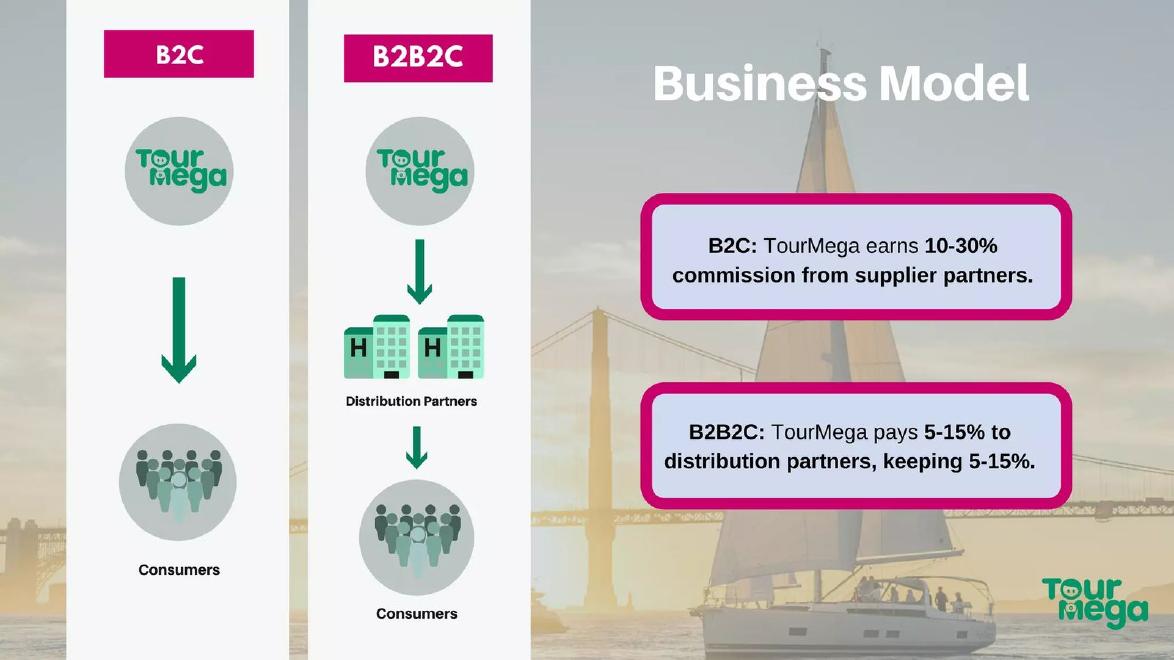
TourMega go to market slide — slide 7
Search engine for tours and activities. 2023 seed deck.
TourMega deck, slide 7. Exact stored slide matched to this analysis.
Our analysis: Shows the direct channel and the partner channel side by side, with what TourMega keeps in each.
Evidence and limitation: Commission rates with no volume behind them.
What a founder can adapt: Add bookings per month for each channel.
Supporting analysis
What the deck claims: B2C: TourMega earns 10-30% commission from supplier partners. B2B2C: TourMega pays 5-15% to distribution partners, keeping 5-15%.
Presentation choice: Shows the direct channel and the partner channel side by side, with what TourMega keeps in each.
When it does not fit: Commission rates with no volume behind them.
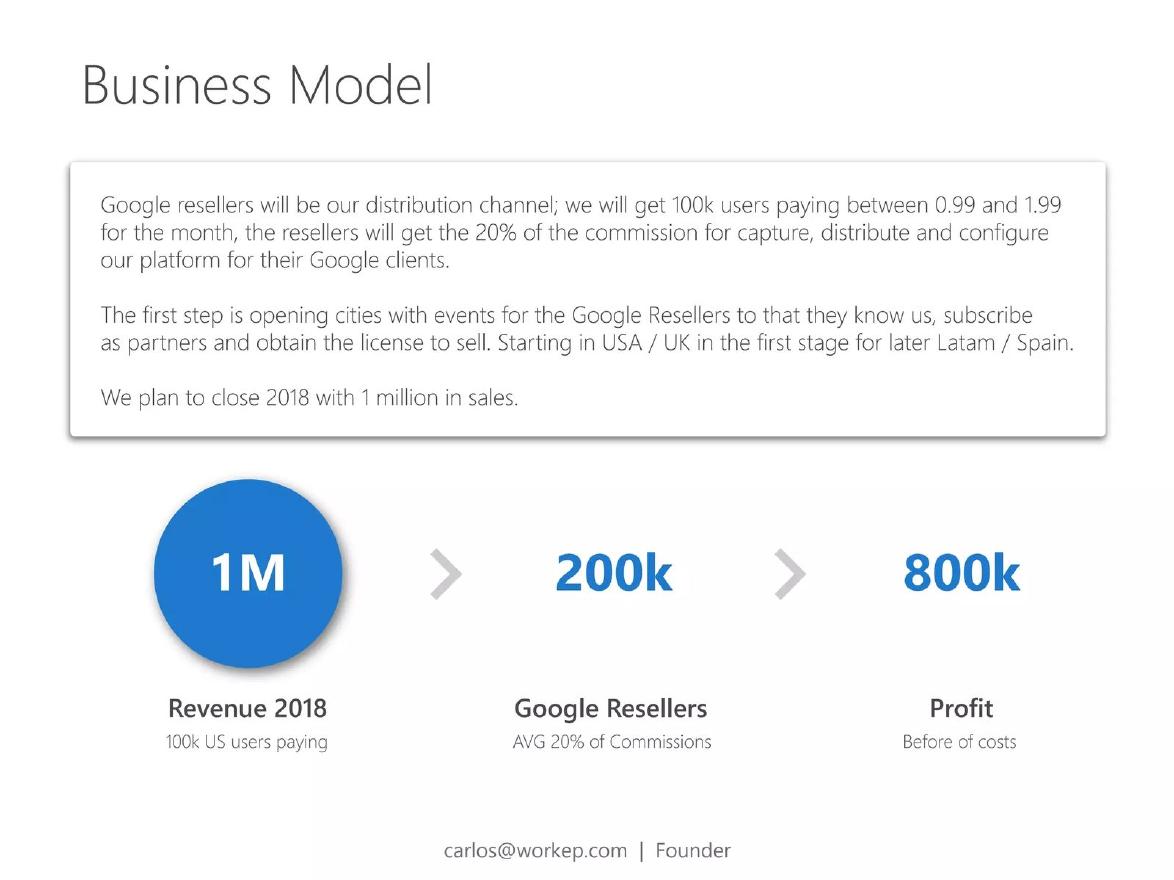
Workep deck, slide 8. Exact stored slide matched to this analysis.
Our analysis: Puts the partner's cut in dollars, and the three figures agree.
Evidence and limitation: Calling revenue after the partner's cut "profit".
What a founder can adapt: Say how many resellers you expect and how many users each brings.
Supporting analysis
What the deck claims: Google resellers will be our distribution channel; 100k users paying 0.99 to 1.99 a month; resellers get 20%. $1M revenue 2018 → $200k Google resellers → $800k profit before costs.
Presentation choice: Puts the partner's cut in dollars, and the three figures agree.
When it does not fit: Calling revenue after the partner's cut "profit".
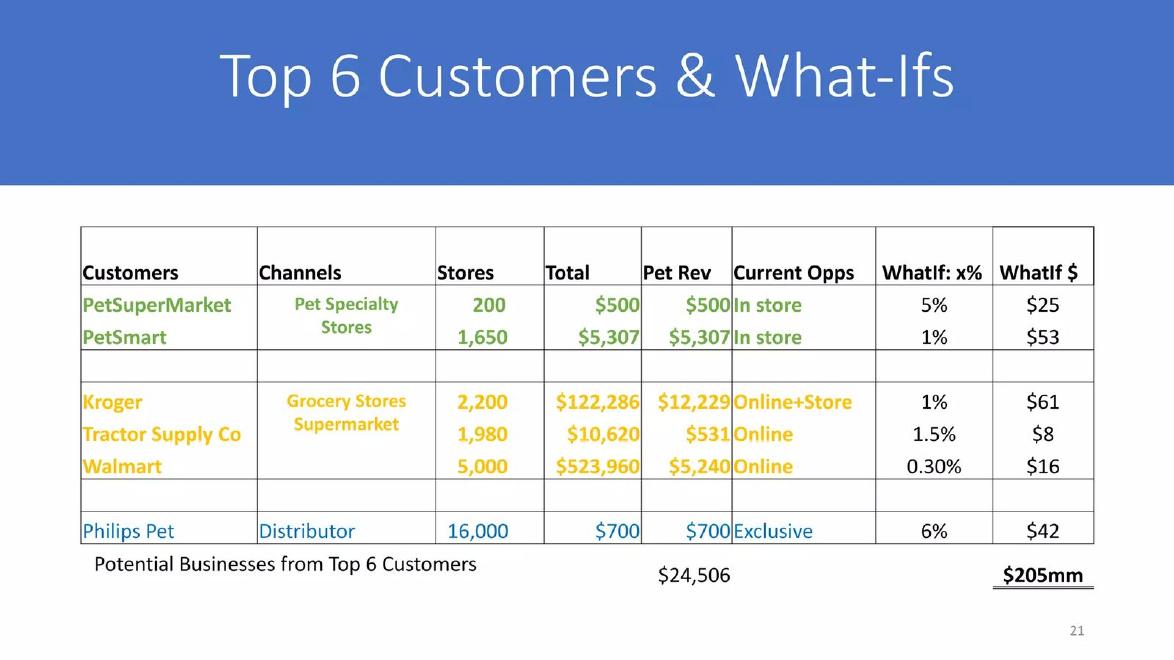
McLovin deck, slide 21. Exact stored slide matched to this analysis.
Our analysis: Names real retailers, their size and a reachable share for each. Totals add up; the Kroger row (1% shown as $61) does not.
Evidence and limitation: A table with no units and an inconsistent row.
What a founder can adapt: Label the units and correct the Kroger row.
Supporting analysis
What the deck claims: Top 6 Customers and What-Ifs: PetSuperMarket, PetSmart (pet specialty), Kroger, Tractor Supply Co, Walmart (grocery), Philips Pet (distributor); stores, pet revenue, current opportunity, What-If share and dollars. Totals $24,506 and $205mm.
Presentation choice: Names real retailers, their size and a reachable share for each. Totals add up; the Kroger row (1% shown as $61) does not.
When it does not fit: A table with no units and an inconsistent row.
Link security company selling through an app-building platform.
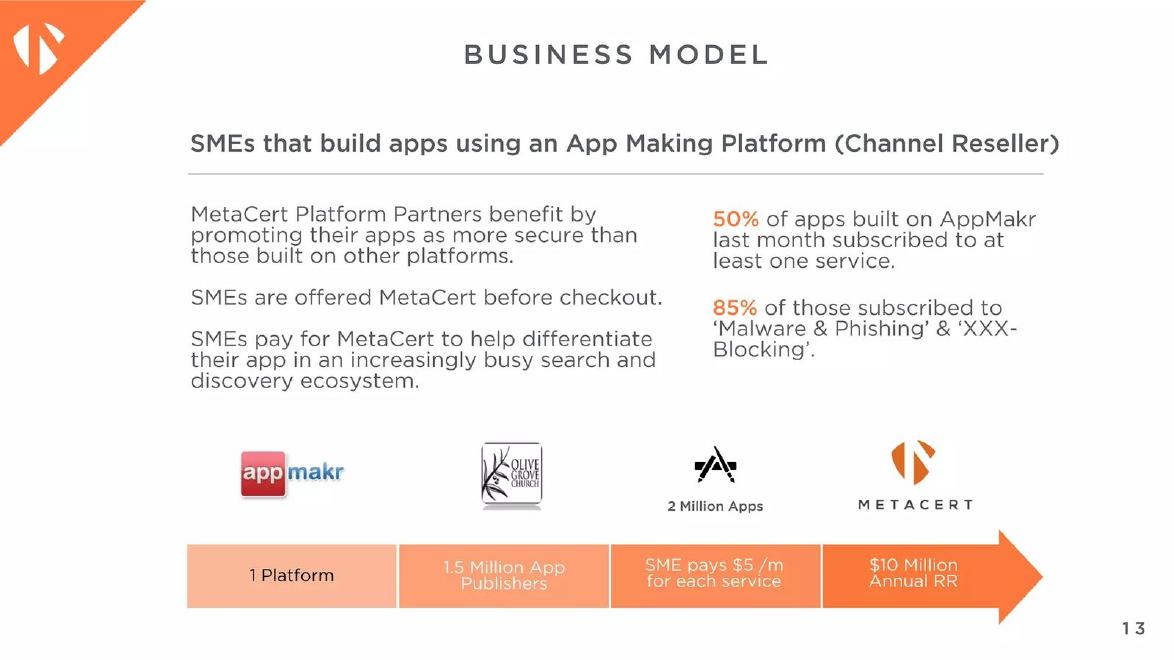
MetaCert deck, slide 14. Exact stored slide matched to this analysis.
Our analysis: Shows a platform as the channel, with real take-up rates.
Evidence and limitation: A revenue target that is not worked out from the figures beside it.
What a founder can adapt: State the platform's share of each $5 and how the $10 million is reached.
Supporting analysis
What the deck claims: SMEs that build apps using an App Making Platform (Channel Reseller). 50% of apps built on AppMakr last month subscribed to at least one service; 85% of those subscribed to malware and phishing blocking. 1 platform → 1.5 million app publishers → 2 million apps → SME pays $5/m for each service → $10 million annual RR.
Presentation choice: Shows a platform as the channel, with real take-up rates.
When it does not fit: A revenue target that is not worked out from the figures beside it.
Software for partner incentive programmes, Austin.
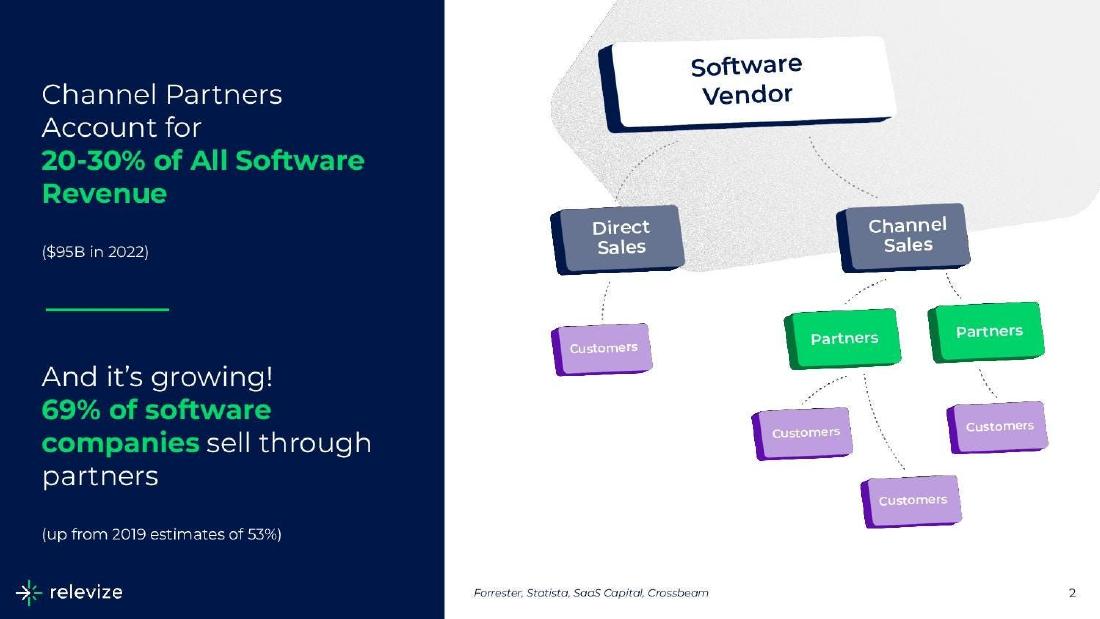
Relevize deck, slide 2. Exact stored slide matched to this analysis.
Our analysis: Supports a claim about partner sales with named sources.
Evidence and limitation: Market figures with no year or source.
What a founder can adapt: Use it to set up your own channel plan, not as the plan itself.
Supporting analysis
What the deck claims: Channel partners account for 20-30% of all software revenue ($95B in 2022). 69% of software companies sell through partners (up from 2019 estimates of 53%). Sources: Forrester, Statista, SaaS Capital, Crossbeam.
Presentation choice: Supports a claim about partner sales with named sources.
When it does not fit: Market figures with no year or source.
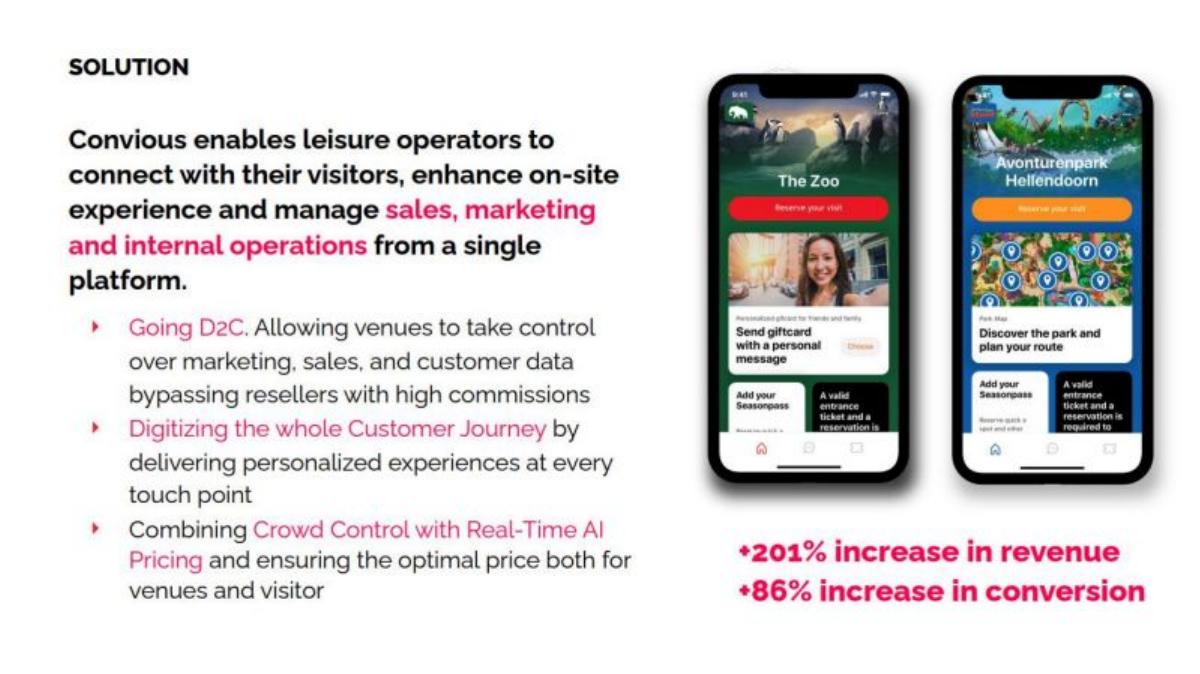
Convious deck, slide 4. Exact stored slide matched to this analysis.
Our analysis: The contrast: the pitch is removing resellers, and it names their cost.
Evidence and limitation: Calling commissions high without a number.
What a founder can adapt: Give the typical reseller commission and what the increases were measured against.
Supporting analysis
What the deck claims: Going D2C: venues take control over marketing, sales and customer data, bypassing resellers with high commissions. +201% increase in revenue; +86% increase in conversion.
Presentation choice: The contrast: the pitch is removing resellers, and it names their cost.
When it does not fit: Calling commissions high without a number.
Most slides name the channel; few give the split and the volume together.
Example
Partner type
Partner's share stated
What you keep stated
Volume stated
TourMega
Hotels, distribution partners
Yes (5–15%)
Yes (5–15%)
No
Workep
Google resellers
Yes (20%)
Yes ($800k)
Yes (assumed)
Public Goods
Factory, distributor
Price steps
No
No
McLovin
Retailers, distributor
No
No
Store counts
MetaCert
App-building platform
No
No
Take-up rates
Relevize
Market figures
No
No
Market only
Convious
Resellers (removed)
No
No
No
AppBind
Resellers
No
No
No
Key Takeaways
Name the partner type: reseller, distributor, retailer, platform or referral partner.
State the partner's share of each sale and what you keep after it.
Show how many customers each partner can reach, not just their logos.
Compare the partner channel with selling direct: cost, speed and margin.
If you stack several middlemen, show the price at each step.
Test your channel partner slide before you send it
Answer these with numbers, even if they are targets.
Partner. What kind of partner sells for you, and how many do you have or expect?
Split. What share of each sale does the partner keep?
Kept. What do you keep per customer after the partner's share?
Volume. How many customers does each partner bring per month?
Direct. How does that compare with a customer you win yourself?
Copyable framework: [n] [partner type] sell [product]; they keep [share]%, we keep [amount] per customer; each brings [n] customers a month, against [n] from our own team at [cost] each
Illustrative example 1 — written by us
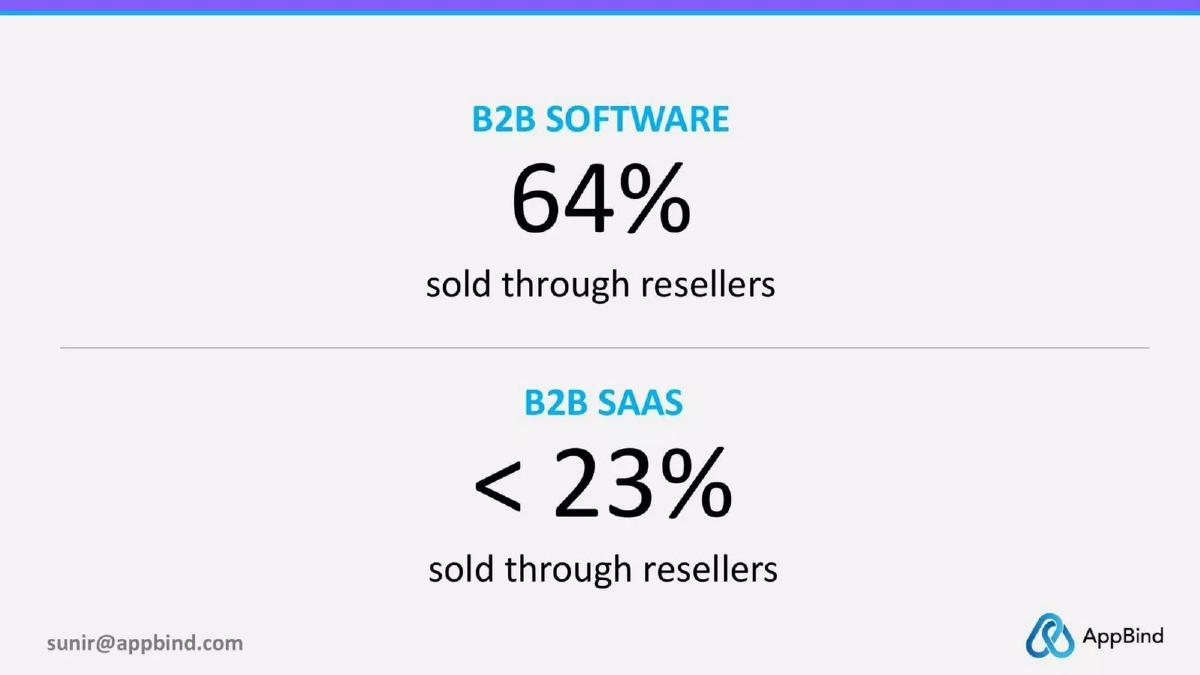
Before: B2B software: 64% sold through resellers. B2B SaaS: under 23% sold through resellers.
After: [Source, year]: 64% of B2B software is sold through resellers. We sign [n] resellers, each keeping [share]%, bringing [n] customers a month
What improved: Our illustrative rewrite, not AppBind's text. Bracketed parts are placeholders, not company facts. It sources the figure and turns it into a channel plan.
What this guide covers
Selling through channel partners means another company sells, installs or recommends your product to its own customers, and keeps part of the money in return. The partner might be a reseller who adds your software to what it already sells, a distributor who buys stock and sells it on to shops, a retailer who puts your product on its shelves, a platform that offers your service inside its own, or a referral partner who sends customers your way for a fee.
Investors ask three questions about any partner channel. How much of each sale does the partner keep, and is what you keep enough to run the business? Can the partner really reach more customers, faster, than you could on your own? And how much control do you give up over price, the customer relationship and the customer data?
Our go-to-market guides cover customer acquisition, sales cycles, conversion funnels, organic growth and international expansion, but none covers selling through partners. We searched our corpus for resellers, channel partners and distributors and found about 123 decks mentioning them, 64 of them with a figure nearby. Two strong slides, Once Upon a Farm's margin chain and Bliinx's comparison of direct sales with channel partners, already appear in other guides and are not repeated here. Eight slides from eight private companies were readable and differ enough to teach something.
Show what the partner keeps and what you keep
The single most important number on a channel slide is the split. Every sale through a partner earns you less than a sale you make yourself, so the slide has to show that what remains is still worth having.
TourMega, a search engine for tours and activities, does this better than any other slide in this set. Its business model slide shows two flows side by side. In the first, labelled B2C, TourMega sends consumers straight to tours and "earns 10-30% commission from supplier partners". In the second, labelled B2B2C, hotels and other distribution partners sit between TourMega and the consumer, and "TourMega pays 5-15% to distribution partners, keeping 5-15%". An investor can see at once that a partner sale is worth roughly half a direct sale, and can then ask the obvious question: do partners bring enough extra bookings to make up for it? The slide does not answer that. It gives no booking numbers for either channel.
Workep, a task management app built for Google Workspace users, gives the split and the totals. Its business model slide says "Google resellers will be our distribution channel; we will get 100k users paying between 0.99 and 1.99 for the month, the resellers will get the 20% of the commission for capture, distribute and configure our platform for their Google clients." Three circles below read $1M revenue 2018, $200k to Google resellers (average 20% of commissions) and $800k profit before costs. The three figures agree with each other: 20% of $1 million is $200,000, and what is left is $800,000. That is a useful example of putting the partner's cut in dollars, not just as a percentage. Two things weaken it. The label "profit" is generous for money that has not yet paid for anything else, and the plan rests on 100,000 paying users without saying how many resellers there are or how many users each one brings.
When the chain has several links
Physical products often pass through more than one middleman: a factory, a brand, a distributor, a retailer. Each adds its own margin, and the consumer pays for all of them. If your product goes through that chain, show the price at each step, because the margins decide whether the product can be sold at a price people will pay.
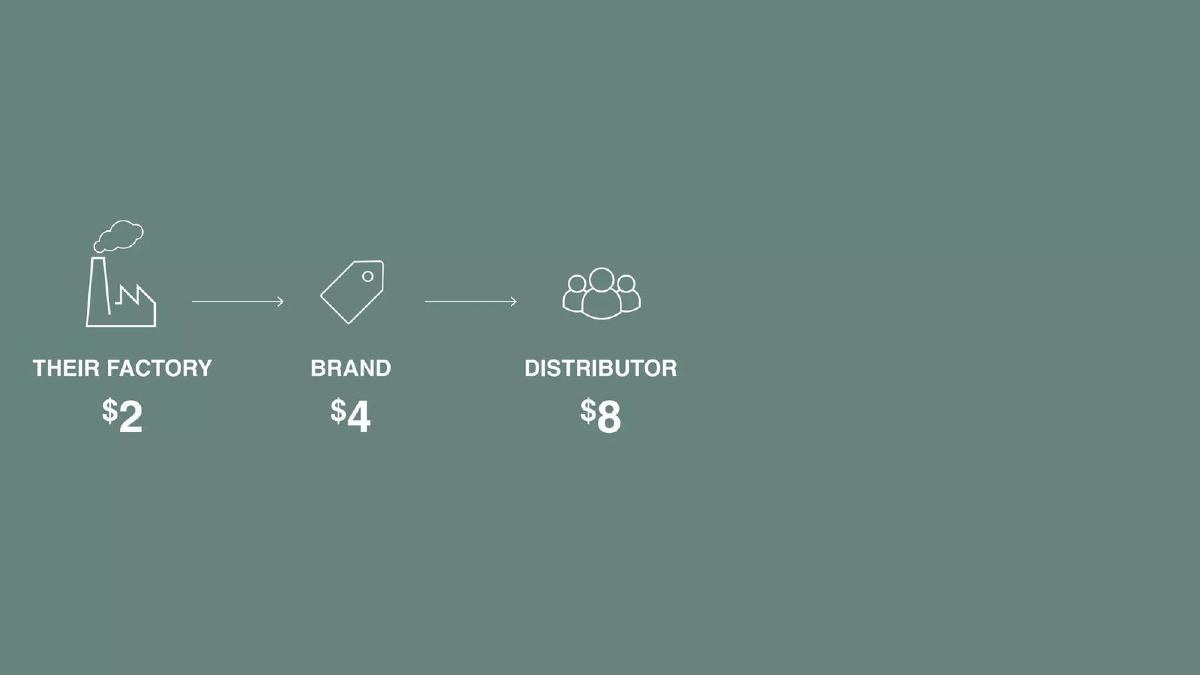
Public Goods, which sells household and personal care products under its own brand, uses this chain as its argument for selling direct. One slide shows three steps with a price under each: their factory $2, brand $4, distributor $8. The price doubles at each step. The slide is part of a short sequence in which the next steps add the retailer, and the point is that by selling straight to consumers Public Goods can cut out those links and charge less. It is a clear way to make a channel argument with numbers, even though the figures are illustrative rather than costs for a named product.
McLovin, a pet products company, takes the opposite approach: it wants to be in as many retailers as possible. Its slide, titled Top 6 Customers and What-Ifs, is a table of six customers grouped by channel. Pet specialty stores: PetSuperMarket (200 stores, $500 pet revenue, sold in store) and PetSmart (1,650 stores, $5,307). Grocery stores and supermarkets: Kroger (2,200 stores, total $122,286, pet revenue $12,229, online and in store), Tractor Supply Co (1,980 stores, $531 pet revenue, online) and Walmart (5,000 stores, $5,240 pet revenue, online). Distributor: Philips Pet (16,000 stores, $700, exclusive). A What-If column applies a share to each retailer's pet revenue: 5%, 1%, 1%, 1.5%, 0.3% and 6%, giving $25, $53, $61, $8, $16 and $42.
We checked the arithmetic. The pet revenue column adds to $24,507 by our sum, against $24,506 printed, a rounding difference. The What-If column adds to exactly $205, matching the $205mm at the bottom. Five of the six rows are consistent: 5% of $500 is $25, 1% of $5,307 is about $53, 1.5% of $531 is about $8, 0.3% of $5,240 is about $16, and 6% of $700 is $42. Kroger is not: 1% of $12,229 is about $122, but the slide shows $61, which is 0.5%. Either the percentage or the dollar figure is wrong, and the total depends on which. The table also never says what unit its dollar figures are in; only the $205mm total suggests millions. The slide is still useful as a model, because it names real retailers, gives their size and shows what share of their category the founder thinks is reachable. It needs units and a corrected row.
Platforms as partners
Some of the best channels are not resellers at all but platforms: software that thousands of businesses already use, which can offer your product to all of them at once. The partner gets a better product to sell; you get access to customers you could never reach one by one.
MetaCert, a link security company, describes this on a slide titled Business Model: SMEs that build apps using an App Making Platform (Channel Reseller). The text explains that "MetaCert Platform Partners benefit by promoting their apps as more secure than those built on other platforms" and that "SMEs are offered MetaCert before checkout." Two figures sit on the right: 50% of apps built on AppMakr the previous month subscribed to at least one service, and 85% of those subscribed to malware and phishing blocking. A row along the bottom runs from one platform to 1.5 million app publishers, 2 million apps, SMEs paying $5 a month for each service, and $10 million annual recurring revenue. The take-up percentages are the strongest part, because they show how many of the platform's customers actually bought. What is missing is the split: the slide never says what share of the $5 the platform keeps, and the $10 million target is not worked out from the other figures.
Size the opportunity with sources
If you are building something that serves channel partners, or if you want to argue that a partner channel is normal in your market, sourced figures help. Investors are more willing to accept a market claim when they can see where it came from.
Relevize, which builds software to manage partner incentive programmes, opens its deck with a slide titled Channel Partners Account for 20-30% of All Software Revenue ($95B in 2022). It adds "And it's growing! 69% of software companies sell through partners (up from 2019 estimates of 53%)." A diagram shows a software vendor selling through direct sales on one side and channel sales on the other, with partners passing customers on. The sources are listed at the foot of the slide: Forrester, Statista, SaaS Capital and Crossbeam. This is a market slide rather than a channel plan, but it is a good model for how to support a claim about how common partner sales are.
AppBind is the weak counterpart. Its slide says simply "B2B software 64% sold through resellers" and "B2B SaaS under 23% sold through resellers". The contrast is striking and could set up a strong argument, but there is no source, no year and no explanation of how either figure was measured, so an investor has no reason to trust it.
The contrast: cutting resellers out
Not every company wants partners. Sometimes the pitch is the opposite: helping businesses stop paying middlemen.
Convious, which builds online sales software for theme parks, zoos and other attractions, puts this in the first point of its solution slide: "Going D2C. Allowing venues to take control over marketing, sales, and customer data bypassing resellers with high commissions." The next points cover personalising the customer journey and combining crowd control with real-time pricing, and two results are printed in red: +201% increase in revenue and +86% increase in conversion. The slide names the cost of the channel (high commissions and lost customer data) and offers a way around it. It does not say how high the resellers' commissions are, which would make the saving concrete, or what the revenue and conversion increases were measured against.
Convious and Public Goods are a reminder that a channel slide can argue either way. If you sell through partners, show that the split leaves you enough. If you are removing partners, show how much they cost and what customers gain.
Compare the partner channel with selling direct
Investors will compare the partner channel with selling direct whether or not your slide does. Doing it for them shows that you have thought about it. The useful comparison has four parts: the cost of winning a customer, the share of revenue you keep, how fast customers arrive, and who owns the customer relationship.
TourMega's slide comes closest to this in our set, because it shows both channels and both commission rates. Workep shows only the partner channel but gives the full split. The others show one side. A slide that put a direct sale and a partner sale next to each other, with the cost to win each customer, the share kept and expected volume per month, would answer most of the questions an investor is likely to ask.
A worked example: selling direct versus through resellers
This example uses illustrative figures, not company data. Suppose you sell business software at $1,000 a year per customer. Selling direct, your own team signs 20 customers a month, and each one costs you $600 in sales and marketing. You keep the full $1,000, so after acquisition cost each customer is worth $400 in the first year.
Now add resellers who keep 25% of each sale. A reseller customer earns you $750 a year, but costs you only $100 in partner support and training. That leaves $650 in the first year, more than a direct customer, because the partner pays for the selling. If 10 resellers each bring 4 customers a month, that is 40 extra customers, twice what your own team signs.
The comparison changes if the partner's cut is higher, if partners need heavy support, or if their customers leave sooner because nobody at your company knows them. That is why the slide should show the numbers for both channels: price, share kept, acquisition cost, customers per month and, if you know it, how long customers stay in each.
Put it on your slide as two short rows: direct and partner, each with share kept, cost per customer and customers per month. That is the calculation an investor will do anyway.
Common mistakes
No split. Say what share the partner keeps.
Logos without reach. Show how many customers each partner can bring.
No comparison with direct. Show why the partner channel is worth its cut.
Unsourced market figures. Name the source and year.
Inconsistent tables. Check every row and label the units.
Diagnostic checklist
Partner type named.
Partner's share and your share stated.
Customers per partner per month.
Direct and partner channels compared.
Units and sources labelled.
Frequently asked questions
How we chose these examples
Corpus: published pitch deck teardowns on StartupFundraising.com. Founder-uploaded private decks are excluded.
Selection (2026-10-01): we searched extracted slide text for resellers, channel partners and distributors near a figure (64 decks), then read each candidate from images made from the original deck files.
Eligibility: each company was private when its deck was made. TourMega (seed), Public Goods (Series A and B, privately held), Convious (Series A rounds in 2021 and 2023), Relevize (seed, 2022) and MetaCert (privately held) were checked against public sources. Workep, AppBind and McLovin rest on their own decks and the absence of any known listing.
Not used: Once Upon a Farm and Bliinx (these slides already appear in other guides); Iveda and Calpian (listed at deck date).
Arithmetic: we checked Workep ($1,000,000 less 20% is $800,000) and McLovin (pet revenue column $24,507 against $24,506 printed; What-If column $205, matching; Kroger row 1% of $12,229 shown as $61, which is 0.5%).
Overlap check: the customer acquisition and partnerships guides do not cover partner revenue splits; no guide covers channel partners and resellers.
Review: all eight slide images were inspected on 2026-10-01 and matched to company, deck and slide number (AI editorial model review). No person has yet completed an editorial review of this page. The worked example uses illustrative figures, not company data.
Figures are the companies' own claims; we did not verify underlying data. We make no claim that any slide caused a fundraising outcome.