The Public Goods pitch deck is a notable example of 'less is more' in the D2C space. Spanning just 14 slides, the deck relies heavily on visual storytelling to illustrate the inefficiencies of the traditional retail supply chain. Rather than using dense spreadsheets, the founders used a step-by-step build to show how a $2 factory cost balloons into a $20 retail price. This narrative sets the stage for their membership model—selling products 'at cost' for a $59 annual fee. While the deck lacks traditional sections like a detailed market size (TAM) analysis or a specific 'Ask' slide, its clear…
Key takeaways
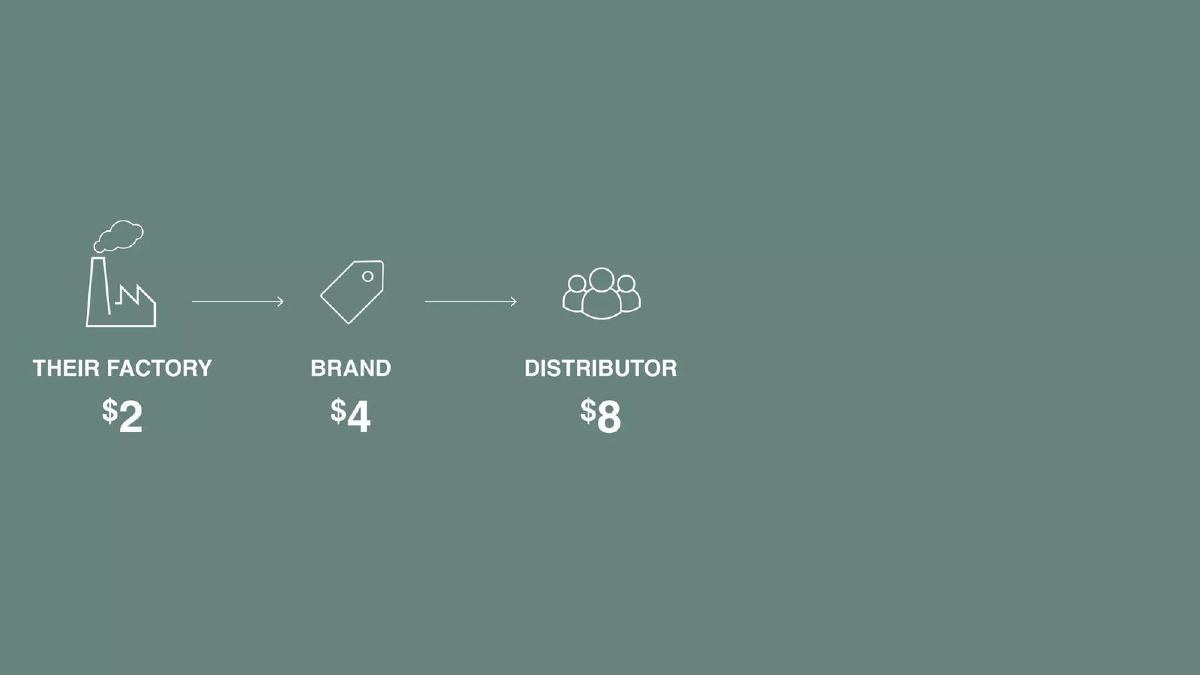
- The deck uses a five-slide progressive build (Slides 4-8) to visually demonstrate how middleman markups increase consumer prices by 10x.
- Public Goods positions itself as a solution to the $4,000 'healthy organic' price premium paid by average households (Slides 2-3).
- The business model is explicitly stated as 'Direct to consumer, at cost, for annual membership' at $59/yr (Slide 10).
- Traction is displayed as a simple bar chart showing sales growth to $750,000 in 2017 (Slide 11).
- The team slide emphasizes a 15-year relationship between the founders, showing photos from 2002 and 2017 (Slide 13).
- The founders leverage past experience at major retailers including Walmart, Barneys New York, Saks Fifth Avenue, and J.Crew (Slide 13).
- The deck mentions a previous raise of $1.4 million since participating in 500 (presumably 500 Startups) on Slide 12.
- There is no explicit 'Ask' slide detailing how the $3M seed round will be allocated.
Public Goods: The Power of Visual Logic in D2C Fundraising
The Public Goods seed deck is a masterclass in minimalist design and narrative-driven pitching. In an era where many founders overwhelm investors with data-heavy slides, Public Goods opted for a 14-slide presentation that feels more like a brand lookbook than a corporate report. This approach aligns perfectly with their business: a minimalist, high-quality consumer goods brand. By using very few words and large, high-contrast visuals, the deck forces the investor to focus on a single, compelling logic chain: the traditional retail supply chain is broken, and a membership model is the fix.
Slides 1-3: Setting the Financial Stakes
Slide 1 is a clean title slide featuring the company name and a minimalist product shot of a razor, shampoo, and soap. It immediately establishes the brand's aesthetic—clean, white, and premium. Contact information for 'Morgan' and an AngelList link are provided at the bottom.
Slide 2 introduces the market context with a single figure: '$6,000'. The caption identifies this as the 'Average American Household' spend on household goods. The background image shows a family in a brightly lit, traditional supermarket, grounding the data in a relatable everyday activity.
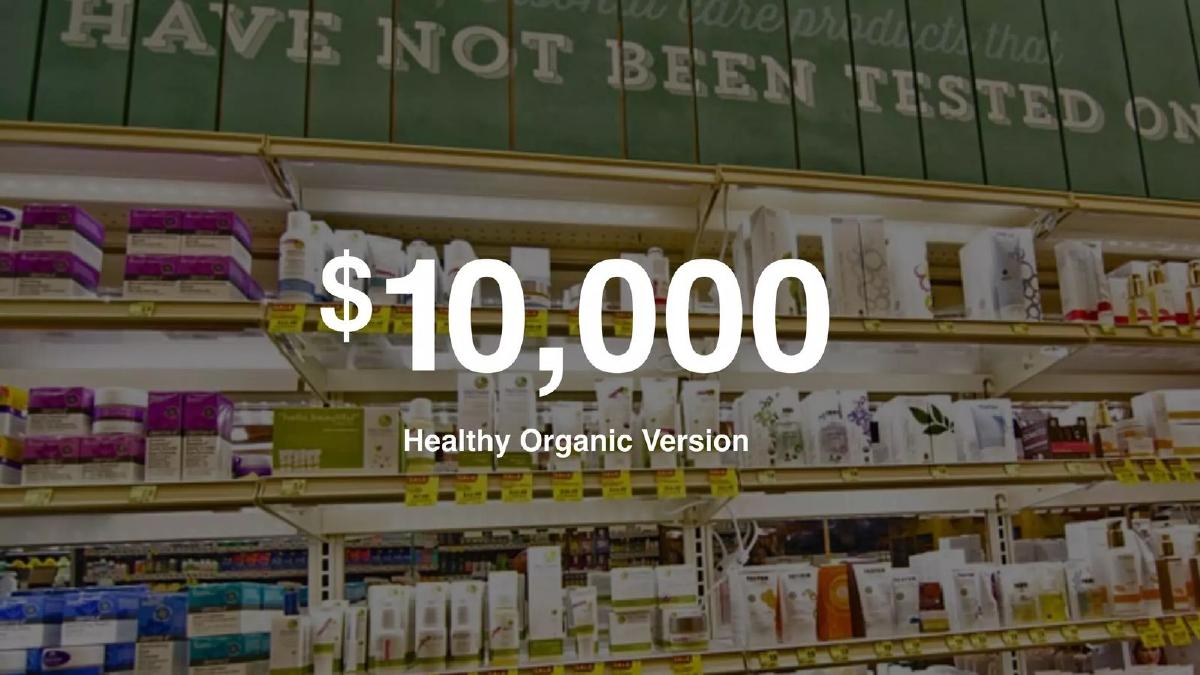
Slide 3 presents the 'Problem' with a stark comparison. It shows the figure '$10,000' for the 'Healthy Organic Version' of that same household spend. By showing a $4,000 premium for healthy living, Public Goods identifies a clear economic pain point for consumers without needing a single bullet point of text.
Slides 4-8: The Supply Chain Teardown
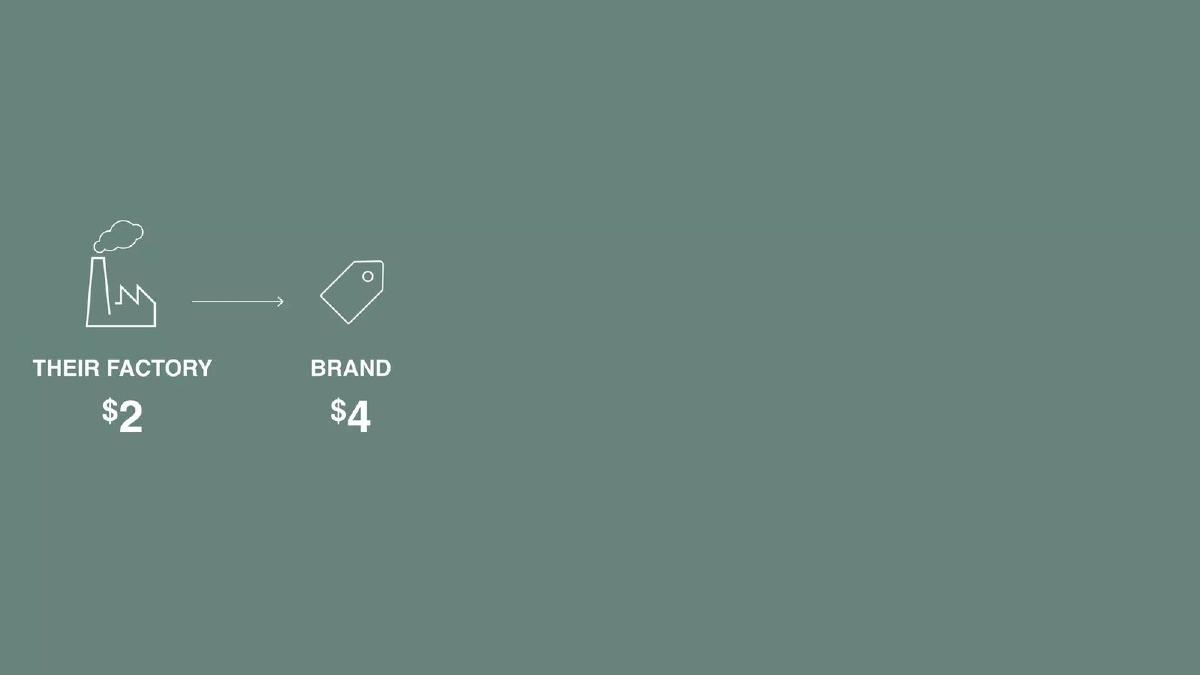
This section is the heart of the deck's logical argument. It uses a progressive build to explain why products are expensive. Slide 4 starts at 'Their Factory' with a cost of $2. Slide 5 adds the 'Brand' layer, increasing the cost to $4. Slide 6 introduces the 'Distributor' at $8. Slide 7 brings in the 'Retailer', where the price jumps to $20. Finally, Slide 8 shows the end consumer: 'You With Less $$$' and a sad face icon. This 10x markup from factory to shelf is presented as an inherent inefficiency of the status quo.
Slides 9-10: The Public Goods Solution
Slide 9 acts as the mission statement: 'Make healthy products affordable to all.' The visual shows Public Goods products (toothpaste, hand soap, shaving cream) in a real-world bathroom setting, reinforcing the 'premium but accessible' brand identity. Slide 10 reveals the business model. It mirrors the supply chain slides but replaces the middlemen with a single line: 'Direct to consumer, at cost, for annual membership.' The price point is clearly stated as '$59/yr'. This slide is crucial because it explains how the company makes money if they are selling products 'at cost'.
Slides 11-12: Traction and History
Slide 11 provides a simple bar chart comparing 2016 to 2017. The 2017 bar is significantly larger, with the text '$750,000 Sales This Year' prominently displayed. The 2016 bar appears to be around the $100,000 mark, though it is not explicitly labeled with a figure. This demonstrates a 7.5x year-over-year growth rate, which is a strong signal for a seed round.
Slide 12 provides a brief fundraising history. It states, 'Since 500—$1.4million raised.' This likely refers to their participation in the 500 Startups accelerator program. Mentioning previous successful raises and institutional backing (500) builds social proof and momentum for the current $3M round.
Slides 13-14: The Team and Closing
Slide 13 is the team slide, but it avoids the standard 'Headshot + Bio' format. Instead, it shows two photos of the founders: one from 2002 and one from 2017. This visually communicates 15 years of partnership. Below the photos are the logos of major retailers: Walmart, Barneys New York, Saks Fifth Avenue, and J.Crew. This implies that the team has deep, high-level experience in the very industry they are trying to disrupt. The deck concludes on Slide 14 , which is a black version of the title slide with the same contact information.
What Works in the Public Goods Deck
The most successful element of this deck is its logical progression . By the time an investor reaches Slide 10, the $59 membership fee feels like a bargain because the founders have already spent five slides proving that the alternative is a $4,000 'organic tax'. The use of a progressive build for the supply chain (Slides 4-8) is a brilliant way to explain a complex industry problem in seconds.
Furthermore, the brand-product alignment is perfect. The deck looks exactly like the products they sell. This gives investors confidence that the founders understand brand identity—a critical skill in the D2C (Direct-to-Consumer) space. The team slide is also a standout; by showing a 15-year history, they mitigate one of the biggest fears investors have: founder breakup.
What is Missing from the Public Goods Deck
While the deck is highly persuasive, it omits several standard components that many institutional investors require. First, there is no Market Size (TAM/SAM/SOM) slide. While we can infer the market is huge based on 'Average American Household' spend, investors usually want to see a calculated Total Addressable Market.
Second, there is a complete lack of Unit Economics . While they say they sell 'at cost,' investors would want to know the specifics: What is the CAC (Customer Acquisition Cost)? What is the churn rate on the $59 membership? How many memberships are needed to reach break-even? Selling products at cost means the membership fee must cover all overhead, marketing, and shipping subsidies, which is a high bar to clear.
Finally, there is no Ask Slide . The deck does not state how much they are raising or what the milestones for the next 18 months are. While the catalogue facts confirm a $3M raise, the deck itself leaves the 'next steps' entirely to the verbal pitch.
What a Founder Should Copy
Founders should emulate the visual storytelling used to explain the 'Problem'. If your business involves removing middlemen or improving efficiency, don't just say 'we are 50% cheaper.' Show the step-by-step inflation of costs in the current system. This makes your solution feel inevitable rather than just 'better'.
Additionally, the team slide strategy is worth copying. If you have a long history with your co-founder, prove it with a 'then and now' photo. It is a humanizing touch that stands out in a pile of generic LinkedIn-style bios. Lastly, the minimalist aesthetic is a powerful tool. If your slides have fewer than 20 words, the investor has no choice but to listen to you. This deck ensures the founder remains the center of the presentation, not the slides.
Company: Public Goods · Sector: E-Commerce / Consumer Goods · Stage: Seed · Year: Not stated in deck (Traction shows 2017) · Slides: 14 · Deck Type: Seed Pitch Deck · Outcome: Raised $3M · HQ: Not stated in deck
Frequently asked questions
- What is the core value proposition of Public Goods according to the deck?
- The core value proposition is making healthy, organic products affordable by removing traditional retail markups. Slide 9 summarizes this mission as 'Make healthy products affordable to all.' They achieve this through a membership model where products are sold at cost, shifting the profit center from product margins to a $59 annual subscription fee, as shown on Slide 10.
- How does the deck handle financial projections and unit economics?
- The deck is remarkably light on detailed financials. It provides a high-level traction figure of $750,000 in sales for 2017 (Slide 11) but does not include a slide for burn rate, CAC (Customer Acquisition Cost), LTV (Lifetime Value), or multi-year projections. It relies on the simplicity of the 'at cost' model to imply favorable unit economics via membership fees.
- Why did the founders include photos from 2002 on the team slide?
- This is a strategic move to demonstrate founder chemistry and long-term stability. By showing photos from 2002 alongside 2017 (Slide 13), the founders prove they have worked together for 15 years. For seed-stage investors, this reduces 'co-founder conflict' risk, which is a leading cause of early-stage startup failure.
- How is the 'Problem' slide structured in this deck?
- The problem is framed as a cost issue rather than a product quality issue. Slide 2 shows the average American household spends $6,000 on essentials, while Slide 3 shows that switching to a 'Healthy Organic Version' increases that cost to $10,000. The $4,000 gap is the specific problem Public Goods intends to solve.
- Is there a specific 'Ask' or use of funds mentioned in the slides?
- No. The 14 slides provided do not include a slide detailing how much money they are currently seeking or how they plan to spend it. While the catalogue facts state they raised $3M, the deck itself focuses entirely on the brand vision, the supply chain logic, and existing traction.