Legal Tech Market Size Slides: 7 Real Examples from Legal
How legal tech startups size their market: lawyers and court cases by state, cases × price per task, and software spend by segment.
Legal Tech Market Slide: Lawyers, Cases and What Each Pays
Lawyers, law firms and court filings are counted by bar associations, courts and labour statistics, so a legal tech market slide can start from real counts. The hard part is the price: some products charge per lawyer, some per case, some per task. The seven slides below show how different legal startups handled that, from a state-by-state lawyer count to a single headline figure.
TL;DR
Count the lawyers, firms or cases you can serve, say how you charge (per lawyer, per case or per task), and name where you start. Trellis is the clearest example: it shows lawyers and court cases for California, then California plus New York, then the whole US, and says revenue may be per attorney, per case or both.
Legal tech market slides from real pitch decks
Each example shows the slide above its analysis and links to the full teardown. Ground-up slides come first. Claims are as shown on the slides; comments and calculations are ours.
Trellis market slide — slide 6
State trial court research platform, US.
Trellis deck, slide 6. Exact stored slide matched to this analysis.
Our analysis: Counts by first state, then wider, plus the research budget.
Evidence and limitation: A services total, the narrower research spend, counts by region and a pricing basis. Our calculation: California is about 13% of US lawyers (168,000 of 1.3 million) and about 4% of cases (700,000 of 17 million). The slide doesn't give a price per attorney or per case.
What a founder can adapt: "[State]: [N] lawyers × $[price] = $[X]; US: [M] lawyers = $[Y]."
Supporting analysis
What the deck claims: "The Market." "TAM is huge." "$437 Billion in total legal services in the US." "$7+ Billion in legal research (Westlaw, Lexis, etc)." "Revenue may be per-attorney, per-case, or both." Circles: CA 168,000 lawyers, 700,000 cases filed; CA + NY 343,000 lawyers, 2 million cases filed; United States 1.3 million lawyers, 17 million cases filed. Source links sit under the chart.
Presentation choice: Shows where it starts and what kind of spend it competes for.
When it does not fit: Leading with the services total.
Proof deck, slide 4. Exact stored slide matched to this analysis.
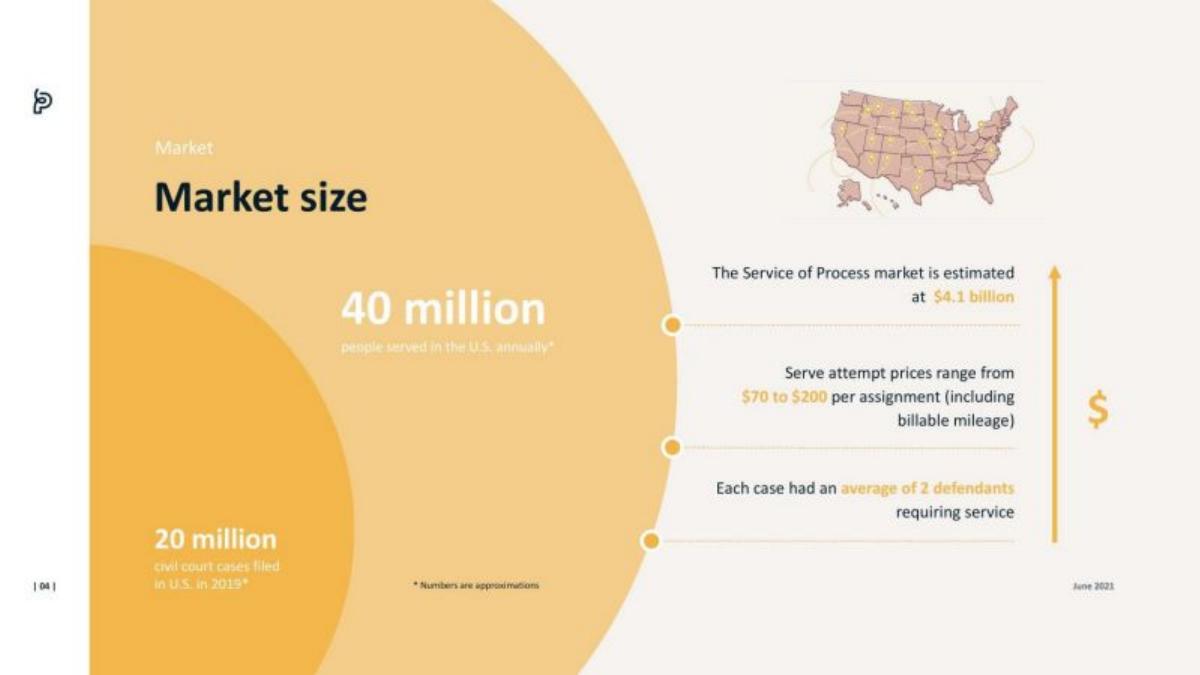
Our analysis: Cases × people per case × price per task.
Evidence and limitation: Cases, people per case and a price range per task. Our check: 20 million × 2 = 40 million, as shown. 40 million × $70–200 is $2.8–8B, and $4.1B works out to about $100 per person served, inside that range.
What a founder can adapt: "[N] cases × [n] tasks each × $[price] = $[X]."
Supporting analysis
What the deck claims: "Market size." "20 million civil court cases filed in U.S. in 2019*." "40 million people served in the U.S. annually*." "The Service of Process market is estimated at $4.1 billion." "Serve attempt prices range from $70 to $200 per assignment (including billable mileage)." "Each case had an average of 2 defendants requiring service." "*Numbers are approximations."
Presentation choice: Every step can be checked.
When it does not fit: Giving a price range without saying which end you use.
Marketing and client leads for small law firms, US.
Lawkick deck, slide 9. Exact stored slide matched to this analysis.
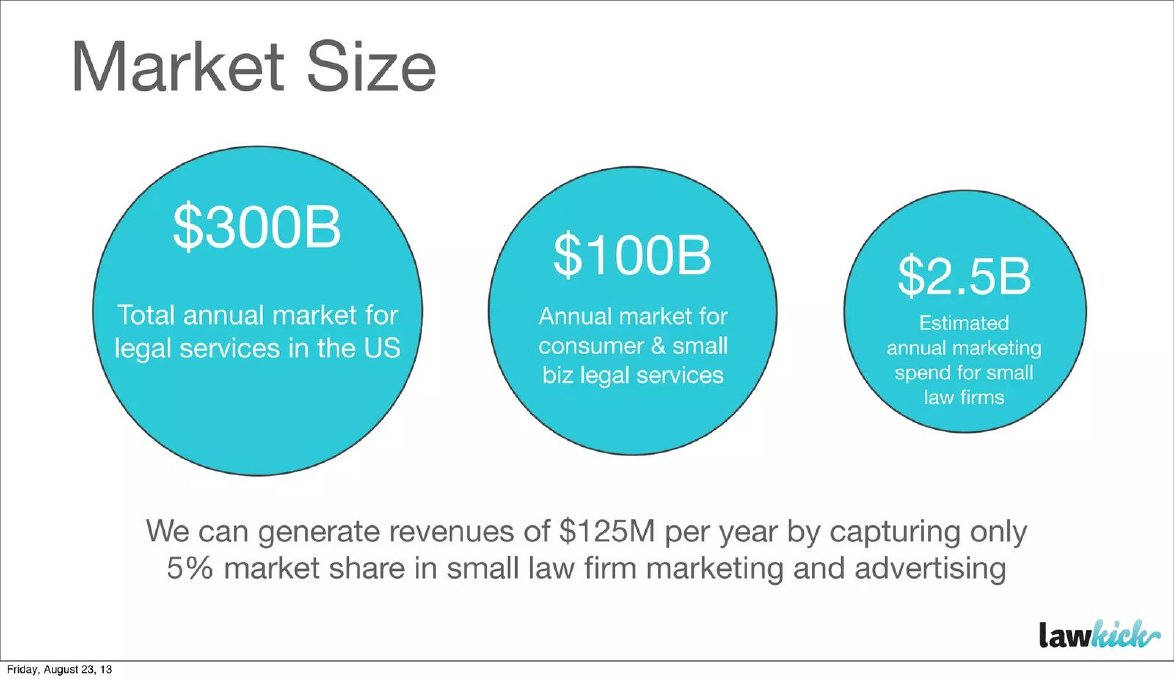
Our analysis: Services total narrowed to the marketing budget, then a share.
Evidence and limitation: Three nested figures narrowing to the budget it competes for. Our check: 5% of $2.5B is $125M, as shown. No source, firm count or price per firm is on the slide, and it doesn't say how the 5% is reached.
What a founder can adapt: "[N] small firms × $[marketing spend] = $[X]; we take $[price] each."
Supporting analysis
What the deck claims: "Market Size." "$300B Total annual market for legal services in the US." "$100B Annual market for consumer & small biz legal services." "$2.5B Estimated annual marketing spend for small law firms." "We can generate revenues of $125M per year by capturing only 5% market share in small law firm marketing and advertising."
Presentation choice: Sizes the spend it actually earns, not legal fees.
When it does not fit: A market share with no count of customers behind it.
Athennian deck, slide 5. Exact stored slide matched to this analysis.
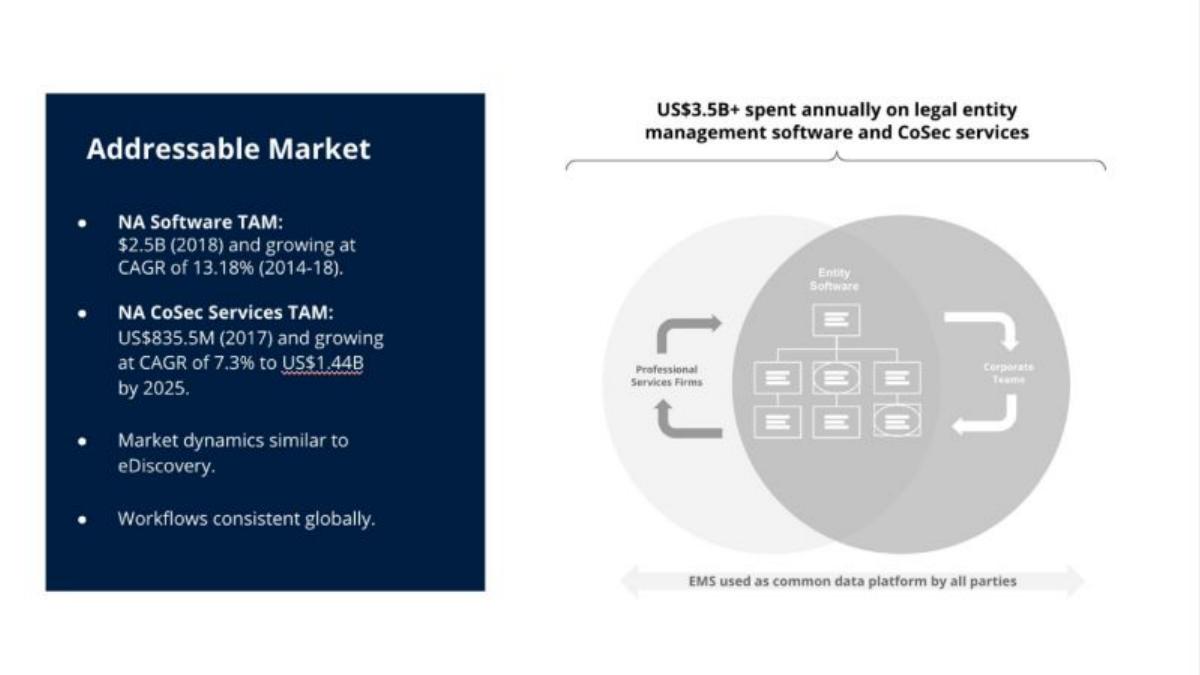
Our analysis: Software and service spend in one niche.
Evidence and limitation: Two named segments with years and growth rates. Our calculation: $2.5B + $0.84B is about $3.3B, using figures from different years; the diagram rounds to $3.5B+. The years don't match, and no customer count is shown.
What a founder can adapt: "[Region] [niche] software $[X] ([year]) + services $[Y] ([year])."
Supporting analysis
What the deck claims: "Addressable Market." "NA Software TAM: $2.5B (2018) and growing at CAGR of 13.18% (2014-18)." "NA CoSec Services TAM: US$835.5M (2017) and growing at CAGR of 7.3% to US$1.44B by 2025." "Market dynamics similar to eDiscovery." "Workflows consistent globally." Diagram: "US$3.5B+ spent annually on legal entity management software and CoSec services."
Presentation choice: Sizes the budget it replaces, not all legal spend.
When it does not fit: Adding figures from different years without saying so.
Della deck, slide 5. Exact stored slide matched to this analysis.
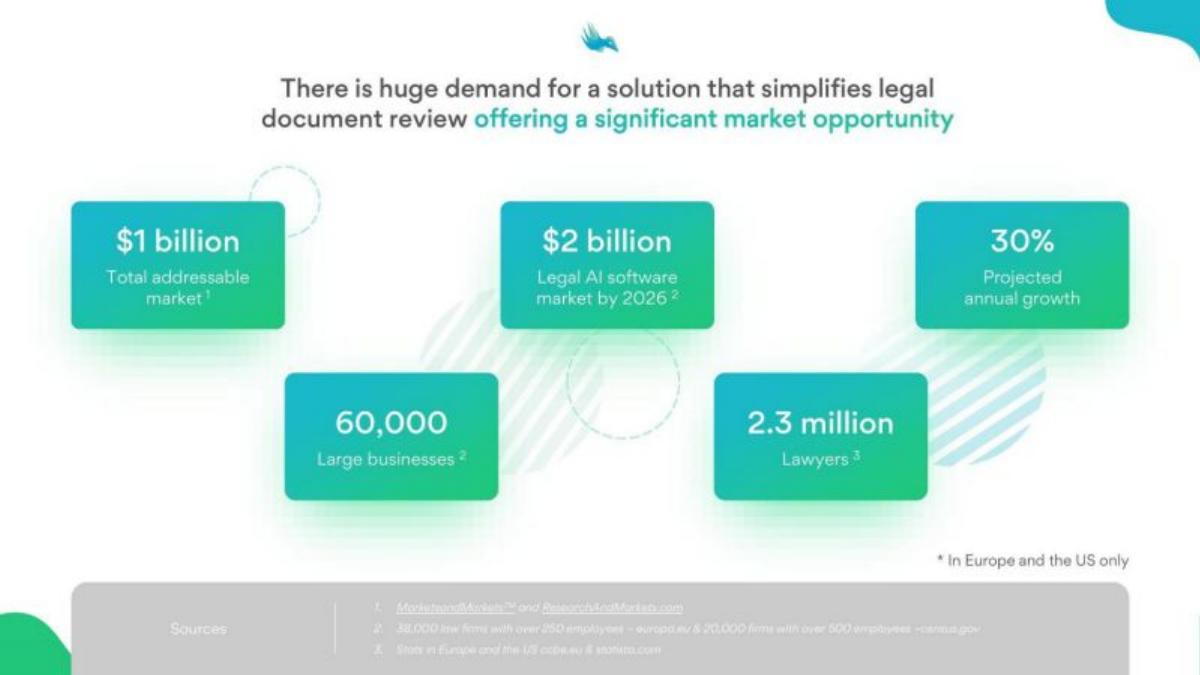
Our analysis: Sourced counts next to a top-down TAM.
Evidence and limitation: Counts with sources, a TAM and a forecast. Our calculation: 38,000 + 20,000 = 58,000, which the slide rounds to 60,000; the source note calls them law firms while the tile says large businesses. It doesn't show how $1B follows from the counts.
What a founder can adapt: "[N] firms × $[price] = $[X] (Europe + US)."
Supporting analysis
What the deck claims: "There is huge demand for a solution that simplifies legal document review offering a significant market opportunity." "$1 billion Total addressable market." "$2 billion Legal AI software market by 2026." "30% Projected annual growth." "60,000 Large businesses." "2.3 million Lawyers." "*In Europe and the US only." Sources: MarketsandMarkets and ResearchAndMarkets; "38,000 law firms with over 250 employees – europa.eu & 20,000 firms with over 500 employees – census.gov"; lawyer stats from ccbe.eu and statista.
Presentation choice: The counts are checkable; the link to $1B is missing.
When it does not fit: Labelling the same count two ways.
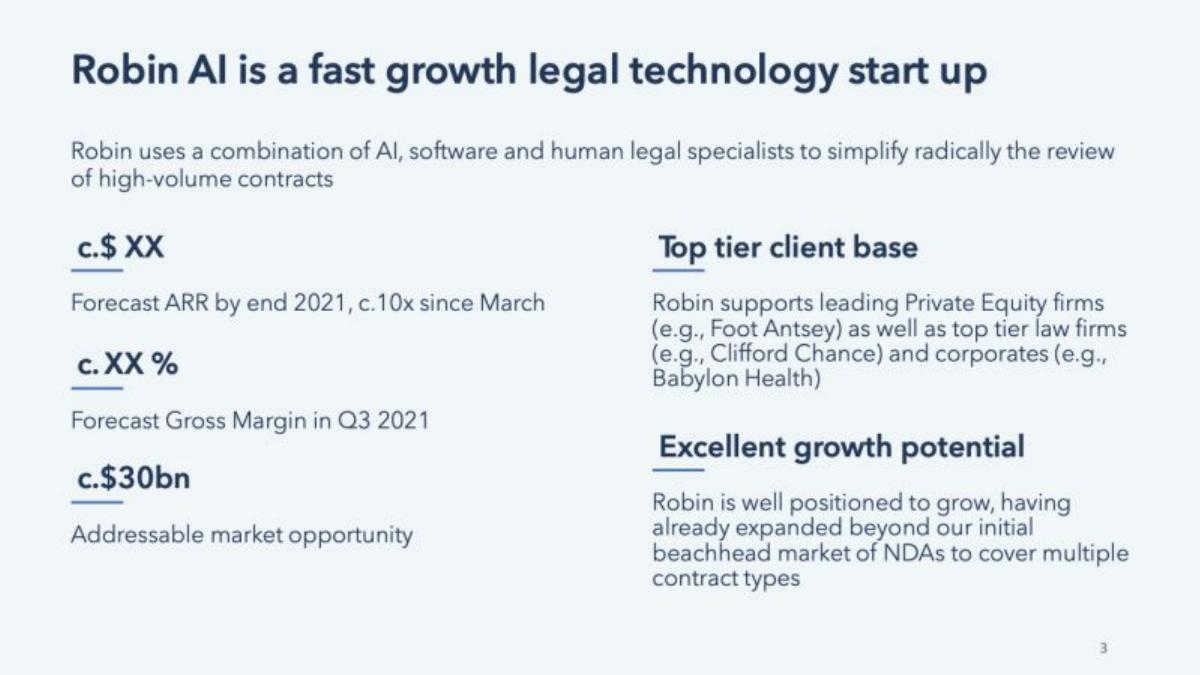
Robin AI deck, slide 3. Exact stored slide matched to this analysis.
Our analysis: Headline number with a beachhead.
Evidence and limitation: A headline figure and a named first market (NDAs), with clients. The $30bn has no source or build-up on this slide.
What a founder can adapt: "[N] [contract type] a year × $[price] = $[X]; start with [type]."
Supporting analysis
What the deck claims: "Robin AI is a fast growth legal technology start up." "c.$30bn Addressable market opportunity." "Excellent growth potential: Robin is well positioned to grow, having already expanded beyond our initial beachhead market of NDAs to cover multiple contract types." Clients named include Foot Anstey, Clifford Chance and Babylon Health. The ARR and gross-margin figures show as "c.$ XX" and "c.XX %" in this version.
Presentation choice: Names the first contract type; the number is unexplained.
When it does not fit: A headline with no build-up.
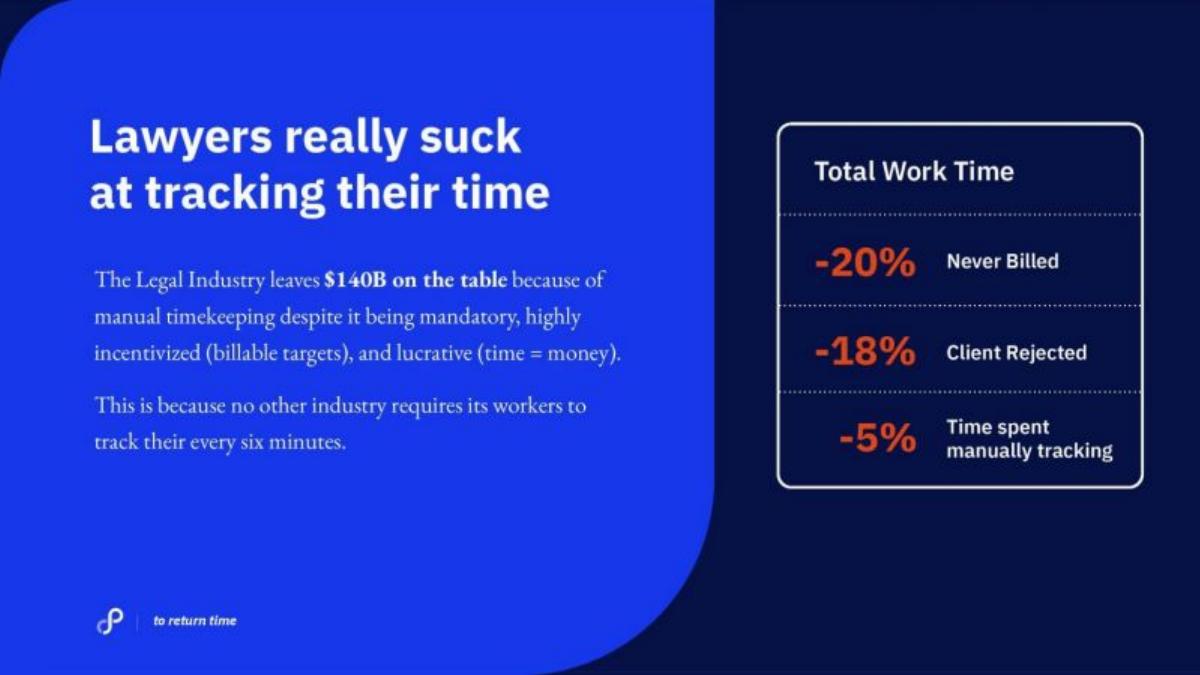
Time by Ping deck, slide 5. Exact stored slide matched to this analysis.
Our analysis: Problem cost as the headline.
Evidence and limitation: Weaker example. It sizes lost billable time, which is the problem, not what firms would pay for software. Our calculation: the three losses add to 43% of work time. No lawyer count or price is shown.
What a founder can adapt: "[N] lawyers × $[price] = $[X]; each recovers [h] billable hours."
Supporting analysis
What the deck claims: "Lawyers really suck at tracking their time." "The Legal Industry leaves $140B on the table because of manual timekeeping despite it being mandatory, highly incentivized (billable targets), and lucrative (time = money)." "Total Work Time: -20% Never Billed; -18% Client Rejected; -5% Time spent manually tracking."
Presentation choice: Makes the pain vivid; doesn't size the market.
When it does not fit: Presenting lost time as your market.
Before: "The Legal Industry leaves $140B on the table because of manual timekeeping."
After: "[N] US lawyers × $[price]/year = $[X]; first: firms with [size] in [state]."
What improved: Our illustrative rewrite of Time by Ping's slide; bracketed text is a placeholder, not company fact.
What's different about legal tech market sizing
Total legal services spending is very large, but most of it pays for lawyers' time, not software. Investors look for the slice a product can actually earn: software budgets, per-case fees, or a share of a specific task. Legal markets are also local, because rules and courts differ by state and country, so a first market matters.
What investors check
Whether the count (lawyers, firms, cases) matches how the company charges. Whether the slide separates the services total from the software or task spend. Whether the first state or country is named. Whether the figures add up.
How we read each slide
We quote the text on the slide images and mark our own arithmetic as ours. We have not checked any market figure or source. Page numbers are pages in the original deck file. Six images were already stored and were checked pixel-for-pixel against fresh renders of the decks; the Lawkick image was rendered from its deck file and added on 2026-09-26.
Common mistakes
Services total as the market. Most legal spend pays for lawyers' time.
Lost time as the market. Size what firms would pay you.
Mixed years. Say when figures come from different years.
No first market. Legal rules are local; name where you start.
Diagnostic checklist
One unit, matching how you charge.
Sourced count.
Price per unit.
First state or country.
Figures from matching years.
Frequently asked questions
How should a legal tech startup size its market?
Count the lawyers, firms or cases you serve, multiply by your price, and name where you start. Proof: 20 million cases × 2 people served × $70–200 per attempt.
Can I use total legal services spending as my TAM?
As context only. Show the software, task or services budget you replace, as Trellis does with legal research.
How we chose these examples
Corpus: published pitch deck teardowns on StartupFundraising.com. Founder-uploaded private decks are excluded.
Selection (2026-09-26): we searched teardown slide text for legal terms together with market-size wording, reviewed nine slides from the deck files and kept seven (Lawkick added in a later update the same day).
Excluded: DISCO p2 (already used in another guide), Akmazio Thrift p5 (counts lawyers among other professions, not a legal product), Lexyom p2 (a single lawyer count).
Page numbers are pages in the original deck files. Six images were already stored and were checked pixel-for-pixel against fresh renders on 2026-09-26; Lawkick p9 was rendered from its deck file and stored on 2026-09-26.
Market figures and sources are quoted from the slides and not independently verified. Calculations (products, ratios, sums) are ours and marked as such.
Review: slide images were checked on 2026-09-26 and matched to company, deck and page (editorial model review). No person has yet completed an editorial review of this page. We make no claim that any slide caused a fundraising outcome.