How to Show Integrations on a Pitch Deck (6 Real Slides)
How startups present the software their product connects to: integration growth over time, counts with build speed, named partner logos.
How to Show Integrations on a Pitch Deck
Six slides from real pitch decks that use integrations — the other software a product connects to — as evidence. For each, we record what the slide actually shows: a count over time, a total with a build-speed claim, a wall of named partners, an early count beside targets, or partners still in negotiation. We note which figures are measured, which are claims and which are plans.
TL;DR
An integrations slide answers two investor questions: how easily the product fits into what customers already use, and whether the ecosystem around it is growing. Real decks answer in five forms, from most to least checkable: a count over time (MindsDB: integrations from 15 in 2022-Q1 to 100+ in 2023-Q1, beside contributors from 100 to 433); a total with a build-speed claim (Coralogix: "Over 100 integrations" and new ones in "under 24H"); named partner logos (Veem: Oracle NetSuite, Xero, QuickBooks, Magento and Zapier, with a screenshot inside NetSuite); a total beside product breadth (Xentral: over 60 integrations and over 300 modules); and early counts with targets or partners in talks (Mailage: 5 integrations, targets of 12+ and 20+; Buffer: 6 integrations, "in talks with Reeder, Pocket and Feedly").
A raw count says little on its own. What makes it evidence is change over time (MindsDB), the names of partners customers recognise (Veem), and a link to the business argument — where customers come from or why they stay. Label targets and negotiations as such: Mailage's 12+ and 20+ are plans, and Buffer's three apps are conversations, not integrations.
Integration slides from real pitch decks
Each example shows the exact stored slide beside its analysis and links to the full teardown. Figures are the companies' own unless marked as our calculation. Stage and year are given only where the slide states them.
MindsDB product slide — slide 11
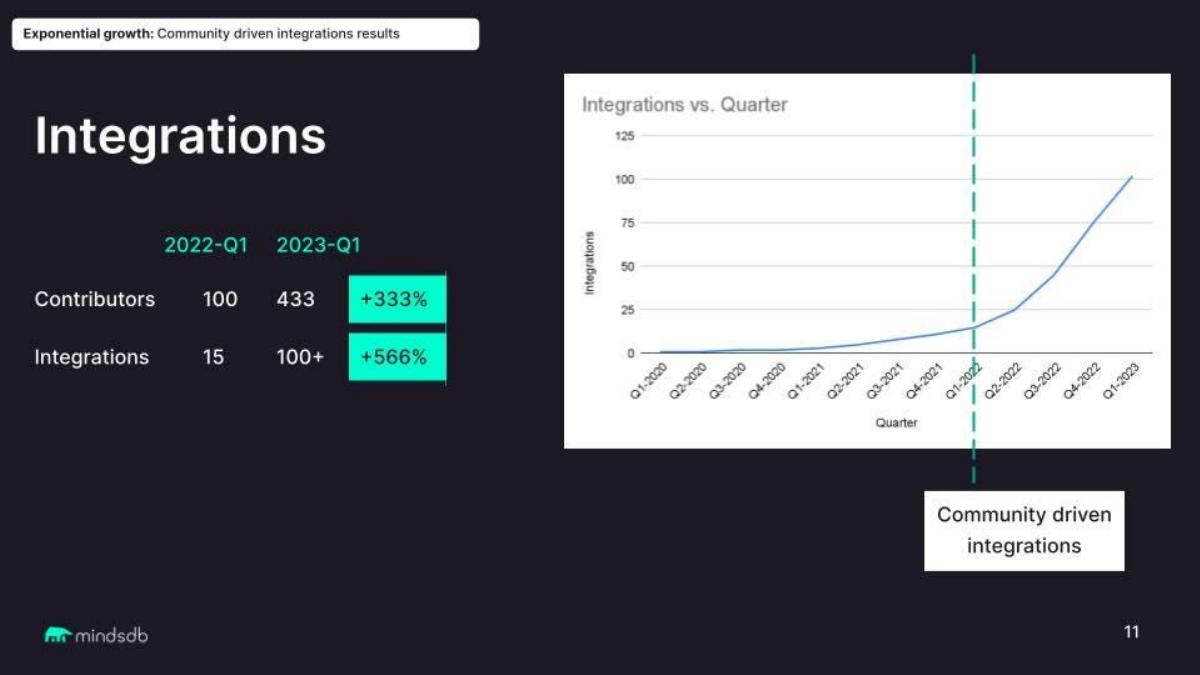
Open-source platform connecting AI models to databases. The slide is tagged "Exponential growth: Community driven integrations results"; footer page 11.
MindsDB deck, slide 11. Exact stored slide matched to this analysis.
Our analysis: The slide makes integrations a momentum metric and gives a cause: opening integration-building to the community. Pairing contributors with integrations makes the cause plausible, though the slide does not split integrations by who built them.
Evidence and limitation: Company-reported, dated and plotted. Our calculation: 15 to 100 is 6.7 times; contributors grew 4.3 times over the same period.
What a founder can adapt: Plot your integration count by quarter and mark what changed when growth accelerated.
Supporting analysis
What the deck claims: Title "Integrations". Table, 2022-Q1 vs 2023-Q1: Contributors 100 to 433 (+333%); Integrations 15 to 100+ (+566%). Chart "Integrations vs. Quarter", Q1-2020 to Q1-2023, y-axis 0 to 125, with a dashed vertical line at Q1-2022 labelled "Community driven integrations".
Presentation choice: It is the only slide here with a measured, dated integration series.
When it does not fit: Don't claim a driver of growth without a metric that moves with it.
Log analytics and observability software for engineering teams; footer page 6.
Coralogix deck, slide 6. Exact stored slide matched to this analysis.
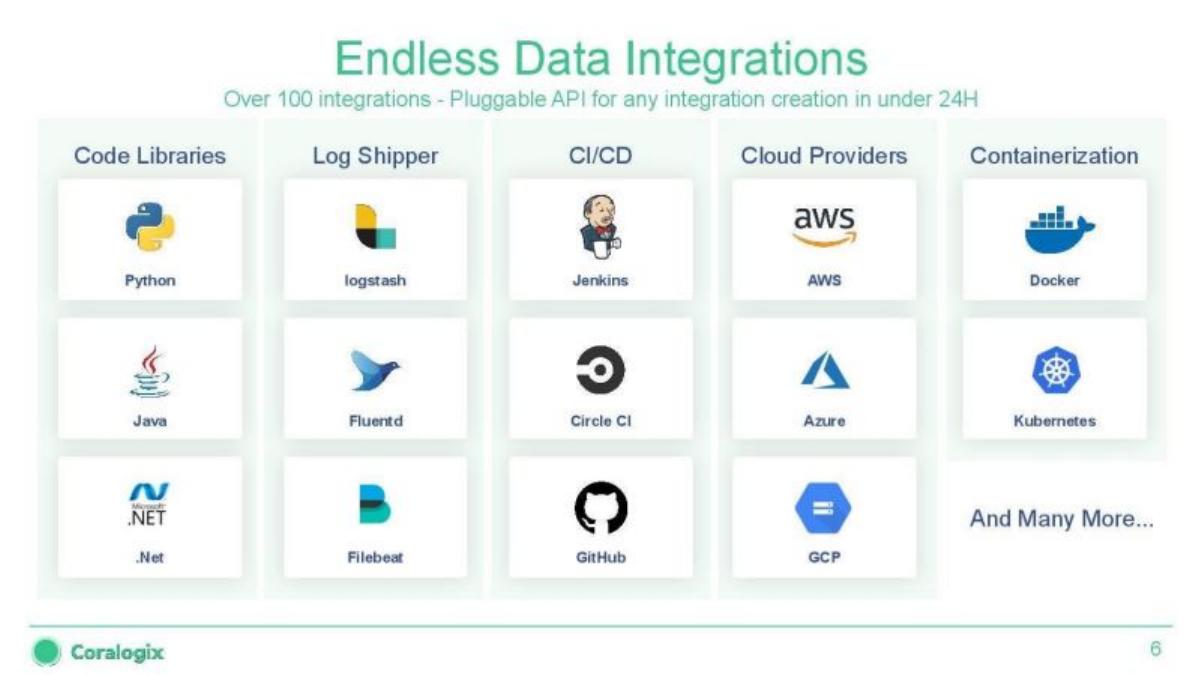
Our analysis: Grouping by category shows a developer buyer that each layer of their stack is covered, and the 24-hour claim answers the objection about missing tools. The total is undated and the build time is untested on the slide.
Evidence and limitation: Claimed total and build time; 14 named examples shown.
What a founder can adapt: Group integrations by the layer of the customer's stack and say how fast you add a missing one — with an example.
Supporting analysis
What the deck claims: Title "Endless Data Integrations"; subtitle "Over 100 integrations - Pluggable API for any integration creation in under 24H". Logos by category: Code Libraries (Python, Java, .Net), Log Shipper (logstash, Fluentd, Filebeat), CI/CD (Jenkins, Circle CI, GitHub), Cloud Providers (AWS, Azure, GCP), Containerization (Docker, Kubernetes), "And Many More...".
Presentation choice: It pairs breadth with a promise for gaps.
When it does not fit: Don't title a slide "endless" when you can give the count and date.
Business payments platform for small and mid-sized companies; footer page 10.
Veem deck, slide 10. Exact stored slide matched to this analysis.
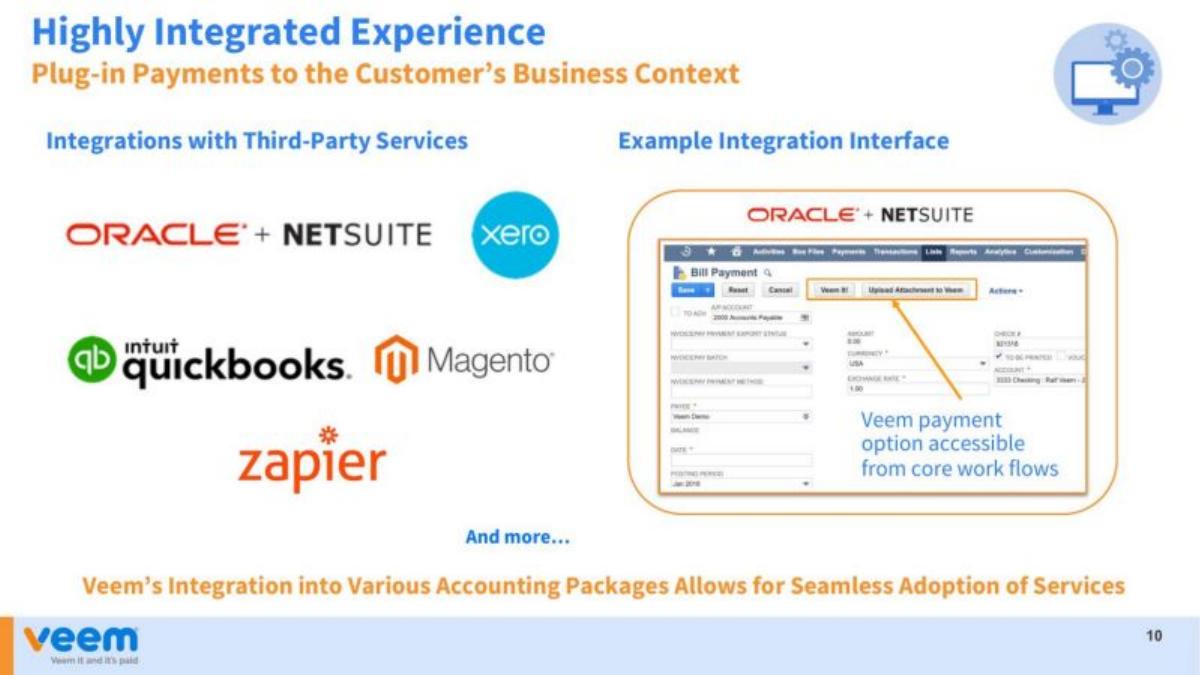
Our analysis: The screenshot is the strongest element: it shows the customer never leaves the accounting system to pay. The bottom line ties integrations to adoption, the business argument. A share of payments initiated through integrations would have turned it into traction.
Evidence and limitation: Named partners and a product screenshot; no count, usage or revenue share.
What a founder can adapt: Show one integration working inside the partner's screen and say what share of usage comes through it.
Supporting analysis
What the deck claims: Title "Highly Integrated Experience — Plug-in Payments to the Customer's Business Context". "Integrations with Third-Party Services": Oracle NetSuite, Xero, Intuit QuickBooks, Magento, Zapier, "And more...". "Example Integration Interface": a NetSuite bill-payment screen with "Veem It!" and "Upload Attachment to Veem" buttons, captioned "Veem payment option accessible from core work flows". Footer: "Veem's Integration into Various Accounting Packages Allows for Seamless Adoption of Services".
Presentation choice: It shows the integration in use, not just its logo.
When it does not fit: Don't stop at logos when you can show the workflow.
Operations software (ERP) for e-commerce businesses. The slide is titled "Fully Customizable to your needs".
Xentral deck, slide 7. Exact stored slide matched to this analysis.
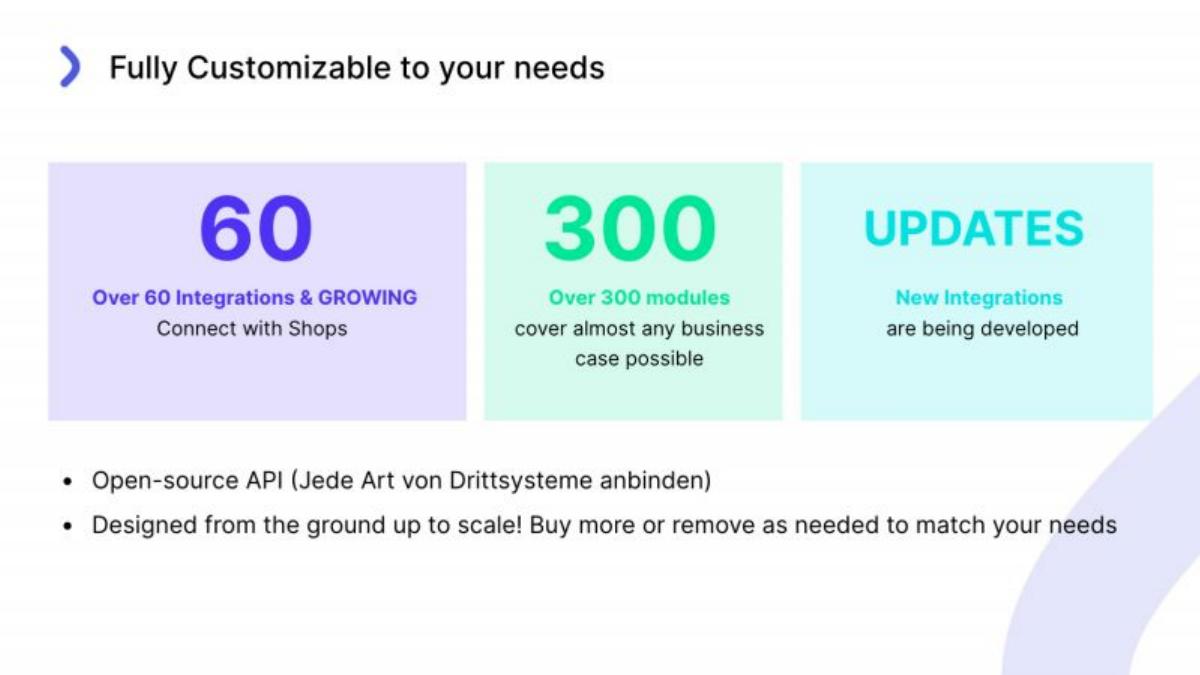
Our analysis: Integrations here support a modularity argument: connect to any shop, add modules as you grow. The large numbers do the work, but without a partner name a reader cannot tell which shop systems are covered.
Evidence and limitation: Claimed totals; no partner named and no date.
What a founder can adapt: Name the top shop platforms behind the count and date it.
Supporting analysis
What the deck claims: Three tiles: "60 — Over 60 Integrations & GROWING — Connect with Shops"; "300 — Over 300 modules cover almost any business case possible"; "UPDATES — New Integrations are being developed". Bullets: "Open-source API (Jede Art von Drittsysteme anbinden)" and "Designed from the ground up to scale! Buy more or remove as needed to match your needs".
Presentation choice: It shows integrations used to argue product breadth.
When it does not fit: Don't present a count with no named example.
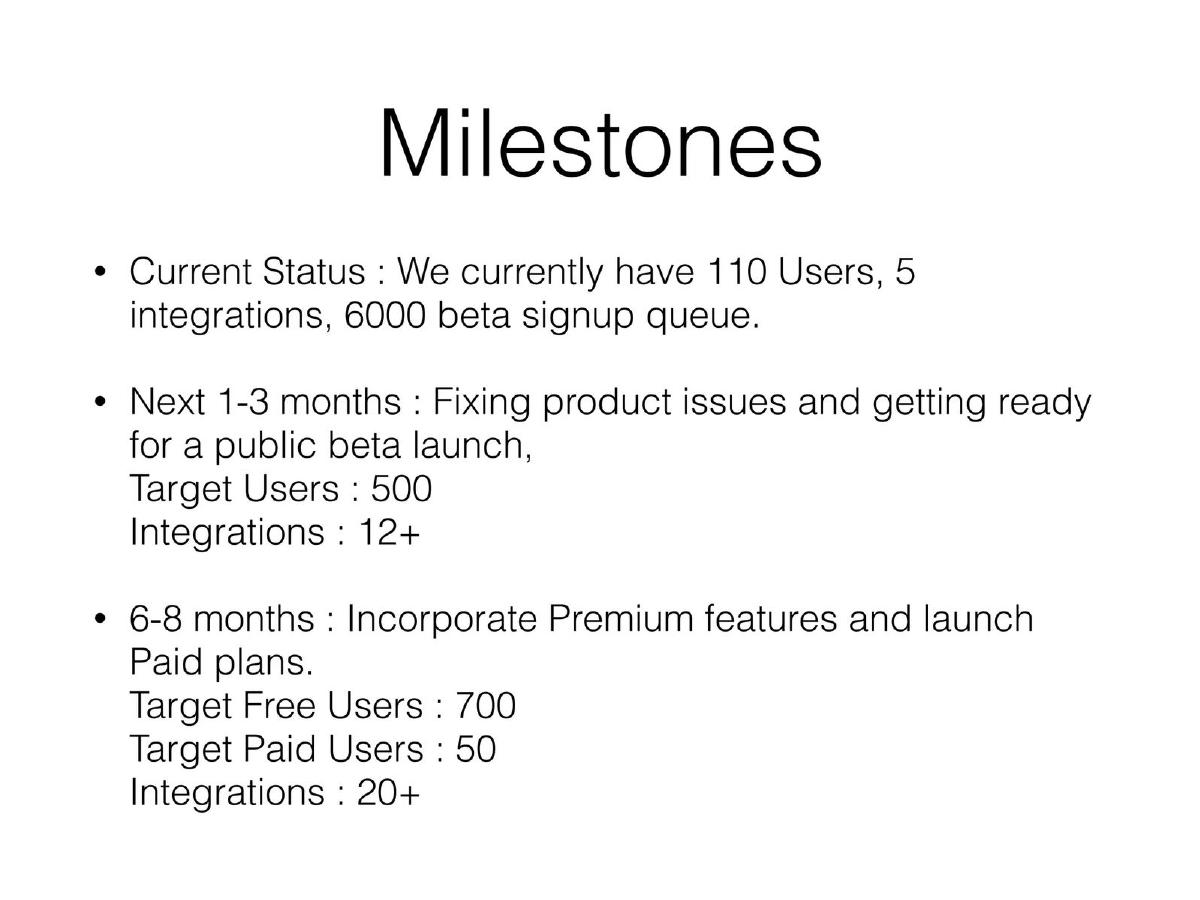
Early-stage team email product focused on integrations. A milestones slide.
Mailage deck, slide 10. Exact stored slide matched to this analysis.
Our analysis: The slide is candid about stage: five integrations now, more planned, tied to user and paid-plan targets. It shows the integration count as a roadmap metric rather than a boast — appropriate before launch.
Evidence and limitation: Current figures are company claims; 12+ and 20+ are targets.
What a founder can adapt: Give today's count, dated targets, and which integrations come first.
Supporting analysis
What the deck claims: "Current Status: We currently have 110 Users, 5 integrations, 6000 beta signup queue." "Next 1-3 months: Fixing product issues and getting ready for a public beta launch, Target Users: 500, Integrations: 12+." "6-8 months: Incorporate Premium features and launch Paid plans. Target Free Users: 700, Target Paid Users: 50, Integrations: 20+."
Presentation choice: It shows how to present integrations honestly at the earliest stage.
When it does not fit: Don't merge targets into the current count.
Social media scheduling tool. The slide is titled "A sharing standard". The page was read from the original deck file, but its stored image is blocked because the deck's page count is not yet verified in our records; no substitute is used.
Verified source excerpt — slide 10
"6 integrations so far"; "in talks with Reeder, Pocket and Feedly"; "We plan to become the default sharing standard in any app". A phone screenshot shows a share menu with Copy Link, Safari, Pocket, Twitter, Facebook, Buffer and Message.
The exact product image is not present in the stored slide-image set. No substitute is used.
Our analysis: Integrations here are a distribution strategy: every app that adds a Buffer share button sends users to Buffer. The slide separates live (6) from in-talks (3 named apps), which keeps it honest.
Evidence and limitation: Current count claimed; three partners in negotiation; the standard is a plan.
What a founder can adapt: If integrations bring you users, say how many sign-ups come through them, and name partners in talks as talks.
Supporting analysis
What the deck claims: "6 integrations so far"; "in talks with Reeder, Pocket and Feedly"; "We plan to become the default sharing standard in any app". A phone screenshot shows a share menu with Copy Link, Safari, Pocket, Twitter, Facebook, Buffer and Message.
Presentation choice: It shows integrations framed as a distribution channel, with negotiations labelled as such.
When it does not fit: Don't count partners in negotiation as integrations.
Columns report what each slide states; the last column notes what a reader can check.
Example
Type
Count
Over time
Partners named
What a reader can check
MindsDB
Measured
15 to 100+
Yes, quarterly
No
Growth and its stated driver
Coralogix
Claim
Over 100
No
14 logos
Stack coverage by category
Veem
Claim
None
No
5 logos + screenshot
The workflow in use
Xentral
Claim
Over 60
No
None
The total only
Mailage
Claim + plan
5; targets 12+, 20+
Targets
None
Stage and plan
Buffer
Claim + talks
6; 3 in talks
No
3 in talks
Live vs negotiating
Key Takeaways
Show the trend, not just the total. MindsDB's quarterly chart turns 100+ integrations into a growth story.
Explain what drives growth. MindsDB marks where community-built integrations began; contributors grew alongside.
Name partners customers know. Veem's NetSuite, Xero and QuickBooks logos tell a finance buyer more than a number.
Show the integration working. Veem adds a screenshot of its payment button inside NetSuite.
Separate live, planned and in-talks. Mailage lists targets beside its current 5; Buffer marks three apps as "in talks".
Tie integrations to the business case — distribution, adoption or retention — rather than presenting a count as the point.
Build your integrations slide
Answer each prompt in one line, with a number or a name where possible.
Count. How many live integrations do you have today, and what counts as one?
Trend. What was the count a year ago, and what changed the rate?
Top partners. Which integrations do the most customers use?
Business case. What share of sign-ups, usage or retention comes through integrations?
Pipeline. Which partners are in negotiation or planned, with dates?
Copyable framework: [n] live integrations (up from [m] a year ago), led by [top partners]; [x]% of [usage or sign-ups] comes through them; [partners] in talks, [k] more planned by [date].
Illustrative example 1 — written by us
Before: Over 60 Integrations & GROWING.
After: [n] live integrations as of [date] (up from [m]), led by [shop platforms]; [x]% of customers use at least one.
What improved: Illustrative template for Xentral's line; bracketed values are for the company to supply.
Why integrations count as evidence
For software sold into existing workflows, integrations decide how hard a product is to adopt. A buyer who must export data by hand, or wait for an engineering project, buys more slowly and leaves more easily. An investor reading a product slide therefore asks: does this plug into what customers already run, and is that list getting longer? Integrations can also be a distribution channel — a listing inside a larger platform's marketplace or share menu puts the product in front of that platform's users.
The weakness of the format is that counts are easy to inflate. One vendor's "integration" is a full two-way sync; another's is a webhook or a third-party connector. A slide that shows only a big number invites the question of what was counted. The slides below show how founders make the number mean something: by showing growth, naming partners, showing the integration in use, or being candid about what is still a plan.
Integrations sit naturally on the product slide, but they often support other arguments in the deck — Buffer's slide is really about becoming a distribution standard, and MindsDB's is about community momentum. Decide which argument the integrations serve and say it.
The five forms, most checkable first
A count over time (MindsDB) is the strongest. Its table shows integrations growing from 15 (2022-Q1) to 100+ (2023-Q1), labelled +566%, and contributors from 100 to 433, labelled +333%. A quarterly chart from Q1-2020 to Q1-2023 shows a flat line until a dashed marker labelled "Community driven integrations" at Q1-2022, after which the curve rises steeply. The figures are company-reported but dated and plotted, so a reader can see the inflection and its stated cause.
A total with a build-speed claim (Coralogix) answers the "what if you don't support my tool?" objection. The slide states "Over 100 integrations - Pluggable API for any integration creation in under 24H" and groups logos by category: code libraries (Python, Java, .Net), log shippers (logstash, Fluentd, Filebeat), CI/CD (Jenkins, Circle CI, GitHub), cloud providers (AWS, Azure, GCP) and containerization (Docker, Kubernetes), ending "And Many More...". The categories show coverage of the customer's stack; the 24-hour figure is a claim.
Named partner logos with proof of use (Veem) trade a number for recognition. Under "Integrations with Third-Party Services" Veem shows Oracle NetSuite, Xero, QuickBooks, Magento and Zapier, then an "Example Integration Interface" — a NetSuite bill-payment screen with a Veem button, captioned "Veem payment option accessible from core work flows". There is no count, but a finance buyer sees their own system.
A total beside product breadth (Xentral) presents integrations as part of a modular product: "Over 60 Integrations & GROWING — Connect with Shops", "Over 300 modules cover almost any business case possible", and "New Integrations are being developed", plus an open-source API. The claim is bold and unspecific: no partner is named.
Early counts with targets or negotiations (Mailage, Buffer) are honest about stage. Mailage's milestones slide lists current status — 110 users, 5 integrations, a 6,000-person beta signup queue — then targets of 12+ integrations in the next one to three months and 20+ in six to eight months. Buffer states "6 integrations so far", "in talks with Reeder, Pocket and Feedly", and the plan to "become the default sharing standard in any app", beside a phone screenshot of a share menu with Buffer among the options.
Measured, claimed or planned — label it
Of the six slides, only MindsDB's shows a measured series: dated counts and a plotted history. Coralogix, Veem and Xentral make claims about what exists now. Mailage mixes a current count with planned targets, and Buffer mixes a current count with partners under negotiation. Each is legitimate if labelled; the risk is a reader taking a target or a conversation for a live integration.
Our calculation on MindsDB: 15 to 100 is a 6.7-fold increase, consistent with the printed +566% (the slide's "100+" means the true figure may be higher). Contributors rising 4.3-fold over the same year supports the slide's claim that the community drove the growth, though the slide does not show how many integrations community members built.
Watch for three details a reader will check. First, the definition: say whether a listed integration is built and maintained by you, by the partner, or through a connector service such as Zapier, because investors discount the last kind. Second, usage: an integration nobody uses adds maintenance cost without adoption, so the share of active customers using at least one integration is more persuasive than the total. Third, dependency: if most customers arrive through one partner's marketplace, that partner's policy changes become a business risk worth naming. None of the six slides addresses all three; MindsDB comes closest on growth and Veem on usage in context.
For founders: if you track integrations, show the series and name the top partners by customer usage. If you are early, give the current count, name the partners you are negotiating with as negotiations, and set dated targets — as Mailage and Buffer do.
Common mistakes
A count without a definition. Say what counts as an integration.
A total without a trend. Show where the count was a year ago.
Logos without proof of use. Show one integration working or say how many use it.
Targets merged with live counts. Keep planned integrations separate.
Negotiations shown as partners. Label partners in talks as talks.
No business case. Tie integrations to adoption, distribution or retention.
Diagnostic checklist
The slide states how many integrations are live today.
The count is dated, and ideally shown over time.
The partners customers use most are named.
Planned and in-talks integrations are labelled separately.
The slide says what integrations do for the business.
Every figure is labelled as measured, claimed or planned.
Frequently asked questions
How do I show integrations on a pitch deck?
Give today's count with a date, show how it has grown, name the partners customers use most, and say what integrations do for adoption or distribution. MindsDB plots integrations by quarter; Veem names partners and shows its button inside NetSuite.
Is a large integration count enough?
No. Without a date, a definition or named partners, a count like Xentral's "over 60" cannot be checked. Add a trend or top partners.
Can I include partners I'm still negotiating with?
Yes, labelled as negotiations — Buffer lists "in talks with Reeder, Pocket and Feedly" separately from its 6 live integrations.
What should an early-stage startup show?
The current count and dated targets, as Mailage does (5 now, 12+ in one to three months, 20+ in six to eight months).
How do I show integrations drive growth?
Report the share of sign-ups or usage coming through them. None of the six slides here does; Buffer's distribution argument and Veem's adoption line would both be stronger with that figure.
How we chose these examples
Search (2026-10-01): the durable corpus index (70,729 unique pages, deduplicated by deck-file sha256 + page) was searched for counts of integrations (a number followed by integrations or native integrations). Listed-company, SPAC, mining, energy-utility and cannabis-producer investor-relations decks were excluded; all six companies used are private.
Six candidate pages were rendered from the original public deck files and read from the images; all six are used: MindsDB 11, Coralogix 6, Veem 10, Xentral 7, Mailage (without-notes deck) 10 and Buffer 10. Page numbers are PDF pages. Not used: Buffer's second deck (buffer-round, duplicate of the same slide), BrowserStack 8 (product list, no integration figure), Elioplus 12 and Gridle 10 (integrations as a roadmap item or user request only), Krepling 9 (unreadable text).
Buffer 10's stored image is blocked because the deck's page count is not verified in our records; the slide was read from the original PDF and no substitute image is used. Figures are as printed on each slide and have not been verified.
How we built this: drafted and checked with AI assistance (editorial model review against the original slide images); no human editor has reviewed this guide.