Bookings, ARR or Revenue on a Pitch Deck: Say Which One You
Bookings, ARR and revenue measure different things: what was signed, what recurs, and what was earned.
Bookings, ARR or Revenue? Say Which One You Are Showing and How It Is Counted
Business-software founders often have three growth numbers to choose from: bookings (what customers signed), annual recurring revenue or ARR (the yearly value of subscriptions in force) and revenue (what the accounts say was earned). They can differ a lot. A company that signs a three-year deal in December has large bookings, some ARR and almost no revenue that year. Investors know this, and they read a growth chart differently depending on which number it shows. This guide uses three real slides to show how to choose, label and connect these numbers so your traction slide reads the way you intend.
TL;DR
Name the measure in the chart title, define it in a footnote, and if you show more than one, show how they connect. Particle does this best: it places GAAP revenue beside '3CV bookings' and defines 3CV as three years of device shipments plus three years of service, the basis on which it pays sales reps. BusRight stacks bookings on top of ARR and adds '100% of bookings convert to ARR', which tells the reader the signed amount becomes recurring revenue, though it doesn't say when. Rippling titles its chart 'Total Bookings Annual Recurring Revenue (ARR)', which blends two measures into one label and leaves the reader unsure whether the bars show signed or live subscriptions. Lead with the measure closest to cash investors can rely on, and never let bookings stand in for revenue without saying so.
Three slides that show bookings next to another measure
Each slide is read at full size. Quotes are exact.
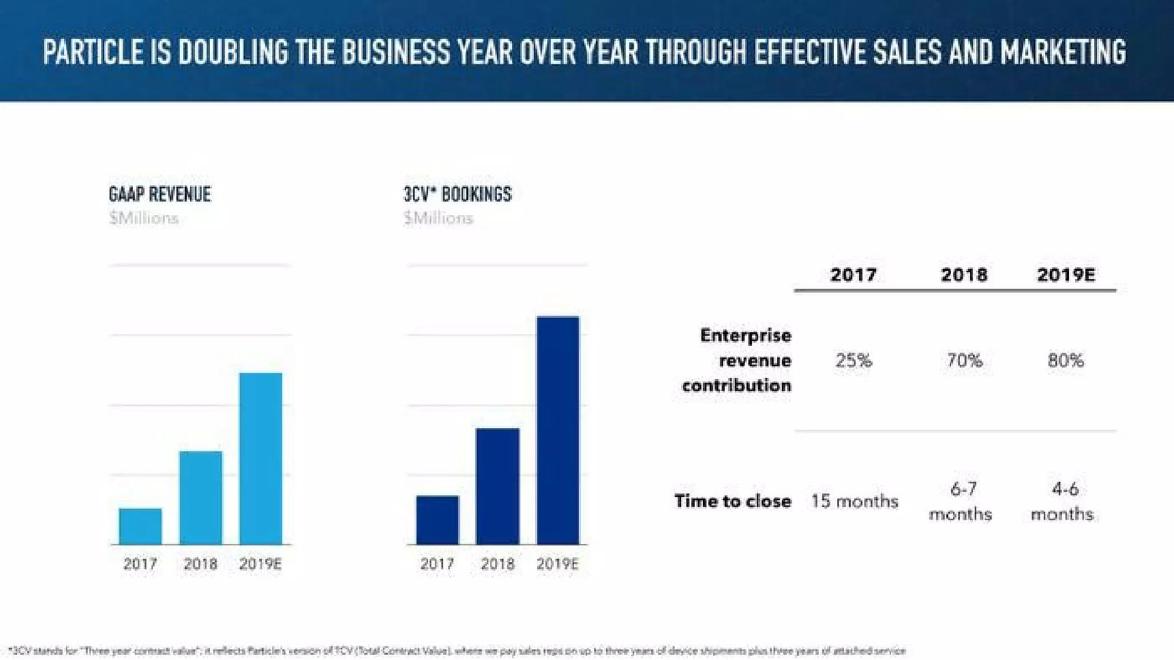
Particle traction slide — slide 13
IoT hardware and software. Two bar charts and a table.
Particle deck, slide 13. Exact stored slide matched to this analysis.
Our analysis: The clearest labelling: the reader knows what each chart counts and why bookings run ahead of revenue.
Evidence and limitation: Two named measures, one an accounting measure and one defined in a footnote. No values on the bars; 2019 estimated.
What a founder can adapt: Add values and visually mark estimated years.
Supporting analysis
What the deck claims: "GAAP revenue, $Millions" and "3CV* bookings, $Millions" for 2017, 2018, 2019E. "*3CV stands for 'Three year contract value'; it reflects Particle's version of TCV (Total Contract Value), where we pay sales reps on up to three years of device shipments plus three years of attached service." Enterprise revenue contribution 25%, 70%, 80%; time to close 15 months, 6-7 months, 4-6 months.
Presentation choice: Shows how to present a company-specific bookings measure honestly.
When it does not fit: Comparing multi-year bookings bars directly with annual revenue bars.
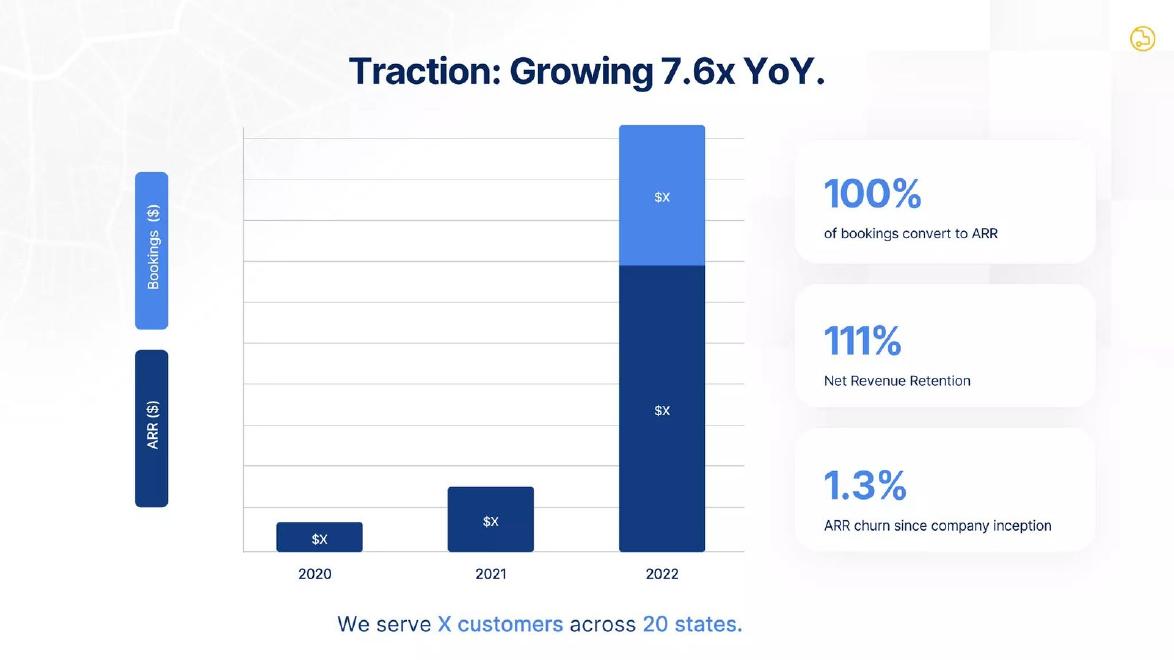
School transportation software. Stacked bookings and ARR chart with three tiles.
BusRight deck, slide 7. Exact stored slide matched to this analysis.
Our analysis: A good structure for a business with a long gap between signing and go-live, with key definitions missing.
Evidence and limitation: Signed-not-live contracts shown separately from live ARR; conversion claim. Growth multiple not tied to a measure; conversion timing not given.
What a founder can adapt: Say which measure the growth multiple uses and when bookings start.
Supporting analysis
What the deck claims: "Traction: Growing 7.6x YoY." Legend: "Bookings ($)", "ARR ($)"; values redacted. "100% of bookings convert to ARR". "111% Net Revenue Retention". "1.3% ARR churn since company inception".
Presentation choice: Shows how to make signed-but-not-live revenue visible.
When it does not fit: Letting readers take the full stacked bar as current recurring revenue.
HR, payroll and IT software. Monthly growth chart and product-split pie.
Rippling deck, slide 4. Exact stored slide matched to this analysis.
Our analysis: Good sourcing and caution, but the reader can't tell whether bars show signed or live subscriptions.
Evidence and limitation: One label combining bookings and ARR; no definition on the slide; source and review caveat given.
What a founder can adapt: Add a one-line definition under the chart.
Supporting analysis
What the deck claims: "Total Bookings Annual Recurring Revenue (ARR)"; top bar "Double Digit Millions". "Product Split for ARR": Benefits, IT, Payroll, Core HRIS, Reseller. "Source: Rippling Internal Data." "Note: Financial figures in this document are under review and subject to change."
Presentation choice: Shows the most common labelling mistake and an easy fix.
When it does not fit: Merging two measures into one title.
Measure named, defined, connected, values shown and estimates marked.
Example
Measures named
Definition given
Connection shown
Values shown
Estimates marked
Particle
GAAP revenue; 3CV bookings
Yes (footnote)
Side by side
No
Yes (letter only)
BusRight
Bookings; ARR
No
Yes (100% convert)
Redacted
Not applicable
Rippling
Bookings ARR (merged)
No (later slides only)
No
Order of magnitude only
Not applicable
Key Takeaways
Bookings are what was signed; ARR is what recurs now; revenue is what was earned.
Put the exact measure in the chart title, not just 'growth'.
Define any company-specific measure in a footnote.
If you show bookings and ARR or revenue together, show how one turns into the other.
Multi-year bookings can be several times annual revenue; say how many years they include.
Mark estimates and projections as such on the same chart.
Label your growth chart
Answer these before you finalise the traction slide.
Measure. Is the chart bookings, ARR or revenue? Which one does the headline growth figure use?
Definition. For bookings or ARR: how many years, are one-time fees in, are not-yet-live contracts in?
Connection. How long after signing does a booking become ARR, and what share have converted?
Status. Are the figures audited, accountant-prepared or internal? Which years are estimates?
Copyable framework: "[Measure] at [date/period], [definition]. [Growth figure] is [measure] growth from [period] to [period]. Bookings convert to ARR on average [N] months after signing; [X]% converted to date. Source: [internal/unaudited/audited]."
Illustrative example 1 — written by us
Before: "Traction: Growing 7.6x YoY."
After: "ARR grew [7.6x] from 2021 to 2022. Lighter bars: contracts signed, starting [month]. 100% of bookings to date have gone live."
What improved: Our illustrative rewrite of BusRight's headline. Bracketed details are not stated on the slide.
The question this guide answers
This guide answers one founder question: when I have bookings, ARR and revenue, which should I put on my traction slide, and how do I label them so investors read them correctly?
Our run-rate guide covers annualising a recent month. Our net revenue retention guide covers growth from existing customers. Our metric source line draft covers saying where any number comes from and how it was counted, and our currency labels draft covers units. None of them makes the choice between bookings, ARR and revenue its subject. The advice here is specific: what each measure proves, how they relate over time, and how to present more than one without confusing the reader.
The question matters most for subscription software, hardware sold with service contracts, and any business that signs contracts longer than a year or bills ahead of delivery.
How we chose and read the examples
We searched extracted slide text for slides that use 'bookings' alongside 'ARR' or 'revenue'. Many matches were travel or marketplace slides, where 'bookings' means reservations; our travel traction draft already covers gross bookings in that sense, so we excluded them. We also excluded listed companies and a SPAC presentation. We kept three startup slides that each present bookings next to another measure in a different way: Particle, BusRight and Rippling. All three companies were private when the decks were made.
Each slide was rendered from the source deck and read at full size. Particle's footnote is very small, so we enlarged it at 400 dpi before quoting. None of the three slides prints values on its main chart (BusRight and Rippling redact them; Particle shows bars without numbers), so we comment on structure and labelling, not on growth rates. We did not check any figure against company accounts.
Three examples are enough here because each shows one of the three common approaches: two measures side by side with a definition, two measures stacked with a conversion claim, and two measures merged into one label.
What each measure proves
Bookings are the value of contracts signed in a period. They show sales momentum: how much customers committed to. They don't show how much has been delivered or paid. A booking can include several years of value, one-time fees, or deals that start months later.
ARR is the annual value of recurring subscriptions in force at a point in time. It shows the size of the recurring business today. It excludes one-time fees and should exclude contracts that haven't started. It is a company-defined measure, not an accounting one, so definitions vary.
Revenue, especially revenue under accounting standards (GAAP in the US, IFRS elsewhere), is what the company earned in the period as it delivered the service. It is the most conservative and the most comparable across companies, and it is what auditors check.
The three can move very differently. Growth in bookings usually shows up in ARR when contracts start and in revenue over the following months or years. A fast-growing company typically has bookings ahead of ARR, and ARR ahead of trailing revenue. That is normal. What investors object to is not knowing which they are looking at.
Two measures side by side, with a definition: Particle
Particle, which makes connectivity hardware and software for internet-of-things devices, has a slide headed 'Particle is doubling the business year over year through effective sales and marketing'. Two bar charts sit side by side: 'GAAP revenue, $Millions' and '3CV* bookings, $Millions', each for 2017, 2018 and 2019E. A table beside them gives enterprise revenue contribution (25%, 70%, 80%) and time to close (15 months, 6-7 months, 4-6 months) for the same years. The footnote reads: '*3CV stands for "Three year contract value"; it reflects Particle's version of TCV (Total Contract Value), where we pay sales reps on up to three years of device shipments plus three years of attached service.'
This is the most complete labelling of the three. The revenue chart is named as GAAP revenue, so the reader knows it follows accounting rules. The bookings chart uses a company-specific measure, and the footnote says exactly what it includes and why the company uses it: it is the basis for sales compensation. Showing the two together lets the reader see that bookings are growing faster than revenue, which is what you would expect if larger multi-year enterprise deals are being signed, and the enterprise share row supports that reading.
Two things weaken it. The charts have no values or axis numbers, so the reader can see shape but not size, and can't check the 'doubling' in the headline. And 2019 is marked 'E' for estimate in both charts, which is honest, but the bars are drawn in the same colour as actuals; shading or outlining the estimated bar would make the difference visible at a glance. Because 3CV counts up to three years, a reader should expect bookings to be several times annual revenue and shouldn't compare the two bars directly.
Bookings stacked on ARR, with a conversion claim: BusRight
BusRight's traction slide is headed 'Traction: Growing 7.6x YoY.' A stacked bar chart covers 2020, 2021 and 2022. A legend labels the lighter segment 'Bookings ($)' and the darker one 'ARR ($)'; in 2020 and 2021 the bars are only ARR, while in 2022 a large bookings segment sits on top. All values are redacted as '$X'. Three tiles beside the chart read '100% of bookings convert to ARR', '111% Net Revenue Retention' and '1.3% ARR churn since company inception'. Below: 'We serve X customers across 20 states.'
Stacking bookings on top of ARR is a sensible way to show contracts that are signed but not yet live. For a company selling to school districts, where contracts often start at the next school year, there can be a long gap between signing and go-live. The stack makes that visible. The '100% of bookings convert to ARR' tile answers the obvious follow-up: do signed deals actually start? Saying all of them have is a strong claim.
The gaps are in definition and timing. The slide doesn't say whether the headline '7.6x' is growth in ARR, in bookings, or in the combined bar; those can be very different numbers. It doesn't say when the 2022 bookings will convert, or whether '100%' covers all historical bookings or only those that have reached their start date. And a reader might take the full stacked bar as the company's size, when only the darker part is recurring revenue today. A subtitle such as 'ARR at year-end; bookings signed, starting [month]' and a label on the 7.6x would remove each doubt.
The same company's projections slide later uses the same stack for 2023 and 2024 under the headline 'Projections: $X of CARR by 2024', where CARR (contracted ARR) seems to mean ARR plus signed bookings. Introducing a third term without defining it adds to the confusion; if you use CARR, define it the first time it appears.
Two measures in one label: Rippling
Rippling, which sells HR, payroll and IT software, has a slide headed 'Rippling is growing fast across a broad portfolio of products'. On the left, a monthly bar chart titled 'Total Bookings Annual Recurring Revenue (ARR)', with no axis values and the top bar marked 'Double Digit Millions'. On the right, a pie chart titled 'Product Split for ARR' with segments for Benefits, IT, Payroll, Core HRIS and Reseller. Notes at the bottom: 'Source: Rippling Internal Data.' and 'Note: Financial figures in this document are under review and subject to change.'
The chart title combines two measures. 'Bookings ARR' usually means the ARR value of contracts signed, whether or not they are live yet, which is closer to BusRight's full stacked bar than to its ARR segment. A reader can't tell from this slide which it is. Later slides in the same deck define net dollar retention using 'Total Bookings ARR (after expansion, contraction...)', which suggests the company tracks ARR on a signed basis, but the definition isn't on this slide where the main growth chart appears.
Where the slide does well is in sourcing and caution: it names internal data as the source and warns that figures are under review. That note is good practice for a deck shared before audited results exist. The product split also adds information most traction charts lack, showing that growth isn't coming from one product.
The fix is a one-line definition under the chart: 'Bookings ARR = annualised value of signed subscription contracts, including those not yet live, as of [date].' With that, a reader knows exactly how far ahead of revenue the chart may be.
Which measure to lead with
Lead with the measure an investor can rely on most for your situation. If you have audited or accountant-prepared revenue and it tells a good story, lead with it. Revenue is the hardest number to dispute.
If your business is subscription-based and revenue lags because contracts are new, lead with ARR, defined as live recurring contracts only, and give revenue alongside or in the appendix.
Use bookings as the lead only when the timing gap is large and explainable, as with school-year starts, long implementations or multi-year hardware contracts, and always show the recurring or earned figure next to it. Bookings alone invite the assumption that you are showing the biggest number available.
Whatever you lead with, keep the definition consistent across every slide. If ARR on the traction slide includes signed-not-live contracts, it must mean the same in your retention, unit-economics and projection slides.
How to label bookings, ARR and revenue
Put the measure in the chart title: 'ARR at quarter end' or 'GAAP revenue, calendar year' rather than 'Revenue growth'.
Define company-specific terms in a footnote, as Particle does with 3CV. Say how many years a booking includes, whether one-time fees are in it, and whether contracts not yet started are counted.
If you show two measures, connect them. A conversion line ('bookings become ARR on average X months after signing; 100% converted to date') or a short bridge (ARR at start, plus new, plus expansion, minus churn, equals ARR at end) shows you understand how they relate.
Label the growth claim. '7.6x YoY' should say '7.6x ARR growth, 2021 to 2022'. Different measures give different multiples.
Mark estimates visually, not only in the axis label. A hatched or outlined bar for 'E' years is clearer than a letter.
If figures are unaudited or under review, say so, as Rippling does.
What these examples can and cannot show
These three slides show how founders have labelled and combined bookings, ARR and revenue. Because none prints values on its main chart, they can't show how far apart the measures were for any of these companies, or whether the growth claims are accurate. We didn't check any figure against accounts.
Treat them as patterns of presentation. Particle's definition footnote and BusRight's conversion tile are both easy to copy; Rippling's merged label is the common mistake to avoid.
Common mistakes
Unnamed measure. 'Revenue growth' that is really bookings.
Merged labels. 'Bookings ARR' with no definition.
Unlabelled multiple. A growth figure not tied to a measure.
Multi-year bookings unexplained. Say how many years are included.
Inconsistent definitions. ARR must mean the same on every slide.
Diagnostic checklist
Measure named in the chart title.
Company-specific terms defined.
Growth figure tied to a measure and period.
Bookings-to-ARR conversion and timing stated.
Estimates visually marked.
Audit status noted.
Frequently asked questions
Is it wrong to show bookings instead of revenue?
No, if you label them and explain the timing. It becomes a problem only when the reader can't tell which one they are looking at.
Should ARR include signed contracts that haven't started?
Conventions vary. Many investors prefer ARR to mean live contracts only and a separate contracted figure for signed-not-live. Whatever you choose, define it.
How we chose these examples
Corpus: published pitch deck teardowns on StartupFundraising.com. Founder-uploaded private decks are excluded.
Selection (2026-10-01): we searched extracted slide text for slides using 'bookings' with 'ARR' or 'revenue', excluded travel and marketplace reservation bookings, listed companies and SPAC presentations, and kept three startup slides that each show a different way of presenting bookings beside another measure.
Review: the three slides were rendered from the source decks at full size on 2026-10-01 and read in full against company, deck and page number (editorial model review, with AI assistance in drafting; not human-reviewed). Particle's footnote was enlarged at 400 dpi. No figure was checked against company accounts.