How automotive and OEM-supplier startups should show design wins, proofs of concept and production programmes in a pitch deck: stage.
Design Wins in Your Pitch Deck: Show Investors When Car-Maker Revenue Actually Starts
If you sell a component, sensor or piece of software that goes inside someone else's vehicle or machine, your traction does not look like a software company's. A car maker can choose your product today and not build a single car with it for two or three years. Investors in this space ask one question of every logo on your traction slide: at what stage is this relationship, and when does it turn into per-unit revenue? This guide shows how five real slides from three startups answer, or skip, that question.
TL;DR
Put every customer relationship into one of four stages and say which: proof of concept (a prototype in a test car), paid development (engineering work the customer pays for), design win or nomination (the customer has chosen you for a named production programme), and start of production (vehicles with your part are being built). Then, for each design win, give the start-of-production (SOP) year, the estimated units over the programme's life and where that estimate comes from, and separate one-time engineering fees from the per-unit revenue that follows. Never count a proof of concept as a win.
Five real design-win and programme slides
Each slide below is shown as it appears in the company's original deck, with what it says, what we checked and what an investor still can't tell. Page numbers are positions in the stored deck file; where the printed page number differs, we say so.
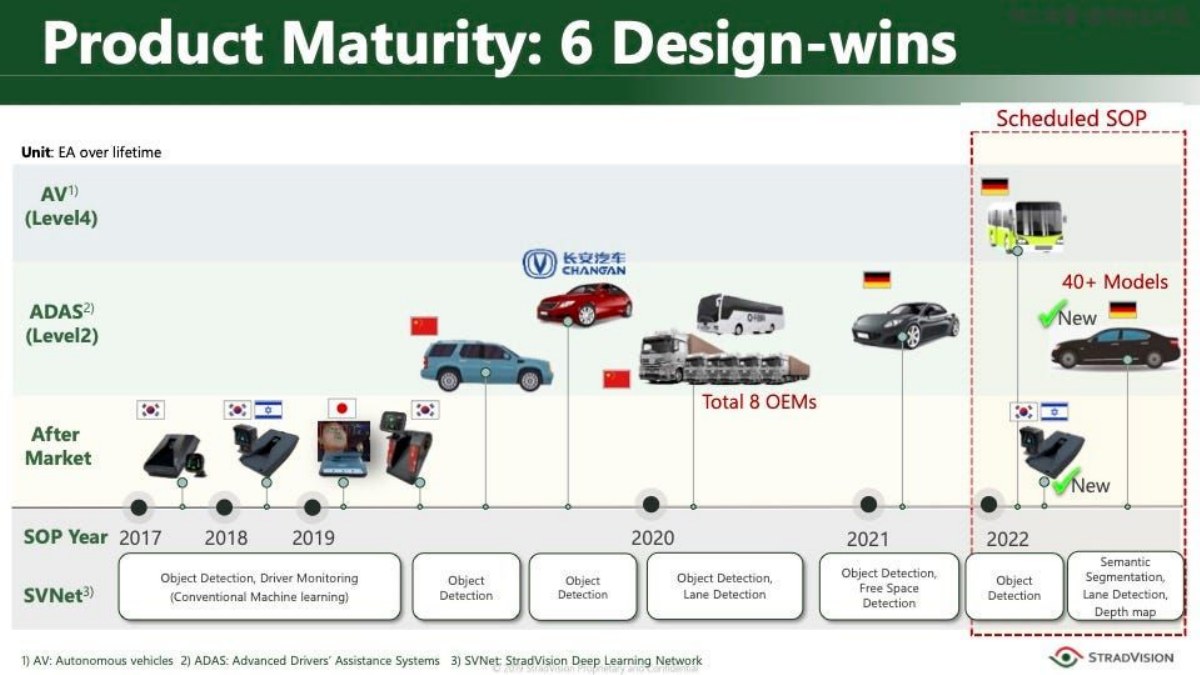
StradVision traction slide — slide 21
South Korean perception-software company (camera-based object detection for driver assistance and autonomous driving); page 21 of a 31-page deck dated 2019.
StradVision deck, slide 21. Exact stored slide matched to this analysis.
Our analysis: The strongest structure in the set: arranging wins by SOP year shows when production revenue begins, and boxing the scheduled programmes separates future from current production. What it lacks is the volume the unit label promises, and a clear definition of which markers are the six wins.
Evidence and limitation: Directly visible: SOP years, product level, the function supplied and which programmes are still scheduled. Our check: the slide states a unit ("EA over lifetime") but prints no unit counts for any win. The title says six design wins; the page shows more vehicle markers than six across aftermarket and ADAS, so which six count as design wins is not defined. One OEM is named; the rest are shown by flag.
What a founder can adapt: Print the lifetime units and their source beside each win, and number the wins so the count in the title can be checked.
Supporting analysis
What the deck claims: "Product Maturity: 6 Design-wins." "Unit: EA over lifetime." A timeline by "SOP Year" (2017–2022) and product level (AV Level 4, ADAS Level 2, After Market), with vehicles marked by country flag, one Changan logo, "Total 8 OEMs", "40+ Models" and two wins marked "New" inside a "Scheduled SOP" box for 2022. The bottom row lists the software function supplied in each period.
Presentation choice: It shows how to lay out design wins by start-of-production year, and what goes missing when lifetime volumes are left off.
When it does not fit: Don't state a unit on a chart and then show no figures in it.
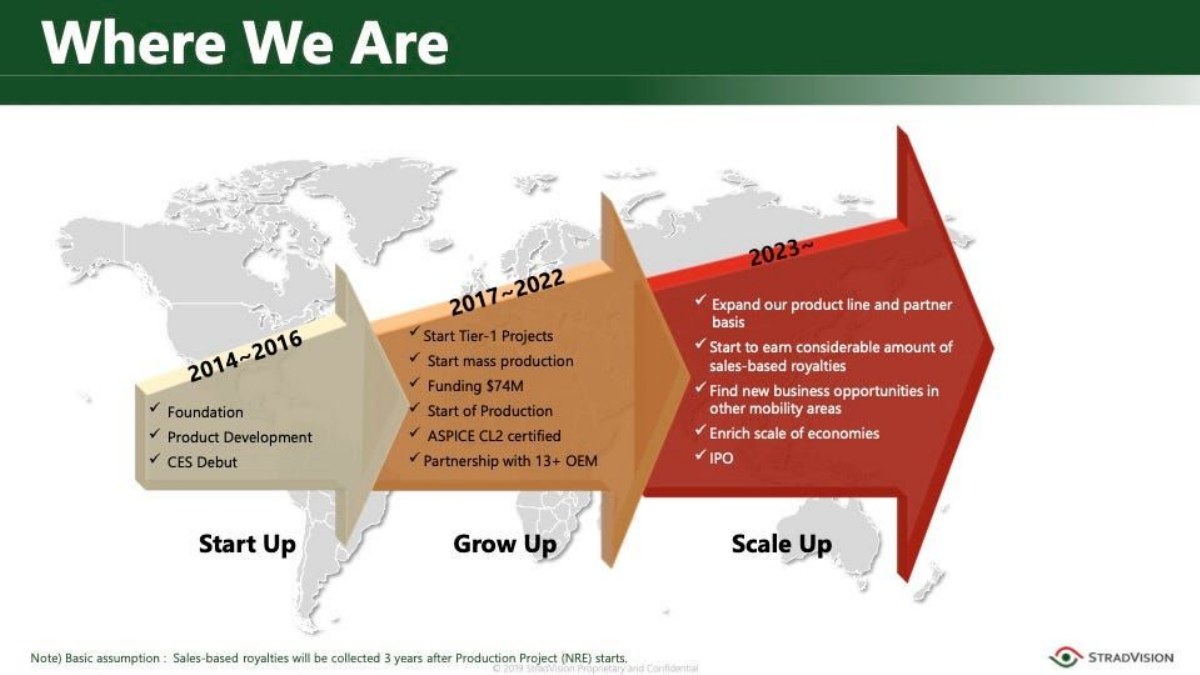
The same deck's "Where We Are" page, three pages after the design-win timeline.
StradVision deck, slide 24. Exact stored slide matched to this analysis.
Our analysis: The footnote is the most useful line on the page. It tells an investor how to convert a newly started production project into a royalty date, which is the timing assumption behind any supplier forecast. It would be stronger next to the design-win chart than three pages later.
Evidence and limitation: Directly visible: the company places significant royalty revenue after 2023, several years after its first SOPs, and states the three-year lag from development start to royalties as an assumption. Our check: the lag is consistent with the design-win page, where several programmes have SOP dates in 2020–2022. The page gives no revenue figures.
What a founder can adapt: Put the lag beside your forecast: "Royalties assumed from SOP, about 3 years after paid development starts."
Supporting analysis
What the deck claims: Three stages: 2014–2016 "Start Up" (foundation, product development, CES debut); 2017–2022 "Grow Up" ("Start Tier-1 Projects", "Start mass production", "Funding $74M", "Start of Production", "ASPICE CL2 certified", "Partnership with 13+ OEM"); 2023 onward "Scale Up" ("Start to earn considerable amount of sales-based royalties", IPO). Footnote: "Basic assumption: Sales-based royalties will be collected 3 years after Production Project (NRE) starts."
Presentation choice: It shows a founder stating the lag between development work and per-unit royalties as an explicit assumption.
When it does not fit: Don't let a stage diagram imply revenue timing without stating the assumption behind it.
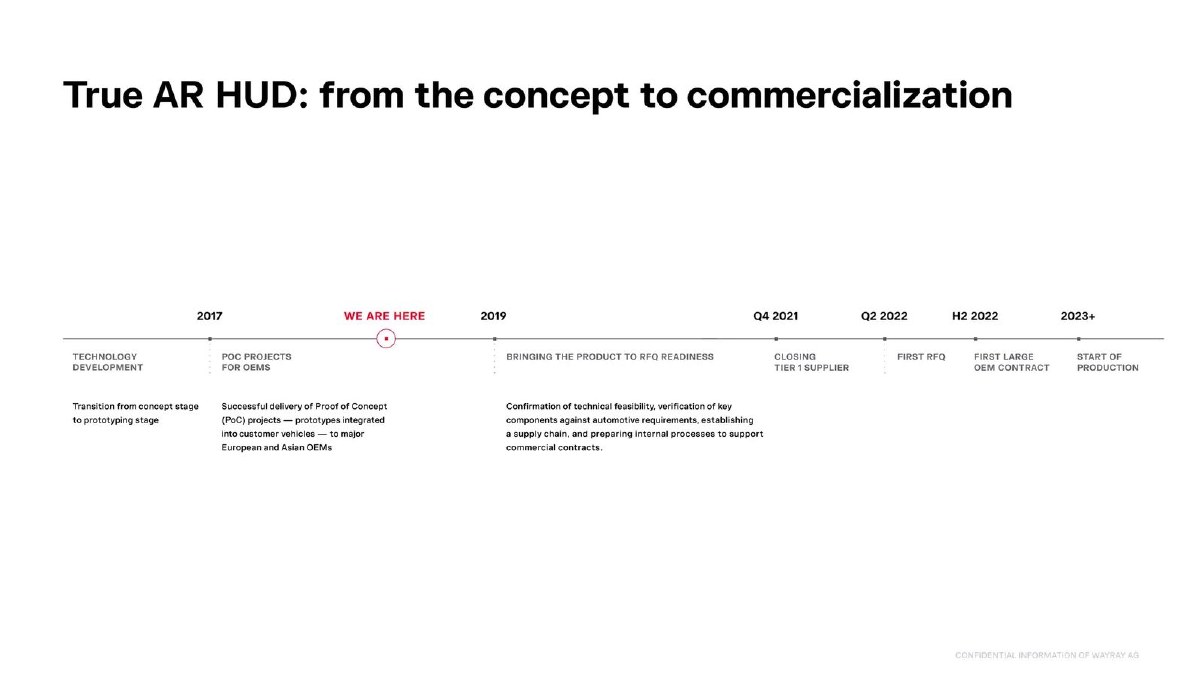
Swiss augmented-reality head-up display company (holographic displays projected on the windscreen); page 26 of a 75-page deck from its $80M round at a reported $500M valuation.
WayRay deck, slide 26. Exact stored slide matched to this analysis.
Our analysis: The most honest staging in the set. WayRay does not call its PoCs wins; it shows the steps still ahead, including choosing a Tier 1 partner and responding to the first request for quotation (RFQ). An investor can see that the round funds the path to a first nomination, not production revenue.
Evidence and limitation: Directly visible: every relationship is labelled as a PoC, the company marks its position before RFQ readiness, and the first large contract and SOP are placed years ahead. Our check: the timeline puts SOP roughly six years after the PoC stage. No count of PoCs, named customers or volumes appears on this page.
What a founder can adapt: Add the number of PoCs and, for each future milestone, what evidence will mark it done (for example, a signed nomination letter).
Supporting analysis
What the deck claims: "True AR HUD: from the concept to commercialization." A timeline: technology development; 2017 "PoC projects for OEMs" ("Successful delivery of Proof of Concept (PoC) projects — prototypes integrated into customer vehicles — to major European and Asian OEMs"); "We are here"; 2019 "Bringing the product to RFQ readiness"; Q4 2021 "Closing Tier 1 supplier"; Q2 2022 "First RFQ"; H2 2022 "First large OEM contract"; 2023+ "Start of production".
Presentation choice: It shows a startup placing itself precisely on the PoC-to-production path without overstating its stage.
When it does not fit: Don't present PoC deliveries as customers or wins.
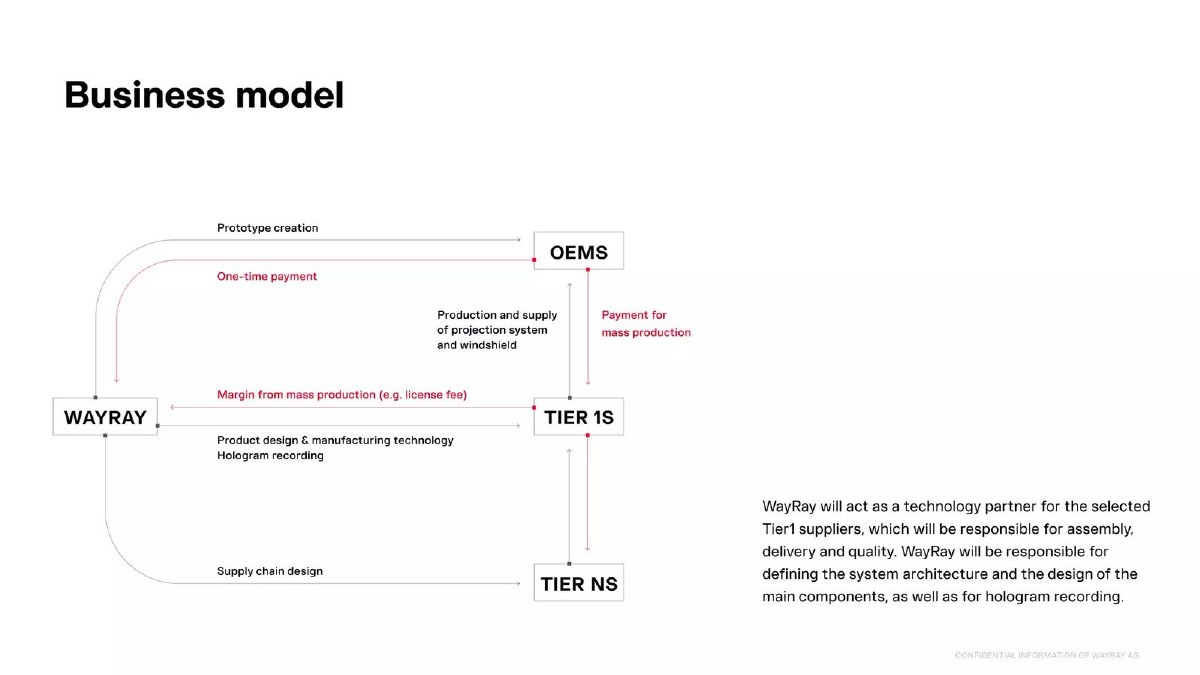
The same deck's business-model page, two pages after the timeline.
WayRay deck, slide 28. Exact stored slide matched to this analysis.
Our analysis: Separating the two money flows is exactly what supplier investors need, and naming who pays each one explains why a car-maker PoC is not yet revenue. The page would be stronger with the expected fee per vehicle, so the reader could link it to the timeline.
Evidence and limitation: Directly visible: one-time prototype revenue and per-unit production revenue are separate flows from different payers. Our check: production revenue comes through the Tier 1, not directly from the car maker, so its timing depends on the Tier 1 closing shown on the previous timeline. No prices, fee levels or revenue split appear.
What a founder can adapt: Add "[fee] per unit from SOP; prototype fees [range], one-time" to each arrow.
Supporting analysis
What the deck claims: "Business model." Flows between WayRay, OEMs, Tier 1s and Tier Ns: "Prototype creation" for OEMs paid by a "One-time payment"; Tier 1s pay WayRay a "Margin from mass production (e.g. license fee)" for product design and manufacturing technology; OEMs pay Tier 1s "for mass production". Text: "WayRay will act as a technology partner for the selected Tier1 suppliers, which will be responsible for assembly, delivery and quality."
Presentation choice: It shows how to separate one-time engineering revenue from per-unit production revenue, and who pays each.
When it does not fit: Don't report prototype and production revenue as one traction line.
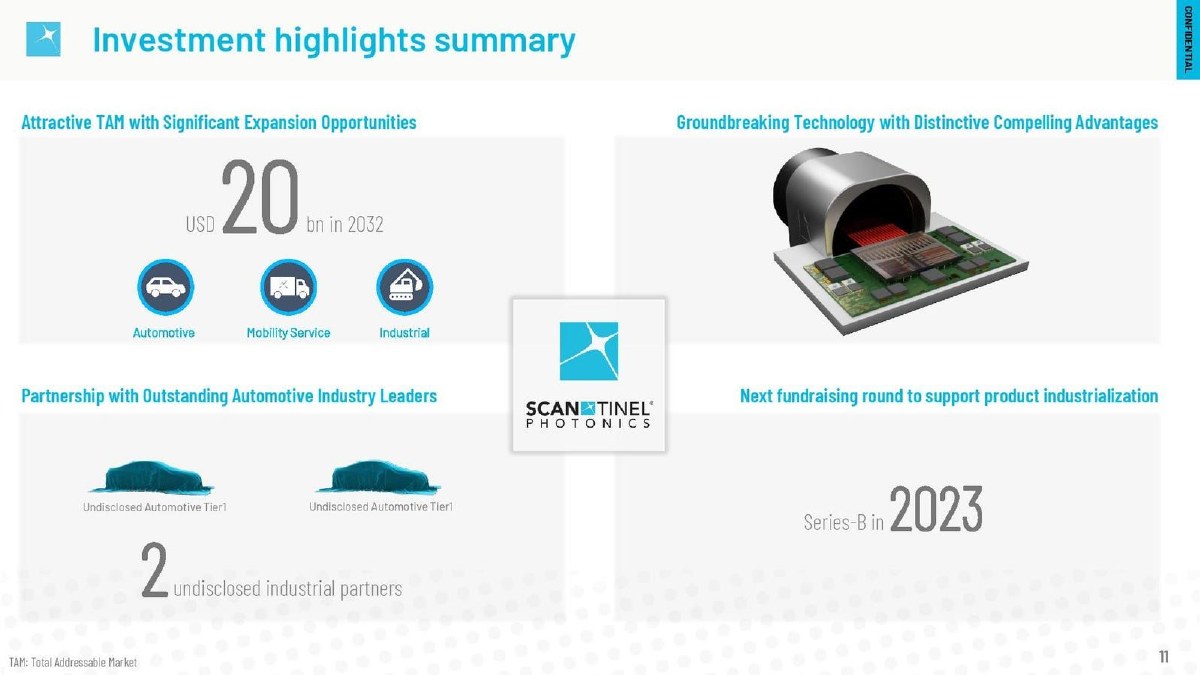
German lidar company (FMCW lidar sensors for vehicles and industry); page 8 of a 10-page public investor deck (printed page 11).
Scantinel Photonics deck, slide 8. Exact stored slide matched to this analysis.
Our analysis: A useful contrast. Keeping partners anonymous is common and acceptable, but the label "partnership" carries all the weight here. Two lines of staging ("paid sample development", "SOP target") would let the reader judge the relationships without naming anyone.
Evidence and limitation: Directly visible: two automotive Tier 1 partners and two industrial partners, all unnamed. Our check: the page gives no stage, programme, SOP date or volume for any partnership, so an investor cannot tell an evaluation from a nomination. The plan to raise again for "product industrialization" suggests production has not started.
What a founder can adapt: "Tier 1 #1: paid B-sample development, OEM programme SOP target [year]. Tier 1 #2: evaluation."
Supporting analysis
What the deck claims: "Investment highlights summary." "Attractive TAM with significant expansion opportunities: USD 20 bn in 2032." "Partnership with Outstanding Automotive Industry Leaders": two "Undisclosed Automotive Tier1" icons and "2 undisclosed industrial partners". "Next fundraising round to support product industrialization: Series-B in 2023."
Presentation choice: It shows how undisclosed partners read when no stage or timing is given.
When it does not fit: Don't let "partnership" stand in for a stage.
The four questions a design-win slide should answer, and which each slide covers.
Slide
Stage named
SOP timing
Lifetime volume and basis
One-time vs per-unit revenue
StradVision p21
"Design-wins"; count undefined
SOP year per win, 2017–2022
Unit stated, no figures
Not on this page
StradVision p24
Company stages
Royalties from 2023
Not shown
3-year NRE-to-royalty assumption
WayRay p26
PoC, clearly
SOP 2023+ (plan)
Not shown
Not on this page
WayRay p28
Not applicable
Not shown
Not shown
One-time vs production margin, by payer
Scantinel p8
"Partnership" only
Not shown
Not shown
Not shown
Key Takeaways
Name the stage of each relationship. A proof of concept, a nomination and a production programme are different levels of evidence.
Give the SOP year for every win. Revenue from a win usually starts at SOP, not at signing.
If you label a chart "units over lifetime", print the units. StradVision's slide states the unit but shows no volumes.
Say whose volume forecast you use: the car maker's, the Tier 1 supplier's, or your own.
Separate one-time engineering or prototype payments from per-unit production revenue, as WayRay's business-model page does.
An undisclosed partner can be honest, but give its stage and programme timing so investors can still judge it.
Build your design-win table
Fill in one row per customer relationship before you put a logo on a slide.
Stage. Is this a PoC, paid development, a nomination for a named programme, or in production? What document proves it?
Programme. Which vehicle or machine programme, and through which Tier 1 if any?
SOP. What is the start-of-production year, and who set it?
Volume. What are the estimated units over the programme's life, and whose forecast is it?
Revenue. What one-time fees have you received, and what per-unit price or licence fee applies from SOP?
Count. Does the number in your headline count only nominations and production programmes?
Copyable framework: [n] nominations (SOP [years]): [units] lifetime ([source] volumes), about $[x] per-unit revenue from [year]. Plus [n] paid development projects ($[fees], one-time) and [n] PoCs, not counted.
Illustrative example 1 — written by us
Before: Product Maturity: 6 Design-wins. Unit: EA over lifetime.
After: 6 design wins, SOP 2017–2022: [units] vehicles over programme life ([OEM/Tier 1] planning volumes); 2 scheduled for SOP 2022.
What improved: Built from StradVision's page 21. The SOP range and scheduled count are read from its chart; unit volumes and their source are placeholders the slide does not give.
Illustrative example 2 — written by us
Before: Partnership with Outstanding Automotive Industry Leaders: Undisclosed Automotive Tier1 (×2).
After: 2 automotive Tier 1 partners (names under NDA): [stage] for an OEM programme, SOP target [year]; [stage].
What improved: Built from Scantinel's page 8. Stages and dates are placeholders the slide does not give.
Why supplier traction needs stages
In the automotive supply chain a car maker (the OEM) usually buys systems from Tier 1 suppliers, who buy parts and software from Tier 2 suppliers and technology partners. A startup selling a sensor, a display or perception software often sits one or two steps away from the car maker, and its product has to pass validation before anyone commits to production. That is why years can separate the first meeting and the first royalty.
Because of that lag, a logo means little without its stage. Investors want to know how many relationships are still experiments, how many have been nominated for a specific vehicle programme, and how many are already shipping. Listed suppliers report their pipeline the same way: Mobileye, for example, describes design wins in terms of their "future projected volume" rather than as current revenue.
Proof of concept (PoC): a prototype integrated into a customer's test vehicle. It proves the technology works in their environment and that an engineering team is interested. It does not prove anyone will pay for production. WayRay's timeline calls its 2017 work "PoC projects for OEMs" and puts "first large OEM contract" four years later. That is honest staging.
Paid development: the customer pays engineering or prototype fees (often called NRE, non-recurring engineering). This shows budget commitment, and it brings in cash, but it is one-time revenue.
Design win or nomination: the customer has chosen your product for a named production programme with an expected SOP date. This is the stage investors weight most, because the product will normally stay in that vehicle model for its production life. WayRay's deck makes this point on its own page: once a design is in a vehicle model, it carries through that model's updates.
Start of production: vehicles with your part are being built and per-unit revenue (a price per part, or a licence fee per vehicle) begins. Only at this stage do lifetime volume estimates start turning into reported revenue.
SOP year and lifetime volume: the two numbers investors need
For each design win, the SOP year tells the investor when revenue begins; the estimated lifetime volume (units over the years the vehicle model is produced) tells them how much. Together with your price per unit, they give a revenue curve you can defend.
State the basis of the volume. A car maker's planning volume, a Tier 1's estimate and your own assumption are not equally reliable, and programme volumes often come in below plan. Mobileye's own 2024 results show how far shipments can move away from plan: revenue fell 48% year on year in one quarter because its Tier 1 customers drew down inventory. A wide-ranging design-win pipeline did not prevent that swing.
StradVision's design-win slide gets the structure right: SOP years run along the bottom, each win is placed by product level and year, and the unit is stated as "EA over lifetime". But no unit figures appear for any of the wins in the deck page we reviewed. The label promises the number investors need most and the slide does not deliver it. (Mobileye Global Inc. (via SEC EDGAR, Exhibit 99.1))
Engineering fees versus per-unit revenue
Many supplier startups earn two kinds of money from the same customer: one-time payments for prototypes and integration work, then per-unit revenue once production starts. Mixing them in one revenue line hides the real business. A year of strong engineering fees can look like traction while production revenue is still years away.
WayRay's business-model page draws the two flows separately: a "one-time payment" from car makers for prototype creation, and a "margin from mass production (e.g. license fee)" paid through Tier 1 suppliers. StradVision states the timing assumption in a footnote on its "Where We Are" page: "Sales-based royalties will be collected 3 years after Production Project (NRE) starts." Both make the lag visible. Neither says what share of current revenue comes from each flow on these pages.
When the partner can't be named
Automotive customers often forbid suppliers from naming them before launch. That is normal, and investors know it. What weakens a slide is not the missing name but the missing stage. Scantinel's highlights page shows two "Undisclosed Automotive Tier1" partners and "2 undisclosed industrial partners", with no indication of whether these are evaluations, paid development or nominations.
If you can't name the partner, describe it instead: "Top-10 global Tier 1, paid B-sample development for a European OEM programme, SOP target 2026." Investors can verify the details in diligence under NDA, and the slide still tells them what stage you have reached.
Worked example: one pipeline, shown both ways (hypothetical)
This is our illustration, not a figure from any deck. A camera-software startup has nine car-maker relationships: five PoCs, two paid development projects and two nominations. One nomination has a 2027 SOP with a car maker's planning volume of 600,000 vehicles over five years; the other has a 2028 SOP with the Tier 1's estimate of 250,000. Its licence fee is $4 per vehicle.
Weak version: "9 OEM partners, 850,000+ vehicles." It mixes stages, implies all nine are customers and gives no timing. Strong version: "2 production nominations (SOP 2027, 2028): 850,000 vehicles lifetime (OEM and Tier 1 planning volumes), about $3.4M licence revenue at $4/vehicle from 2027. Plus 2 paid development projects and 5 PoCs not counted."
The calculation is 850,000 × $4 = $3.4M, spread over the programmes' production years. The strong version is smaller and more credible. It tells the investor exactly how much of the pipeline is committed and when the money arrives.
Common mistakes
Counting PoCs as wins. A prototype in a test car is not a production commitment. Label it as a PoC.
No SOP date. Without a start-of-production year, investors can't tell when revenue begins.
Volumes without a source. Say whether a lifetime volume is the car maker's, the Tier 1's or your own estimate.
Unit label, no numbers. If the chart says "units over lifetime", show the units.
Engineering fees as traction. One-time development payments are real cash but not recurring revenue. Show them separately.
"Partnership" with no stage. Anonymous partners are fine; unstaged ones are hard to judge.
Diagnostic checklist
Every relationship is labelled PoC, paid development, nomination or production.
The headline count includes only nominations and production programmes, or says what it counts.
Each nomination shows an SOP year.
Each nomination shows lifetime units and whose forecast they are.
One-time fees and per-unit revenue are shown separately.
The lag from development start to per-unit revenue is stated.
Unnamed partners still show stage and timing.
Frequently asked questions
What is a design win?
A design win (or nomination) means a car maker or its Tier 1 supplier has chosen your product for a specific production programme. Revenue usually starts at that programme's start of production, often years later, and depends on how many vehicles are built. (Mobileye Global Inc. (via SEC EDGAR, Exhibit 99.1))
Should I count proofs of concept on my traction slide?
Yes, but label them as proofs of concept and keep them out of your win count. They show engineering interest, not a production commitment. WayRay's deck is a good model: it calls its car-maker work PoC projects and shows the steps still ahead.
How do I show lifetime volume if the car maker's forecast is confidential?
Give a range or a total across programmes and say whose estimate it is (car maker, Tier 1 or your own). Investors will check the details under NDA in diligence; the slide needs the order of magnitude and the basis.
Why does my revenue lag my design wins?
Per-unit revenue normally begins at start of production, after validation and tooling. StradVision's deck states its own assumption: royalties start about three years after a production project begins. Put your equivalent assumption on the slide.
How we chose these examples
Discovery (2026-10-04, runs 50-52): reading WayRay's 75-page deck end to end surfaced the PoC-to-production question; an authorized outside search for automotive-supplier decks found StradVision and Scantinel already in our collection. Closest existing content: drafts/mobilityBusinessModel.ts (StradVision's per-vehicle licence economics), the paid-pilots guide and drafts/executiveSummaryPilotToForecast.ts (pilot-to-contract in general), drafts/productHardwareMilestones.ts (engineering milestones) and the hardware go-to-market guide (channels). None teaches staging an OEM pipeline with SOP timing and lifetime volume basis.
Five pages were read from images rendered from the original deck files: StradVision 21 and 24, WayRay 26 and 28, Scantinel 8 (printed page 11). All images were prepared at 1200px wide. Counts and timing gaps were read from the slides; where a slide does not define a term or give a figure, we say so rather than estimate. The worked example is hypothetical. Company figures are reported as stated in each deck and not verified. This guide explains presentation, not legal, contract or investment advice. Slide readings and analysis are an AI editorial model review, not human-checked.