Mobility Startup Traction Slide Examples: 7 Real Pitch
How car, ride-hailing, bike and vehicle startups show traction: revenue, churn, deliveries, downloads, retention and pre-launch progress.
Mobility Traction Slide: Show Real Usage, Label Targets and Make the Numbers Add Up
Mobility startups need cars, bikes, drivers or vehicles before they earn anything, so investors look closely at what a traction slide actually proves. They want to know whether people use the service again, what each customer costs and earns, and whether the numbers are real results or plans. This guide uses six traction slides from mobility startups, from a bike subscription company that gives churn and cost per customer to a ride-hailing pitch whose figures never say whether they have happened yet.
TL;DR
Show results that have already happened, say over what period, and check that the figures agree with each other. One Mobility gives monthly revenue of €6,904.32, churn of 1.3% and a cost of €67.19 to win each customer, though its 12-month income of €41,595.38 is about half what that monthly revenue implies. Orto lists its first £9,000 of revenue and approval from the UK's Financial Conduct Authority. UberCab's early deck shows that a pre-launch company can still list concrete progress: 5 advisors, 15 clients and a demo date. Vruum gives 50,000+ downloads and 42% 30-day retention but never says whether these are results or targets, and Scoutr titles a slide "Traction" but shows only market size.
Six mobility traction slides
Strongest first, warning examples last. Each example quotes the slide and notes what an investor can and cannot learn from it.
One Mobility traction slide — slide 10
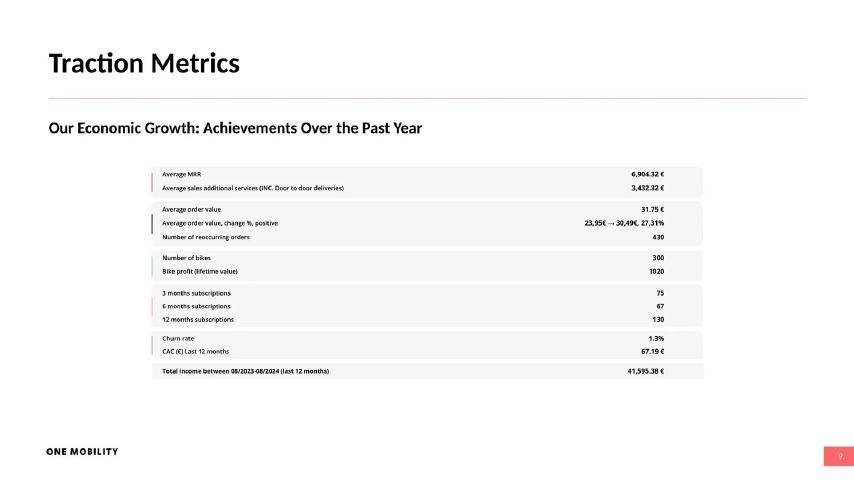
Subscription service for children's bikes. Slide titled "Traction Metrics: Our Economic Growth: Achievements Over the Past Year".
One Mobility deck, slide 10. Exact stored slide matched to this analysis.
Our analysis: Repeat use, cost per customer and order value in one table; the yearly income is about half what the monthly revenue implies.
Evidence and limitation: Company figures for the past year.
What a founder can adapt: Explain how monthly revenue and yearly income relate, and add a currency to the bike profit figure.
Supporting analysis
What the deck claims: Average MRR 6,904.32 €; average sales of additional services 3,432.32 €; average order value 31.75 € ("23,95€ → 30,49€, 27,31%"); number of reoccurring orders 430; number of bikes 300; bike profit (lifetime value) 1020; 3, 6 and 12 month subscriptions 75, 67 and 130; churn rate 1.3%; CAC (€) last 12 months 67.19 €; total income for the last 12 months 41,595.38 €.
Presentation choice: It answers the repeat-use and unit-economics questions at once.
When it does not fit: Figures that contradict each other with no note.
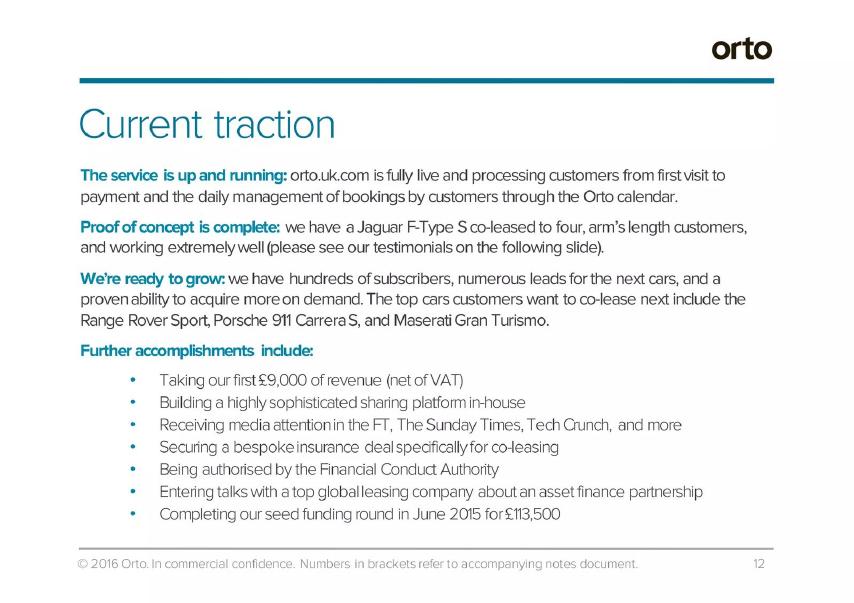
Car co-leasing service in the UK. Slide titled "Current traction" (2016).
Orto deck, slide 12. Exact stored slide matched to this analysis.
Our analysis: Small but real revenue, one working car, and regulatory approval that a competitor would also need.
Evidence and limitation: Company statements.
What a founder can adapt: Replace "hundreds of subscribers" with a number and say how many became paying customers.
Supporting analysis
What the deck claims: "The service is up and running"; "Proof of concept is complete: we have a Jaguar F-Type S co-leased to four, arm's length customers". "We're ready to grow: we have hundreds of subscribers, numerous leads for the next cars". Accomplishments include "Taking our first £9,000 of revenue (net of VAT)", "Being authorised by the Financial Conduct Authority", "Securing a bespoke insurance deal specifically for co-leasing" and "Completing our seed funding round in June 2015 for £113,500".
Presentation choice: In a regulated service, the licence and insurance deal are traction.
When it does not fit: Vague counts beside precise ones.
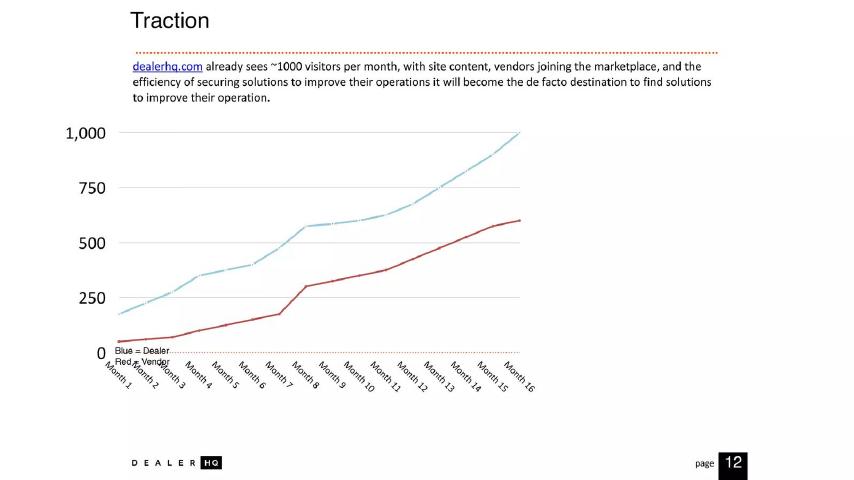
Marketplace and software for car dealers and their vendors. Slide titled "Traction".
DealerHQ deck, slide 13. Exact stored slide matched to this analysis.
Our analysis: Growth on both sides of the marketplace, measured in visitors rather than users or revenue.
Evidence and limitation: Company website figures.
What a founder can adapt: Label the chart's units and add sign-ups or paying vendors.
Supporting analysis
What the deck claims: "dealerhq.com already sees ~1000 visitors per month". A line chart over 16 months shows two lines, "Dealer" and "Vendor", rising to about 1,000 and 600.
Presentation choice: Showing both sides is right for a marketplace.
When it does not fit: Website visits as the only traction figure.
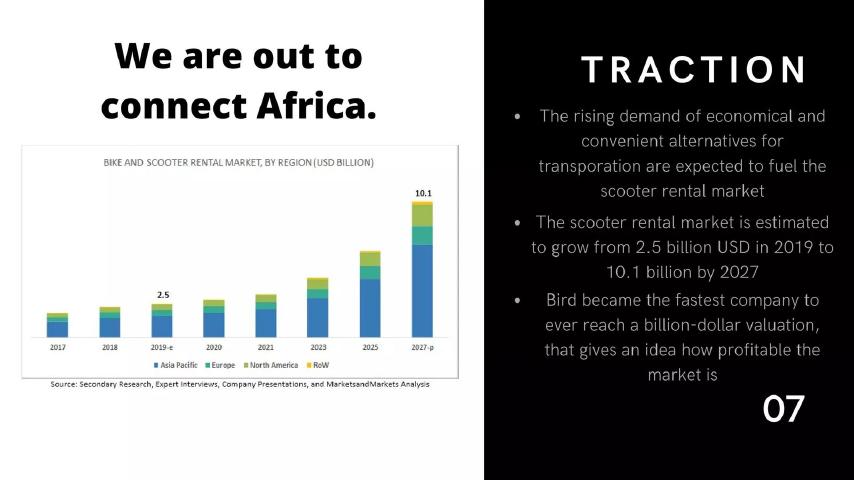
Scooter rental in Africa. Slide titled "Traction". Warning example.
Scoutr deck, slide 7. Exact stored slide matched to this analysis.
Our analysis: A market slide under a traction heading.
Evidence and limitation: Third-party market estimate; no company figures.
What a founder can adapt: Show your own riders, rides or pilots; move market size to the market slide.
Supporting analysis
What the deck claims: "We are out to connect Africa." A chart of the bike and scooter rental market by region. "The scooter rental market is estimated to grow from 2.5 billion USD in 2019 to 10.1 billion by 2027"; "Bird became the fastest company to ever reach a billion-dollar valuation".
Presentation choice: Investors notice when the traction slide has no company figures.
When it does not fit: Another company's valuation as your traction.
Whether each slide gives repeat use, cost or revenue, and says when the figures happened.
Example
Repeat use
Cost or revenue
Clearly actual
One Mobility
Churn 1.3%, 430 recurring orders
€67.19 CAC, €41,595 income
Yes, figures don't agree
Orto
No
£9,000 revenue
Yes
DealerHQ
No
No
Yes, visitors only
UberCab
No
No
Yes, pre-launch
Vruum
42% retention
₹25-50 CPA
Not stated
Scoutr
No
No
No company figures
Key Takeaways
Lead with repeat use: retention, churn or recurring orders.
Give cost and value per customer side by side.
Say whether each number is a result or a target.
Check that monthly and yearly figures agree.
Before launch, list dated, checkable progress.
Build your mobility traction slide
Answer these before you design the slide.
Repeat use. What share of customers ride, rent or order again within 30 days?
Unit economics. What does one customer cost to win, and what does one vehicle earn over its life?
Time. For each figure, what period does it cover, and is it actual or a target?
Consistency. Do your monthly figures add up to your yearly ones?
Copyable framework: Actual, [period]: [customers] customers, [repeat-use %] return within 30 days, [cost] per customer, [revenue] revenue. Target for [date]: [figure].
Illustrative example 1 — written by us
Before: 50,000+ downloads, 15,000+ active users, 42% retention.
After: Actual, Jan–Mar 2025, two pilot cities: 50,000 downloads, 15,000 monthly riders, 42% ride again within 30 days, ₹40 per new rider.
What improved: Our illustrative rewrite; all figures are invented for the example. It dates the figures, names where they come from and marks them as actual.
What this guide adds
The general traction guide covers any startup. Mobility is different because each customer usually needs a physical asset: a car, a bike, a driver or a vehicle off a production line. That ties up money before revenue arrives, and it makes investors ask how often each asset is used and whether customers come back. The examples here show which figures answer those questions and which leave them open.
How we read each slide
We read each stored slide image and quote the text on it. Small-text slides were read at full size. We have not checked any company's figures, and we make no claim that any slide affected a fundraising outcome.
The figures that matter in mobility
Repeat use: churn, retention or recurring orders show whether customers come back. One Mobility gives 1.3% churn and 430 recurring orders; Vruum gives 42% 30-day app retention and 72% three-month driver retention.
Unit economics: the cost of winning a customer beside what a customer or asset earns. One Mobility gives a cost of €67.19 per customer and a lifetime profit figure per bike.
Volume: deliveries, rides or customers over a stated period. Vruum gives daily rides.
Licences and partners: in regulated areas such as car leasing and insurance, approval can count as progress. Orto lists FCA authorisation and a bespoke insurance deal.
Results versus targets
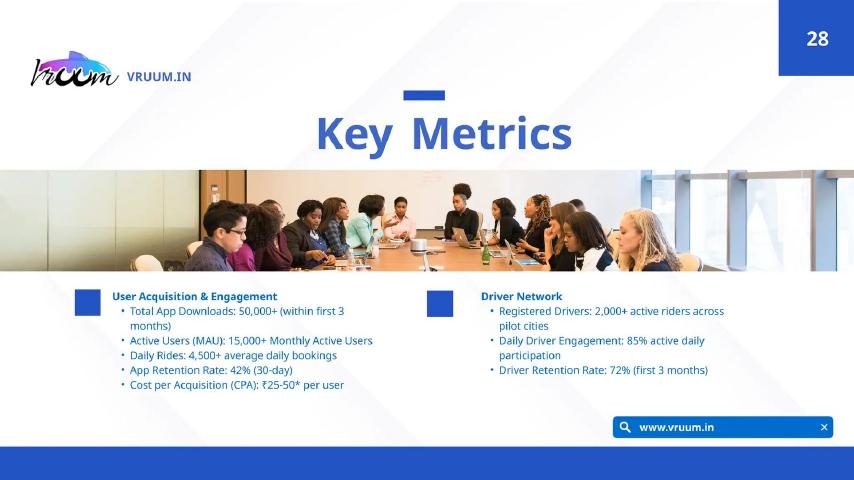
Investors discount any number they cannot place in time. Vruum's slide lists "Total App Downloads: 50,000+ (within first 3 months)", "Active Users (MAU): 15,000+" and "Daily Rides: 4,500+" under the heading "Key Metrics", with no date and no word on whether these happened. A reader cannot tell a result from a plan.
The fix is simple: put a date or period next to every figure, and if a chart mixes results with targets, label which bars are actual and which are plan. (General guidance.)
Mobility figures also need to agree with each other across the deck. If the traction slide gives monthly revenue, the financials slide should show the same month, and twelve months of income should be roughly twelve times the monthly figure unless you explain the ramp. If you report rides or rentals, give the number of vehicles behind them, so an investor can work out use per vehicle per day, which is the figure that drives most mobility business models. If some vehicles are owned and some belong to partners or drivers, say how many of each, because that changes how much capital each new city needs. (General guidance.)
Make the numbers agree
One Mobility's table is one of the most complete in this set, but two of its figures pull apart. Average monthly revenue of €6,904.32 would come to about €82,850 over a year, while the slide gives total income of €41,595.38 for the last 12 months. There may be a good reason, such as revenue growing through the year, but the slide doesn't say. Investors will do this sum, so do it first and explain any gap.
Traction before launch
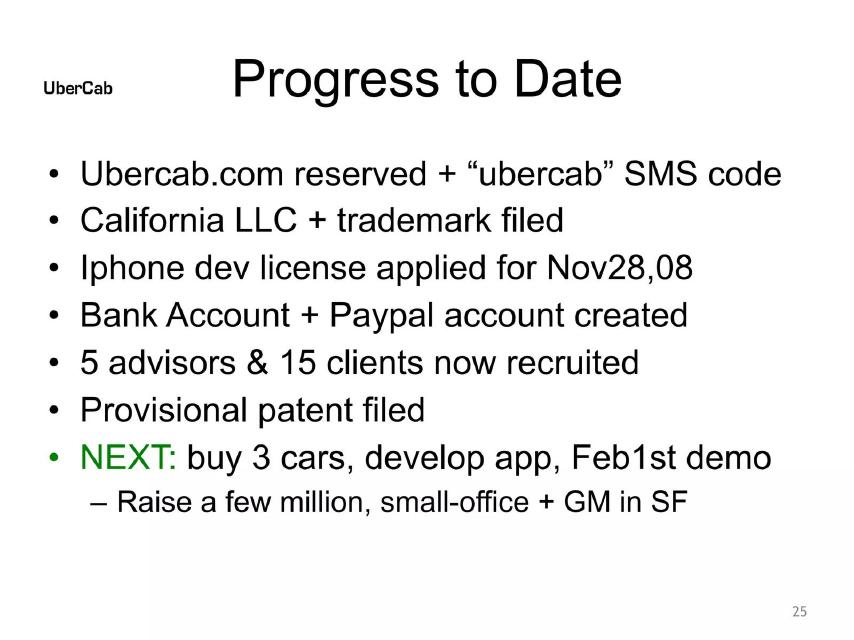
A company with no customers can still show progress. UberCab's December 2008 slide, "Progress to Date", lists a reserved domain and SMS code, a California LLC and trademark, an iPhone developer licence application, "5 advisors & 15 clients now recruited" and a provisional patent, then "NEXT: buy 3 cars, develop app, Feb1st demo". Each item is concrete and could be checked. That is better than market-size charts placed under a traction heading, as on Scoutr's slide.
Which metric to lead with, by business type
Subscriptions and rentals: lead with churn or retention, then cost per customer. One Mobility's 1.3% churn and its split of 3, 6 and 12 month subscriptions (75, 67 and 130) tell investors that most customers commit for a year, which makes revenue easier to forecast. If your customers mostly take the shortest plan, say so and explain why that still works.
Ride-hailing and on-demand services: lead with rides per day or per week and with rider retention, then the driver side. Vruum picks the right set: daily rides, 30-day app retention, driver retention over three months and daily driver activity. Two-sided services need both sides to stay, so show both.
Vehicle makers: lead with deliveries over a stated period, then orders or reservations that have not yet been delivered, so the order book shows what supports any delivery plan.
Software and marketplaces for the car trade: lead with paying dealers or vendors and revenue, not visits. DealerHQ's dealer and vendor lines are the right idea, but visitors are an early signal; sign-ups, listings or transactions would carry more weight.
Asset-sharing models: lead with use per asset. Orto's single Jaguar F-Type S shared by four arm's length customers is a small but clear proof that the model works for one car; the next question is how many cars, and how full each one is.
Asset use is the hidden traction figure
Most mobility businesses own or finance something expensive, so investors care how hard each asset works. A bike that sits in a shed, a car that is leased half the year or a driver who logs on twice a week all cost money without earning it. Figures such as rides per vehicle per day, months rented per bike per year or customers per car show this directly.
None of the slides in this guide gives a clean use-per-asset figure, though several come close. One Mobility gives 300 bikes and 272 active subscriptions across its three plan lengths, which suggests most bikes are out with customers. Vruum gives 4,500 daily rides and 2,000 registered drivers, roughly two rides per driver per day if both figures are actual. Doing that sum on the slide saves investors doing it for you, and lets you explain the answer.
How to show early traction honestly
Small numbers presented plainly are worth more than large numbers with no date. Orto's £9,000 of revenue is modest, but the slide gives it net of VAT, puts it beside a licence and an insurance deal, and dates the seed round. A reader knows exactly where the company stands.
When a figure comes from a pilot, say where and for how long. When a figure is a target, put it in a separate block with its date. When two figures disagree, as One Mobility's monthly and yearly revenue do, add one line that explains the gap. Each of these takes a few words and removes a question investors would otherwise ask in the meeting, or not ask and quietly hold against you.
Common mistakes
No date on metrics. Say actual or target, and when.
Figures that don't agree. Reconcile monthly and yearly totals.
Market size as traction. Show your own figures.
Visits as the only figure. Add sign-ups or revenue.
Vague counts. Replace "hundreds" with a number.
Unexplained footnotes. Explain every asterisk.
Diagnostic checklist
Repeat-use figure given.
Cost per customer stated.
Revenue or volume over a stated period.
Each figure marked actual or target.
Monthly and yearly figures agree.
Pre-launch progress is concrete and dated.
Frequently asked questions
What should a mobility startup's traction slide show?
Repeat use, cost and value per customer, and volume over a stated period, each marked as actual. One Mobility gives churn of 1.3% and a cost of €67.19 per customer.
What if we haven't launched yet?
List concrete, checkable progress and a dated next step. UberCab's 2008 slide lists 5 advisors, 15 clients, a trademark and a provisional patent, then "buy 3 cars, develop app, Feb1st demo".
Do licences count as traction?
In regulated services, yes. Orto lists FCA authorisation and a bespoke insurance deal beside its first £9,000 of revenue.
Can I put projections on the traction slide?
Only if they are clearly separated from results: label the plan years as plan, apart from delivered figures.
How we chose these examples
Corpus: published pitch deck teardowns on StartupFundraising.com. Founder-uploaded private decks are excluded.
Removed in v2 (2026-10-05): EVT, because a page of its deck carries a restriction notice. Selection (2026-10-01): we searched extracted slide text for traction, milestones, progress and key metrics slides in decks from mobility companies already identified in other mobility guides. We viewed 6 slides and one further progress slide, none used in another guide, and kept all 7, two as warning examples.
Review: stored slide images were read on 2026-10-01 against company, deck and slide number; slides with small text were read at full size (editorial model review). No person has yet completed an editorial review of this page. We did not verify any company's figures.