How to Justify Your Valuation on a Pitch Deck: 6 Real
Stating a valuation is easy; showing why it's fair is harder. Six real ask slides justify theirs with a comparable raise, a revenue multiple.
Why This Valuation? How Founders Justify the Number on the Ask Slide
Six ask slides from five startups that don't just state a valuation but try to explain it: Vajro compares itself with a rival's raise and applies a multiple of revenue, Chekkit points to growth since its last round, MobilFlex names a valuation method, evvnt works back from an exit, and MySwimPro lays out a path of future valuations. We check each against its own figures.
TL;DR
If you put a valuation on your deck, investors will ask where it came from. There are five common answers: a comparable company's round, a multiple of your revenue, progress since your last round, a formal valuation method, or the return an investor would earn at a future exit. Each can work, but only if the slide gives the inputs that let the reader check it: the comparable's actual terms and source, the revenue the multiple applies to, what grew and by how much, the method's main assumptions, or the exit value with its dilution.
None of the six slides here gives all of that. Vajro is the most explicit about its basis ("10x our ARR number") but counts clients still on trial and hides the figures. Chekkit's "3x growth from last round" doesn't say what grew. MobilFlex names a method but not its inputs. evvnt's 12x-16x return doesn't match its own terms unless later dilution is assumed. MySwimPro's next-round range is about 21 to 28 times its current revenue (our calculation), which the slide never explains.
Valuation slides from real pitch decks
Each example records the basis the slide offers for its valuation and whether the slide gives the inputs to check it. "Our calculation" marks arithmetic we did; everything else is quoted from the slide.
Vajro ask slide — slide 23
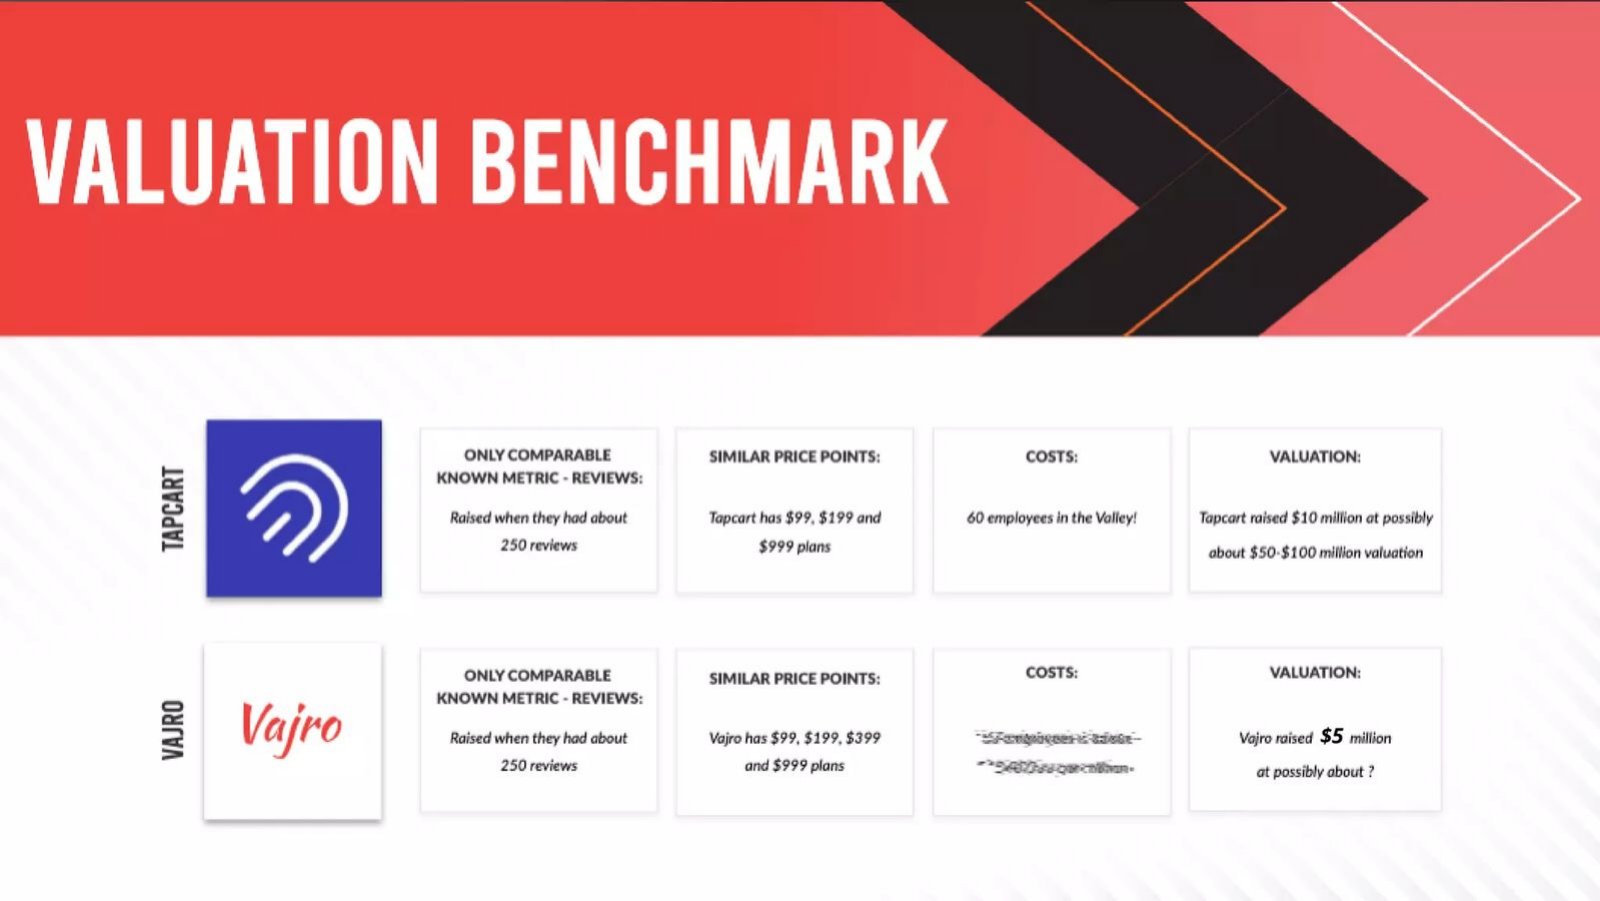
Mobile app builder for Shopify stores. Deck from around late 2020; valuation benchmark page.
Vajro deck, slide 23. Exact stored slide matched to this analysis.
Our analysis: Right idea, unverified comparable.
Evidence and limitation: Comparable's valuation is an unsourced guess spanning a factor of two; "raised" conflicts with page 21's "targeting".
What a founder can adapt: Give the comparable's round, date, valuation and source.
Supporting analysis
What the deck claims: Tapcart and Vajro both "Raised when they had about 250 reviews"; price plans compared; "Tapcart raised $10 million at possibly about $50-$100 million valuation"; "Vajro raised $5 million at possibly about ?". Vajro's cost box blurred.
Presentation choice: A comparable is only as good as its reported terms.
When it does not fit: Don't base your price on a guess about someone else's.
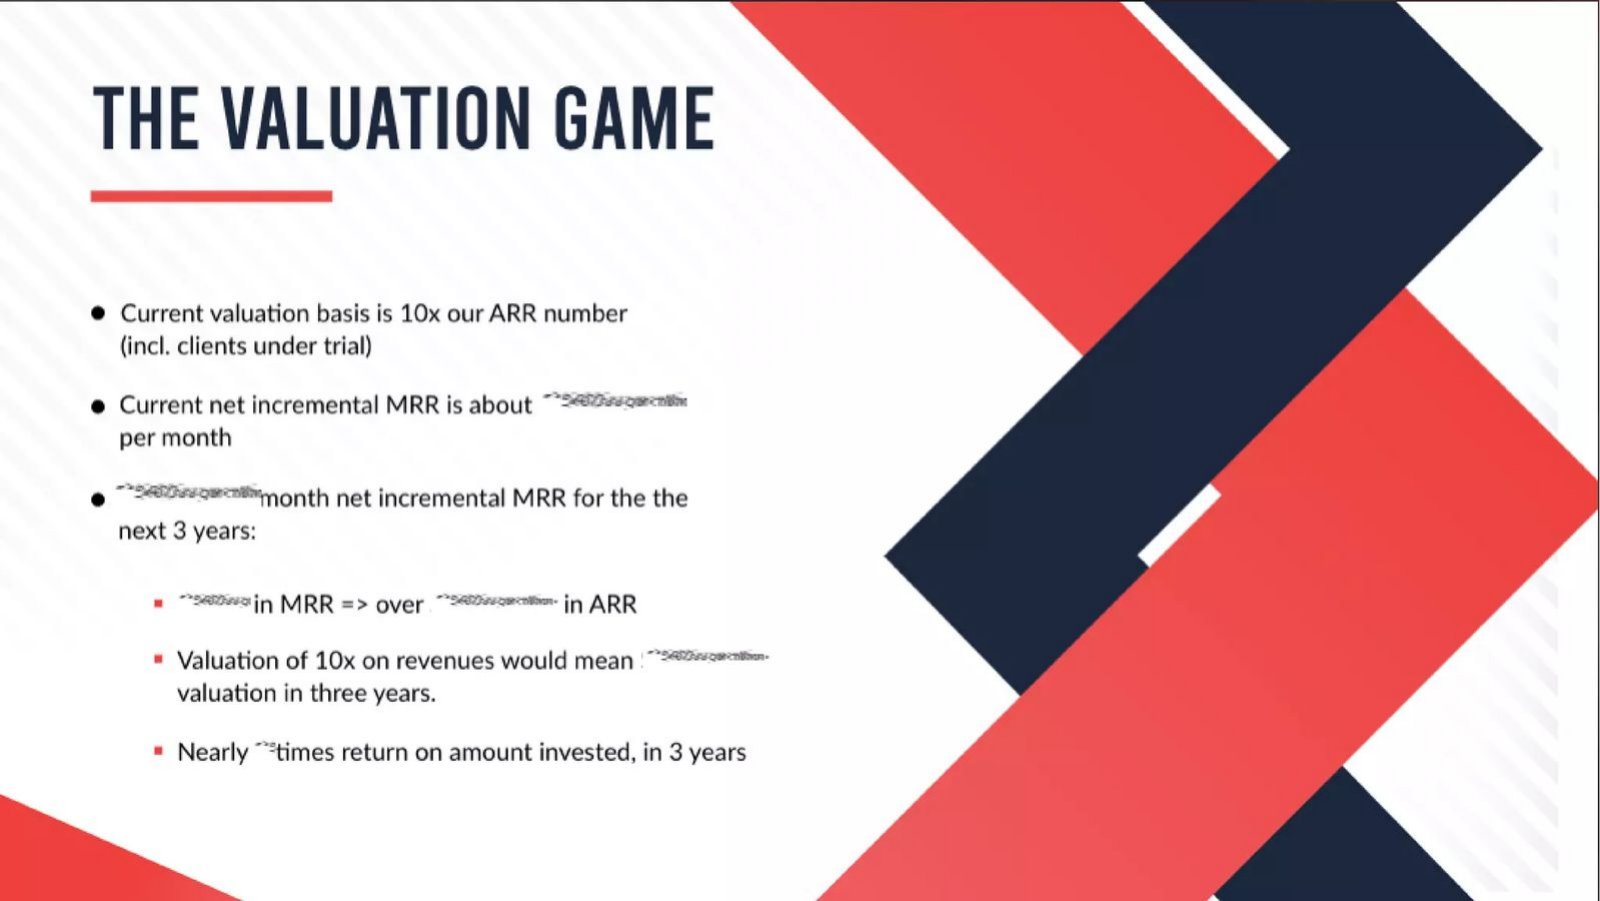
Same deck. Valuation method page; figures blurred in the published version.
Vajro deck, slide 25. Exact stored slide matched to this analysis.
Our analysis: The clearest statement of basis in the set.
Evidence and limitation: Basis and multiple stated; base includes non-paying trial clients; source of 10x not given.
What a founder can adapt: Use paying ARR and say where the multiple comes from.
Supporting analysis
What the deck claims: "Current valuation basis is 10x our ARR number (incl. clients under trial)"; net incremental MRR projected for three years; "Valuation of 10x on revenues would mean" a three-year valuation; a multiple return "in 3 years".
Presentation choice: Investors can test a multiple only if the base is clean.
When it does not fit: Don't count trial users as revenue.
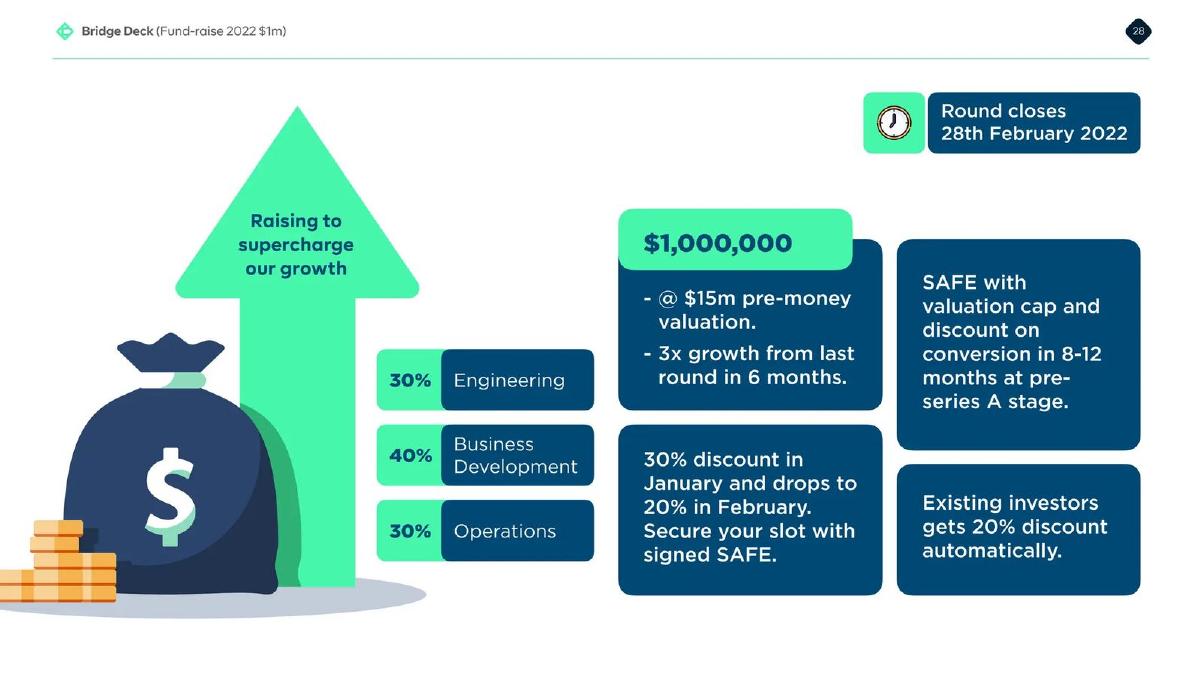
Product-verification startup. Bridge round closing February 2022; terms page.
Chekkit deck, slide 28. Exact stored slide matched to this analysis.
Our analysis: Growth basis without the growth figure.
Evidence and limitation: The measure behind 3x and the last round's price are not given; pre-money and cap not distinguished.
What a founder can adapt: Name the metric that tripled and the last round's valuation.
Supporting analysis
What the deck claims: "$1,000,000" "@ $15m pre-money valuation"; "3x growth from last round in 6 months"; "SAFE with valuation cap and discount"; "30% discount in January and drops to 20% in February".
Presentation choice: A step-up is judged against the last price and what changed.
When it does not fit: Don't call a SAFE cap a pre-money valuation.
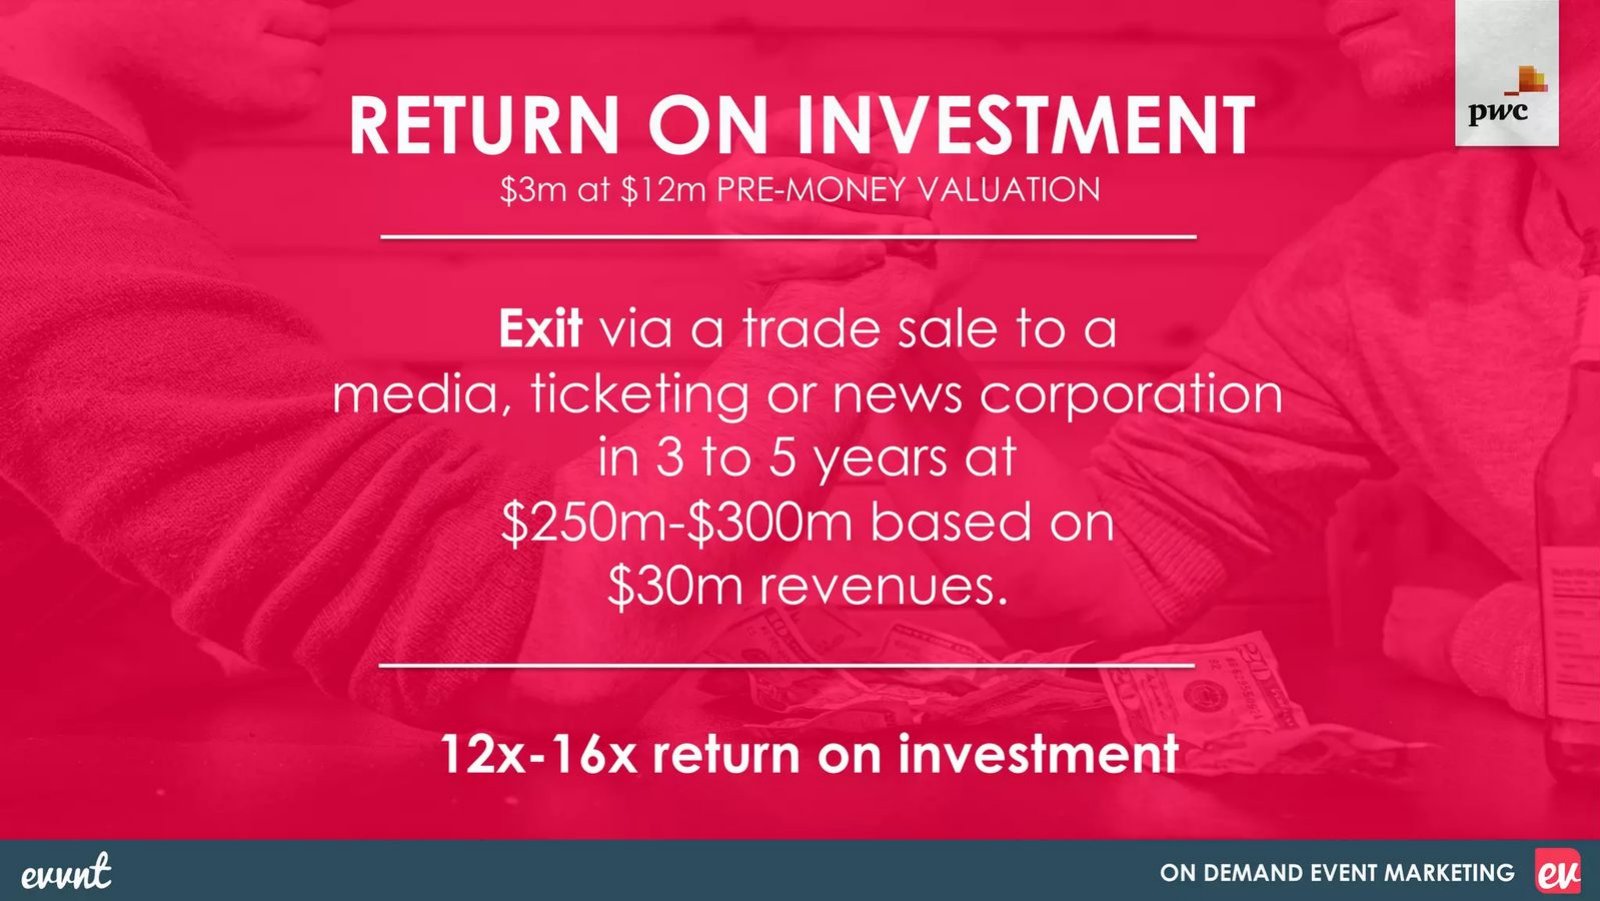
Event-marketing platform. June 2019 deck; return page.
evvnt deck, slide 17. Exact stored slide matched to this analysis.
Our analysis: Exit-based case with missing arithmetic.
Evidence and limitation: Our calculation: 20% stake gives about 17x-20x undiluted; 12x-16x implies unstated dilution. Exit about 8-10x revenue, no comparable.
What a founder can adapt: Show stake, assumed dilution and the exit multiple's source.
Supporting analysis
What the deck claims: "$3m at $12m pre-money valuation"; exit "in 3 to 5 years at $250m-$300m based on $30m revenues"; "12x-16x return on investment"; PwC logo.
Presentation choice: Return claims are checked first.
When it does not fit: Don't place a firm's logo without saying what it did.
Copyable framework: [Pre-money/cap] of [value], based on [basis]: [inputs with source]. New investors own [stake]%. That is [x] times our [paying ARR], because [reason].
Illustrative example 1 — written by us
Before: Raising $1M at a $15M pre-money valuation. 3x growth since last round.
After: Raising $1M SAFE, $15M post-money cap. Last round: $5M cap, March. Paying revenue since then: $20K to $60K a month (3x). New investors own about 6.7%.
What improved: Our illustrative rewrite; the figures are invented for the example. It names the instrument, the last price, the metric that tripled and the implied stake.
The question this guide answers
Founders raising a priced round, or setting a cap on a SAFE or convertible note, have to choose a number. Many decks state it on the ask slide without explanation. Others try to justify it, and that's where the deck either earns trust or invites a long argument. The founder question is: if I put a valuation on my deck, how should I explain it, and which kinds of explanation actually hold up?
Our existing guides cover nearby ground but not this. The deal-terms guide shows how to state the instrument, amount, cap or pre-money and what's committed. The cap-table guide checks that price, shares and valuation agree. The investor-returns guide covers what an exit might pay. None compares the bases founders use to justify the number itself, or what inputs each basis needs to be credible.
A note on timing. Many investors prefer to discuss valuation in the meeting rather than see it on a slide, and plenty of good decks leave it off. This guide is for founders who have decided to include it, often in crowdfunding, angel or bridge rounds, where the terms must be stated up front.
How we chose and read the examples
We searched the extracted text of the deck library for phrases such as pre-money valuation, valuation basis, valuation cap and multiples of ARR or revenue, then kept slides that gave a reason for the number rather than the number alone. Funds, listed companies and decks that only defined terms were excluded, as were slides already analysed for the same point elsewhere. A MySwimPro appendix page explaining what a SAFE is was read and left out because it gives no basis for the company's own valuation.
Six slides from five companies remained: Vajro pages 23 and 25, Chekkit page 28, MobilFlex page 12, evvnt page 17 and MySwimPro page 14. Each was rendered from the original deck file and read at full size. All five companies were private when their decks were made. Vajro's deck refers to a term sheet given in October 2020; Chekkit's says its round closes 28 February 2022; evvnt's is dated June 2019; MySwimPro's states its financial position as of January 2019; MobilFlex's deck is undated. MobilFlex's page also appears in our use-of-funds guide, for a different point.
Vajro's published deck has several figures blurred out, apparently by the company before sharing it. We quote only what can be read and say where figures are hidden. All arithmetic labelled "our calculation" is ours.
Basis 1: a comparable company's round
Vajro, a mobile app builder for Shopify stores, uses page 23, "Valuation Benchmark", to set itself beside its closest rival, Tapcart. Four columns compare them. "Only comparable known metric - reviews": both "Raised when they had about 250 reviews". "Similar price points": Tapcart "$99, $199 and $999 plans", Vajro "$99, $199, $399 and $999 plans". "Costs": Tapcart "60 employees in the Valley!"; Vajro's entry is blurred. "Valuation": "Tapcart raised $10 million at possibly about $50-$100 million valuation" and "Vajro raised $5 million at possibly about ?".
The idea is sound: if a near-identical company raised at a known price at the same stage, that's evidence of what the market will pay. The page is candid that the only shared metric is app-store reviews, and the price comparison is useful. But the comparable's valuation is itself a guess, "possibly about" a range that spans a factor of two, with no source. A comparable is only as good as its terms; without a published or reported valuation, the slide asks the investor to accept one estimate on the strength of another.
The tense is also confusing. "Vajro raised $5 million" reads as a completed round, while page 21 says the company is "targeting $5 million". And the page argues mainly that Vajro is cheaper to run, but the blurred cost box removes the one figure that would show it.
Basis 2: a multiple of revenue
Vajro's page 25, "The Valuation Game", states its basis outright: "Current valuation basis is 10x our ARR number (incl. clients under trial)". It then projects net new monthly recurring revenue for three years, converts it to ARR, applies the same 10x to give a valuation "in three years", and claims a multiple return on the amount invested. The figures themselves are blurred in the published version.
Stating the multiple and what it applies to is exactly what a revenue-multiple basis needs, and few decks are this direct. The problem is what's in the base. Clients on a free or discounted trial aren't yet paying, and some won't convert; counting them inflates ARR and therefore the valuation. A credible version would give ARR from paying customers only, the trial-to-paid conversion rate, and then the multiple, with a note on where 10x comes from: recent rounds for similar software, public company multiples, or a reported comparable.
The forward part has a second issue. Applying today's multiple to revenue three years out assumes the multiple holds, and the return claim assumes no further dilution. Both are assumptions worth stating.
Basis 3: growth since the last round
Chekkit's bridge deck, page 28, says it is raising "$1,000,000" "@ $15m pre-money valuation", with "3x growth from last round in 6 months". Beside it: "SAFE with valuation cap and discount on conversion in 8-12 months at pre-series A stage", a "30% discount in January and drops to 20% in February", "Existing investors gets 20% discount automatically", and a use of funds of 30% engineering, 40% business development and 30% operations. The round "closes 28th February 2022".
Progress since the last round is a natural basis for a bridge: investors who priced the last round can see what changed. But "3x growth" doesn't say what grew. If revenue tripled, that supports a higher price; if it's users, sign-ups or the valuation itself, it means something different. Nor does the slide give the last round's valuation, so the reader can't tell whether $15m is a step up, flat or a step down.
The terms also mix two structures. A SAFE usually has a valuation cap rather than a pre-money valuation; the slide calls $15m a pre-money valuation and also says the SAFE has a cap, without saying whether they're the same number. The time-limited discount is a closing tactic, not a valuation basis, and investors may read it as pressure.
Basis 4: a named valuation method
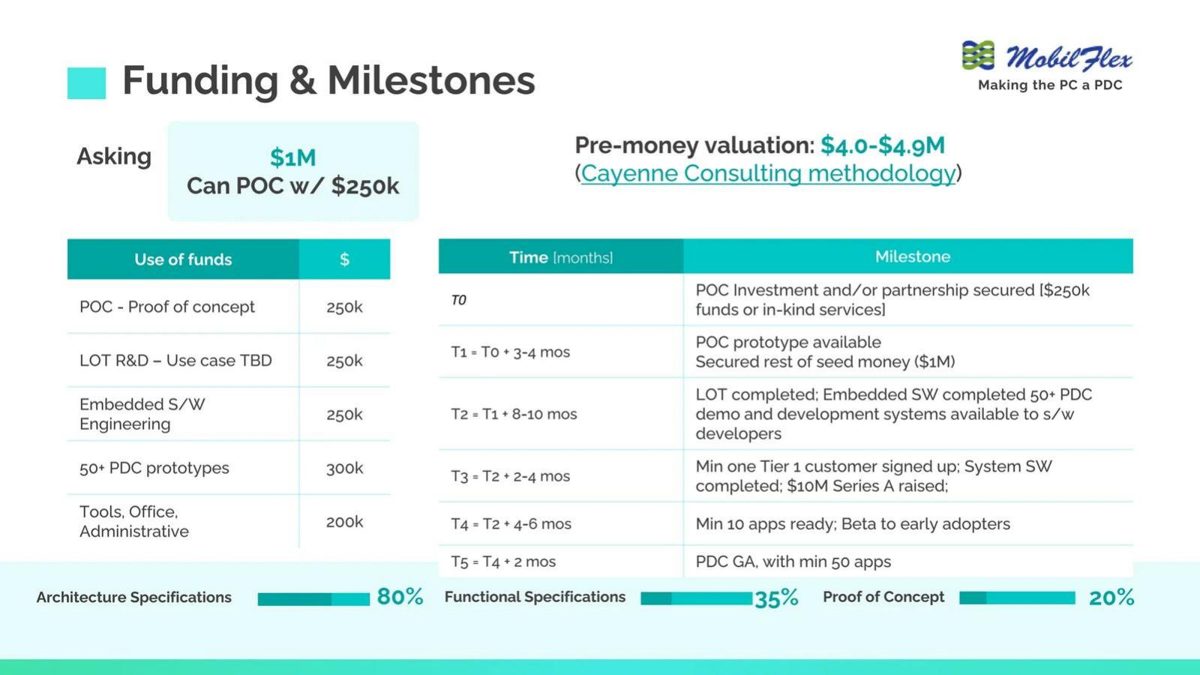
MobilFlex, which designs a computer architecture it calls a PDC, uses page 12, "Funding & Milestones". It is "Asking $1M" and "Can POC w/ $250k", with "Pre-money valuation: $4.0-$4.9M (Cayenne Consulting methodology)", where the method name is a link. Below are a use-of-funds table and a timeline from a proof-of-concept investment to general availability.
Naming a method signals that the number came from a process rather than a wish, and giving a range rather than a point is honest for a pre-revenue company. On a $1M raise, the range implies new investors would own about 17% to 20% (our calculation). But the slide doesn't say which inputs the method used: comparable companies, team, stage, intellectual property, or a scorecard. Without them, the method name works only as an appeal to authority. One sentence on the two or three inputs that drove the range would make it testable.
The page also has an internal mismatch worth checking in your own deck: the use-of-funds rows (250k, 250k, 250k, 300k and 200k) add to $1.25M, while the ask is $1M (our calculation).
Basis 5: working back from an exit
evvnt, an event-marketing platform, uses page 17, "Return on Investment": "$3m at $12m pre-money valuation"; "Exit via a trade sale to a media, ticketing or news corporation in 3 to 5 years at $250m-$300m based on $30m revenues"; "12x-16x return on investment". A PwC logo sits in the corner without explanation.
Working back from an exit tells investors what they could earn, which is the question behind any valuation. The arithmetic should be on the page. $3m at $12m pre-money is $15m post-money, so new investors would own 20%; 20% of $250m-$300m is $50m-$60m, or about 17x-20x the $3m (our calculations). The slide's 12x-16x is lower, which would fit if later rounds dilute the stake to roughly 14% to 16% (our calculation), but the slide doesn't say so. The exit multiple, about 8 to 10 times the $30m revenue (our calculation), is also stated without a comparable sale.
The unexplained logo is a smaller issue but a real one. If a firm advised on the valuation or audited the figures, say what it did; if not, a logo next to a valuation can be read as an endorsement it isn't.
A valuation path, and checking it against today
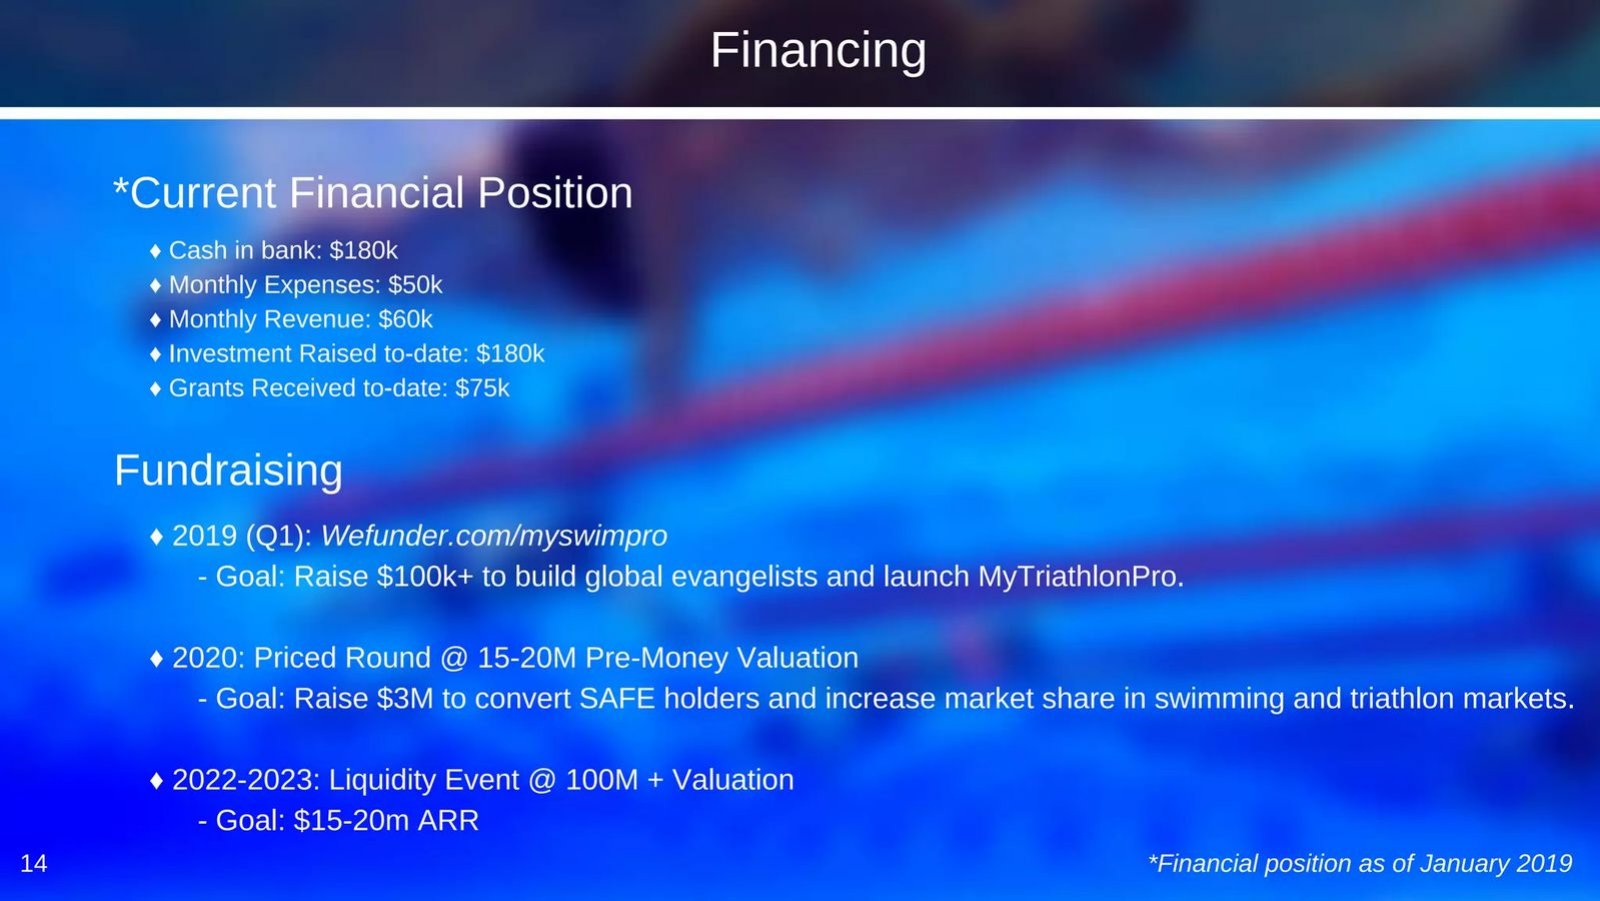
MySwimPro, a swimming app, uses page 14, "Financing". Its "Current Financial Position" (as of January 2019): cash $180k, monthly expenses $50k, monthly revenue $60k, investment raised to date $180k, grants $75k. Its "Fundraising" plan: a 2019 crowdfunding raise of "$100k+", a "2020: Priced Round @ 15-20M Pre-Money Valuation" to raise $3M, and a "2022-2023: Liquidity Event @ 100M + Valuation" with a goal of "$15-20m ARR".
Putting today's revenue beside the future valuations lets the reader check them, which is the page's strength. $60k a month is about $720k a year; a $15M-$20M pre-money is about 21 to 28 times that (our calculation), a high multiple for an app with its revenue, and the slide doesn't explain it. The exit target is more conservative: $100M on $15M-$20M ARR is about 5 to 7 times revenue (our calculation). So the plan implies the multiple falls as the company grows, which is plausible but should be said. Showing that monthly revenue already exceeds expenses is useful context the valuation argument doesn't use.
What to put on your slide
Start with one line naming the basis and its inputs: "$8M pre-money: 8x our $1.0M ARR from paying customers; similar seed software rounds in 2024 priced at 6-12x (source)". If you use a comparable, give its round, date, valuation and source. If you use growth, say what grew, from what to what, and the last round's price. If you use a method, name the two or three inputs that moved the number. If you use an exit, show the stake, the dilution you assume and the exit multiple's source.
Then check the arithmetic: implied ownership from the amount and valuation, any return multiple, and the multiple of current revenue the valuation represents. If that last figure is high, say why. Investors will calculate it anyway.
Common mistakes
Number with no basis. Say how the valuation was set.
Unsourced comparable. Give the comparable's reported terms and source.
Inflated revenue base. Leave trial and pilot users out of ARR.
Growth without a metric. Name what grew and from what.
Return without dilution. Show the stake after later rounds.
Cap called pre-money. Use the right term for the instrument.
Diagnostic checklist
The valuation's basis is named.
Its inputs are given with dates and sources.
The revenue base counts paying customers only.
Implied ownership is stated or easy to compute.
The multiple of current revenue is addressed.
Any return claim shows its dilution assumption.
Frequently asked questions
Should I put my valuation on my pitch deck?
Only if the round needs terms up front, as crowdfunding and many angel or bridge rounds do. If you include it, give the basis; Vajro's "10x our ARR" is the kind of line investors look for.
How do I justify a startup valuation with comparables?
Use a comparable's reported round, date and valuation with a source. Vajro's comparison with Tapcart uses a "possibly about $50-$100 million" guess, which can't be checked.
Can I count trial customers in the revenue behind my valuation?
No. Vajro's basis includes "clients under trial"; give paying ARR and your trial-to-paid conversion rate separately.
What's the difference between a SAFE cap and a pre-money valuation?
A cap is the maximum valuation at which a SAFE converts later; a pre-money valuation prices shares now. Chekkit's slide uses both terms for one SAFE without saying how they relate.
How do I show investors their potential return?
Show the stake, the dilution you expect and the exit multiple's source. evvnt's 12x-16x is below the 17x-20x its own terms give undiluted, so the dilution should be stated.
How we chose these examples
Selection (2026-10-02): we compared the published ask-slide guides and queued drafts; the deal-terms guide covers how to state terms and the cap-table guide checks that price and valuation agree, but none compares how founders justify the valuation itself.
Six pages from five original deck files were rendered and read at full size: Vajro 23 and 25, Chekkit 28, MobilFlex 12, evvnt 17 and MySwimPro 14. MySwimPro's appendix page on SAFEs (page 26) was read and excluded. Vajro's figures that were blurred in its published deck are reported as hidden, not estimated.
Eligibility was judged at each deck's date; all five companies were private. This guide was written with an AI editorial model and checked against the slide images by model review. Valuations, revenue and returns are the companies' own claims and were not independently verified; arithmetic labelled as ours was checked twice.