From One Pilot to a Five-Year Forecast: How Bridge
A whole-deck walkthrough of Bridge Software's 13-slide seed deck: how a single distributor pilot becomes a rollout, a branch count and a five-year forecast.
From One Pilot to a Five-Year Forecast: Following Bridge Software's Evidence
Many early decks have one good pilot and a forecast that assumes the pilot repeats everywhere. Bridge Software's 13-slide seed deck from 2015, for its contractor software Stagistics, is unusually open about both. It shows a dated pilot with a roofing distributor, results by month, a rollout agreement, and then a five-year forecast that grows from 14 active branches to 1,764. We follow the evidence from the pilot to the forecast to show which steps the deck supports, which it assumes, and how a founder can make that bridge visible.
TL;DR
To turn a pilot into a believable forecast, a deck has to show three things: what the pilot produced per unit (here, per distributor branch), how many units the company has a signed path to, and what the forecast assumes about each. Bridge Software's deck is strong on the first. Page 7 dates the pilot step by step, from '1/28: 1st branch visit' to '5/15: Formalized onboarding and sales process', with '44 Companies', '398 Users' and '93 Completed' transactions by 30 June 2015. Page 8 shows integrated orders averaging '$3,499' against '$2,374' (+47%). Page 6 records that in May 2015 'SRS agreed to conclude pilot and roll out to all branches'.
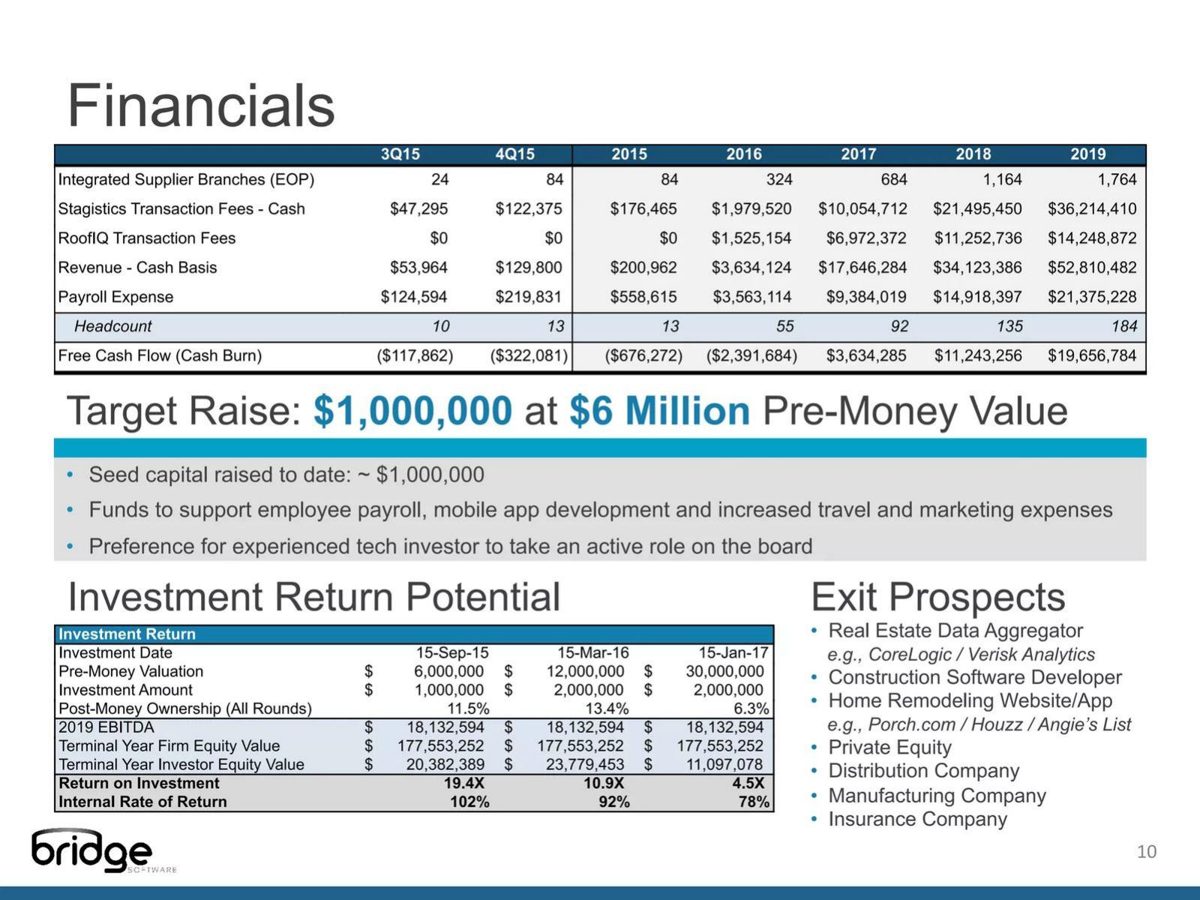
The forecast on page 10 then goes further than the signed partners. SRS has '152 Branches' and Richards '60 Branches' (page 6); page 9 counts 14 active, 17 integrated but not active and 188 not yet integrated, about 219 in all. The forecast passes that total in 2016 ('324' branches) and reaches '1,764' in 2019, so most of it depends on distributors not yet signed; page 9's 'Pilot with ABC Supply started in July 2015' is the only one named. Revenue per branch also rises: June 2015's $4,845 from 14 branches is roughly $4,200 a year each, while 2019's '$52,810,482' over 1,764 branches is roughly $30,000 each. Part of that comes from a second product, RoofIQ, with '$0' revenue in 2015.
The lesson for founders: separate the forecast into what the pilot proves, what signed partners make likely, and what still has to be won. Bridge Software's deck has the evidence for the first and the contracts for the second, but merges all three into one table.
The evidence chain page by page
Five pages from Bridge Software's 13-slide deck, each one step from a single pilot to the five-year forecast.
Bridge Software executive summary slide — slide 6
Contractor software for building suppliers, seed stage. Partners and rollout.
Bridge Software deck, slide 6. Exact stored slide matched to this analysis.
Our analysis: Our reading: the pilot led to a partner's decision, the strongest follow-on evidence.
Evidence and limitation: Dated partner decisions; contract unsigned, period not stated.
What a founder can adapt: Show the partner's decision and the size of the network it opens.
Supporting analysis
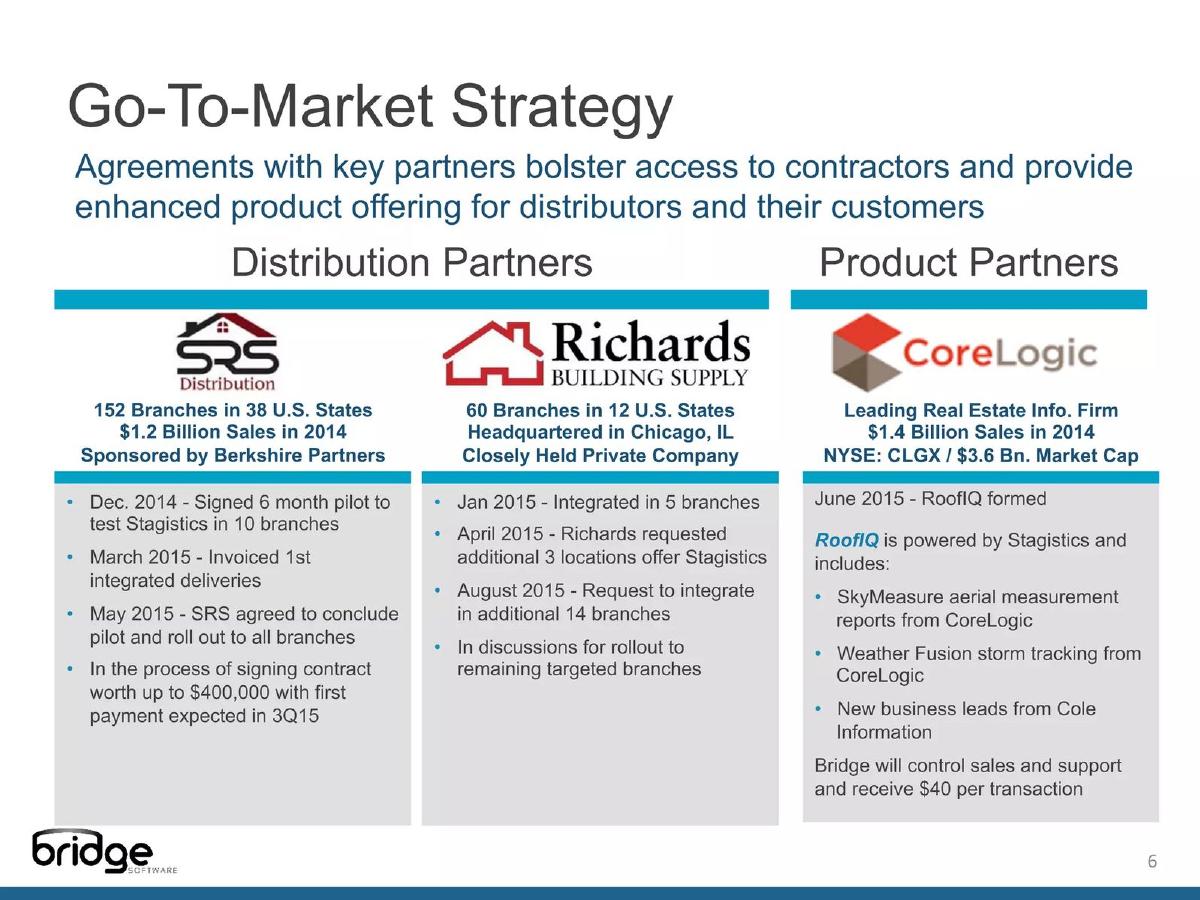
What the deck claims: SRS ('152 Branches'): 'Signed 6 month pilot… in 10 branches', then 'agreed to conclude pilot and roll out to all branches'; contract 'worth up to $400,000'. Richards ('60 Branches') adding branches in stages.
Presentation choice: A rollout agreement shows the pilot convinced the buyer, not just the users.
When it does not fit: Don't leave a contract's value and period vague.
Bridge Software deck, slide 9. Exact stored slide matched to this analysis.
Our analysis: Our reading: honest about scale, and it gives the per-branch baseline the forecast should start from.
Evidence and limitation: Monthly figures; branch counts total about 219.
What a founder can adapt: State live units and revenue per unit next to each other.
Supporting analysis
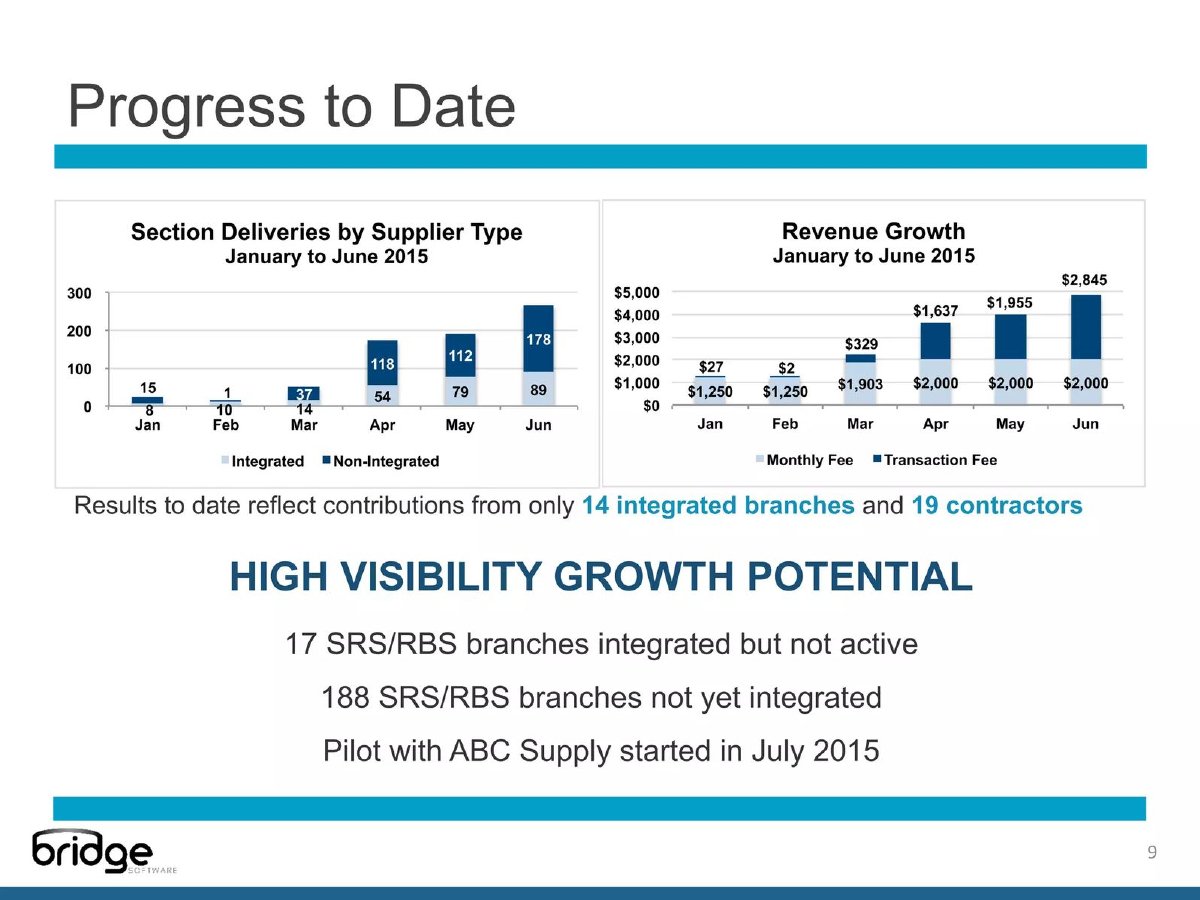
What the deck claims: June revenue $2,000 monthly fee plus $2,845 transaction fees; 'only 14 integrated branches and 19 contractors'; 17 integrated not active; 188 not integrated.
Presentation choice: Readers compare the forecast with today's revenue per unit.
When it does not fit: Don't use different contractor counts without defining them.
Bridge Software deck, slide 10. Exact stored slide matched to this analysis.
Our analysis: Our reading: most of the forecast rests on distributors not yet signed and higher revenue per branch.
Evidence and limitation: Return table is internally consistent; branch count passes the signed network in 2016.
What a founder can adapt: Split the forecast into proven, contracted and still to win.
Supporting analysis
What the deck claims: Branches 84 (2015) to '1,764' (2019); revenue to '$52,810,482'; 'Target Raise: $1,000,000 at $6 Million Pre-Money Value'; '19.4X' return.
Presentation choice: Readers test a forecast by asking what it assumes beyond the evidence.
When it does not fit: Don't let the return case rest only on the furthest year.
Each step from pilot to forecast, where it appears and how well it's supported.
Step
Pages
What the deck shows
Our assessment
Pilot repeatable
7
Dated timeline, written processes
Strong
Value to partner
8
+47% order size; new-customer orders
Clear; sample size missing
Partner commits
6
SRS rollout; Richards adding branches
Strong; contract unsigned
Live baseline
9
14 branches, $4,845 in June
Honest
Units forecast
10
84 to 1,764 branches
Passes signed network in 2016
Revenue per unit
9, 10
About $4,200 to about $30,000 a year
Rise not explained
Ask
10
$1M at $6M pre-money
Stated; not tied to a milestone
Key Takeaways
Date the pilot step by step, and report results per unit.
Show the signed network the rollout can reach, as a number.
Mark where the forecast goes beyond signed partners.
Keep revenue per unit close to what the pilot shows, or explain the rise.
Tie the ask to the next proof point, not only to the five-year total.
Build your pilot-to-forecast bridge
Fill in each line. Any line you can't fill is the proof your forecast still needs.
Pilot result per unit. What one unit (branch, site, team) produced, and over what period.
Repeatability. The dated steps that turned the pilot into a process.
Signed network. How many units signed partners give you access to.
Forecast split. Units and revenue from proven, contracted and still-to-win sources.
Revenue per unit. Today's figure, the forecast figure, and the reason for any rise.
Next milestone. What the raise proves next, and by when.
Copyable framework: Our pilot with [partner] produced [result] per [unit] over [period]. [Partner] has agreed to roll out to [units]. Our forecast reaches [units] by [year]: [x] from live units, [y] from signed partners, [z] still to win. Revenue per unit rises from [today] to [forecast] because [reason]. This raise gets us to [milestone] by [date].
After: [Live] branches today; [signed] reachable through signed partners; [remaining] assumed from distributors we are piloting with.
What improved: Our illustrative rewrite. Bracketed values are placeholders, not Bridge Software's figures; it shows the reader which part of the forecast rests on evidence.
The question this guide answers
Our Bridge Software teardown summarises the deck as a vertical software play for home-improvement supply. Three existing guides use one slide each: our proptech competition guide uses page 3, our traction guide uses page 8, and our investor-returns guide uses page 10's return table. None follows the evidence from the pilot through to the forecast. Our other walkthroughs answer different questions: Accurx (adoption to paid conversion), Vajro (company history), Deep Render (one benchmark), Front (efficiency versus the ask), Smartcat (replacing an industry model), Superintelligent (a subscription derived from the problem) and 100Plus (who pays whom).
This guide asks: how does a deck scale one pilot into a multi-year forecast, and how can a reader tell which part of the forecast the pilot actually supports?
How we read the deck
We rendered all 13 pages of the original deck file held in our library and read each at full size. The deck is undated, but page 10's investment table dates the round '15-Sep-15' and its results run 'Through 6/30/2015', so it was prepared in mid-2015. It was posted to SlideShare on 10 August 2015. Bridge Software LLC is a private company; page 12 describes the raise as a private offering to accredited investors. Earlier seed investments of $200,000 (August 2013) and $400,000 (April 2014) were reported publicly, consistent with page 10's 'Seed capital raised to date: ~ $1,000,000'; we found no public report of whether this round closed, so we make no claim about the outcome.
Nothing on the slides is blurred or redacted. Page 1 shows the product name, Stagistics, with 'Created By bridge'.
Step one: a dated pilot with per-unit results
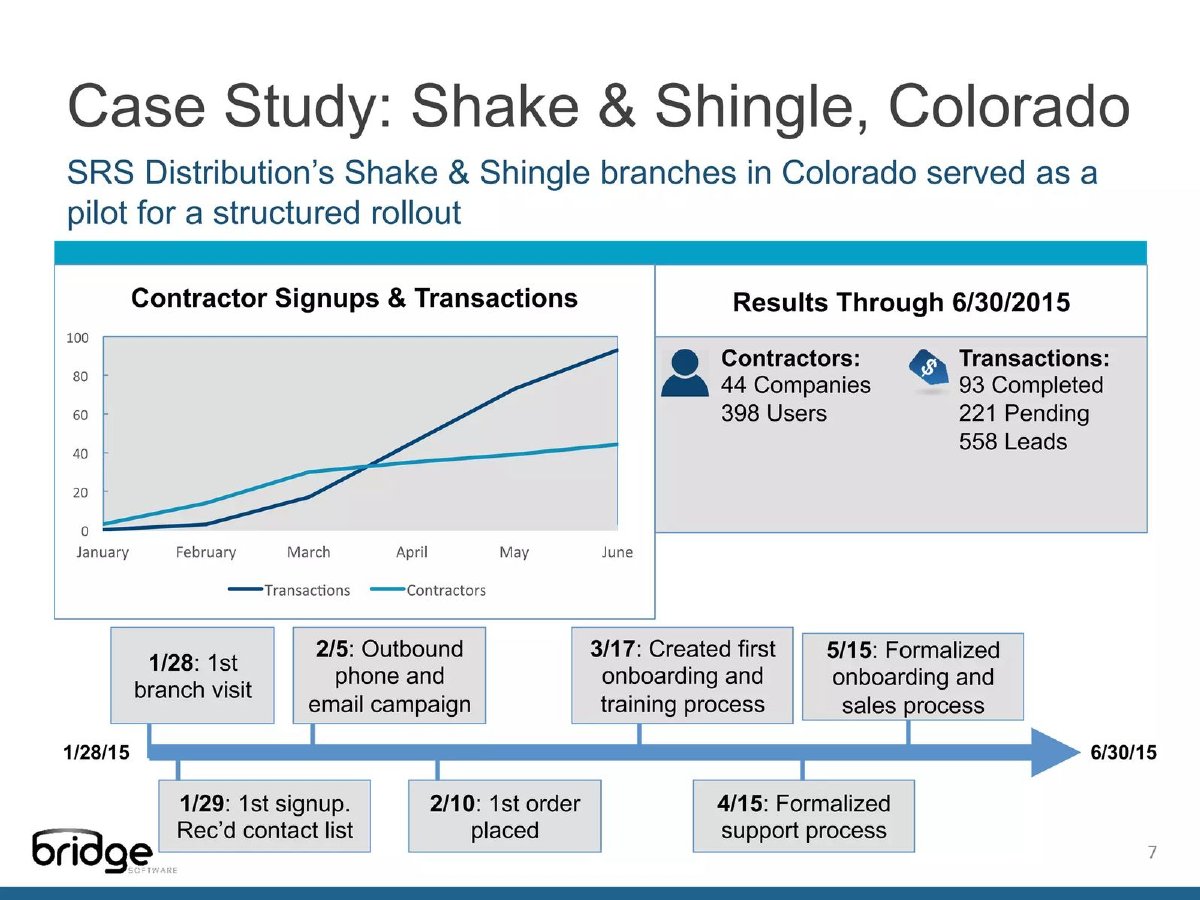
Page 7, 'Case Study: Shake & Shingle, Colorado', says SRS Distribution's branches there 'served as a pilot for a structured rollout'. A timeline runs from '1/28: 1st branch visit' and '1/29: 1st signup' through '2/10: 1st order placed', '3/17: Created first onboarding and training process', '4/15: Formalized support process' and '5/15: Formalized onboarding and sales process'. Results through 30 June 2015: 'Contractors: 44 Companies, 398 Users'; 'Transactions: 93 Completed, 221 Pending, 558 Leads'.
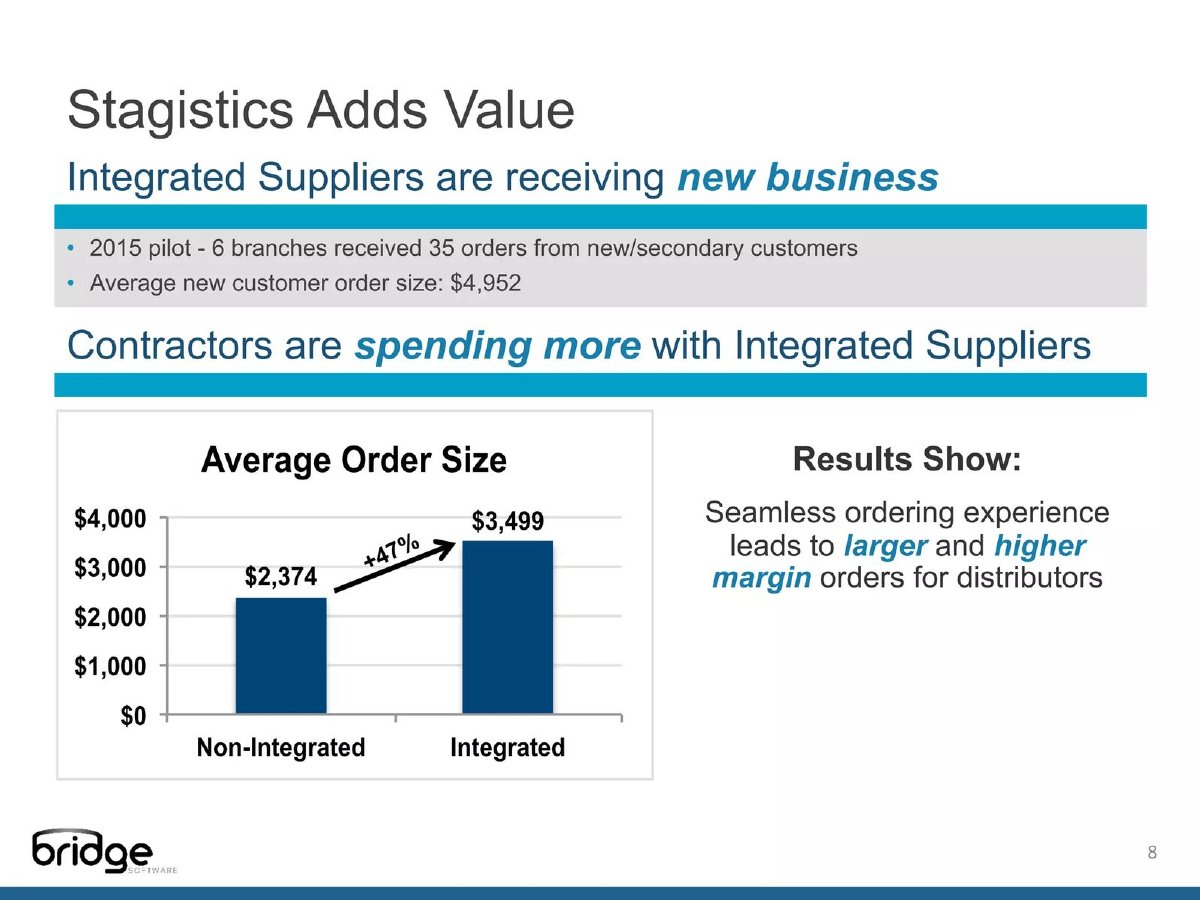
Page 8 adds what the pilot means for the distributor: '2015 pilot - 6 branches received 35 orders from new/secondary customers', 'Average new customer order size: $4,952', and an average order of '$3,499' when integrated against '$2,374' when not, labelled '+47%' (our check: 3,499 ÷ 2,374 ≈ 1.47).
Our reading: this is the deck's best evidence, because each step has a date and the process was written down before the rollout. Investors can see the pilot became repeatable, not just successful. What isn't said is how many branches the 44 companies came from, or what share of pending transactions usually complete.
Step two: from pilot to rollout agreement
Page 6, 'Go-To-Market Strategy', records the commercial path. SRS ('152 Branches in 38 U.S. States') went from 'Dec. 2014 - Signed 6 month pilot to test Stagistics in 10 branches' to 'March 2015 - Invoiced 1st integrated deliveries' and 'May 2015 - SRS agreed to conclude pilot and roll out to all branches', and Bridge is 'In the process of signing contract worth up to $400,000 with first payment expected in 3Q15'. Richards Building Supply ('60 Branches in 12 U.S. States') integrated in 5 branches in January 2015, asked for 3 more in April and 14 more in August.
Our reading: the deck links the pilot to a decision by the partner, which is the strongest kind of follow-on evidence. Two details are worth a reader's attention: the SRS contract is 'up to' $400,000 and not yet signed, and the deck doesn't say over what period.
Step three: what is live today
Page 9, 'Progress to Date', shows monthly deliveries for January to June 2015, split integrated and non-integrated (June: 89 and 178), and revenue rising from $1,277 in January ($1,250 monthly fee plus $27 in transaction fees) to $4,845 in June ($2,000 plus $2,845). It notes: 'Results to date reflect contributions from only 14 integrated branches and 19 contractors', followed by '17 SRS/RBS branches integrated but not active', '188 SRS/RBS branches not yet integrated' and 'Pilot with ABC Supply started in July 2015'.
Our reading: this page is honest about scale, which is a strength. Adding the three branch counts gives 219, slightly more than the 212 implied by page 6 (152 plus 60). Branch numbers change and the pages may count at different dates, so we note the difference, not an error. The '19 contractors' here and the '44 Companies' on page 7 are also different counts: page 9 appears to count contractors contributing to revenue, page 7 those signed up. The deck doesn't define either.
Step four: the forecast outruns the signed network
Page 10's table forecasts 'Integrated Supplier Branches (EOP)' of 24 (3Q15), 84 (4Q15), then 324, 684, 1,164 and 1,764 for 2016 to 2019, with 'Revenue - Cash Basis' of $53,964, $129,800, then $3,634,124 (2016) up to $52,810,482 (2019), and free cash flow turning positive in 2017 ('$3,634,285').
Our reading: up to about 219 branches, the forecast rests on partners the deck names and a rollout agreement it describes. From 2016 onward it needs distributors that aren't signed. The deck mentions ABC Supply's July 2015 pilot but doesn't say how many branches it adds, or which others are assumed.
Revenue per branch rises as well. June 2015 revenue of $4,845 across 14 active branches is roughly $4,200 a year per branch; 2019's forecast works out to roughly $30,000 per branch (using end-of-year branches, which understates the average slightly). Some of the rise is a second revenue line: 'RoofIQ Transaction Fees', from a product page 6 says was 'formed' in June 2015 with CoreLogic, paying Bridge '$40 per transaction', starts at $0 and reaches $14,248,872 in 2019. Even without RoofIQ, Stagistics fees per branch rise several times over. Neither assumption is wrong in itself, but the deck shows no pilot evidence for either.
Step five: the ask and the return case
Page 10 sets a 'Target Raise: $1,000,000 at $6 Million Pre-Money Value', notes 'Seed capital raised to date: ~ $1,000,000', and says funds go to 'employee payroll, mobile app development and increased travel and marketing expenses'. An 'Investment Return Potential' table applies 2019 EBITDA of '$18,132,594' and a 'Terminal Year Firm Equity Value' of '$177,553,252' to three entry dates, giving a return of '19.4X' and '102%' IRR for this round.
We checked the table: 11.5% of $177.6 million is about $20.4 million, and the '19.4X' is that value less the $1 million invested, divided by the investment. The table is internally consistent. Its weakness is that the whole return rests on the 2019 column, which, as above, depends mostly on partners not yet signed.
Recommendation: tie the raise to the next proof point the pilot evidence can support, for example the number of SRS branches live and the revenue per branch by a date, and present the five-year return as a scenario that follows from those milestones.
When this structure is the right choice
Our view, drawing on this deck: building from one pilot to a forecast works when the pilot is dated, repeatable and measured per unit, and when a partner has already agreed to roll out. It's weaker when the forecast's unit count passes the signed network early and revenue per unit rises without evidence. Bridge Software's deck has the hard part, a documented pilot and a rollout decision, and would be more convincing if the forecast showed which part rests on them.
Common mistakes
A forecast past the signed network. Mark which units depend on partners not yet signed.
Rising revenue per unit without evidence. Start from the pilot's figure and explain any rise.
Undefined counts. Say whether 'contractors' means signed up or paying.
Vague contract value. Give the amount, whether it's signed, and the period.
Return case on the last year only. Tie the ask to a near-term milestone.
Diagnostic checklist
The pilot is dated and reported per unit.
The steps that made it repeatable are shown.
The partner's rollout decision and network size are stated.
Live units and revenue per unit are side by side.
The forecast separates proven, contracted and still-to-win.
The ask names the next milestone.
Frequently asked questions
How do I turn a pilot into a forecast in a pitch deck?
Report the pilot's result per unit, show how many units signed partners give you, and split the forecast into what is proven, contracted and still to win. Bridge Software's deck shows the first two on pages 6 to 9 and merges all three in page 10's forecast.
Is it a problem if my forecast exceeds my signed partners?
Not if you say so. Bridge Software's forecast passes its two named distributors' roughly 219 branches in 2016 without saying which other distributors make up the rest.
Should revenue per unit stay flat in a forecast?
It can rise, but explain why. Bridge Software's revenue per branch rises from roughly $4,200 a year in June 2015 to roughly $30,000 in its 2019 forecast, partly from a new product with no revenue yet.
What makes a pilot convincing?
Dates, written processes and a partner's follow-on decision. Bridge Software's page 7 timeline and page 6 rollout agreement do this well.
Did Bridge Software raise this round?
We found no reliable public report. The deck asks for $1 million at a $6 million pre-money value, and one deck can't show what investors decided.
How we chose these examples
Selection (2026-10-02): saved lead from the previous run, checked for a pilot-to-rollout argument. Distinctness check: the teardown summarises the business; the proptech competition guide uses page 3, the traction guide page 8, the investor-returns guide page 10, each alone; no guide follows the evidence from pilot to forecast; the other walkthroughs answer different questions.
All 13 pages of the original deck file (sha256 1001c61c…, matching our inventory) were rendered and read at full size (AI editorial model review, not human). Five images are used (pages 6 to 10): pages 7 and 9 were stored for this draft on 2026-10-02; pages 6, 8 and 10 reuse images already in our library. Per-branch figures, branch totals, the +47% and the return multiple were recomputed from printed numbers.
Eligibility: Bridge Software LLC is a private company; the deck was published on SlideShare and is already in our library with an existing teardown; no takedown request is recorded. Page 12's notice describes a private offering and asks that the material not be reproduced; we quote and show the slides for commentary, as our existing teardown and guides already do. Nothing on the slides is blurred or redacted.