Viral Growth and Referral Slide Examples: How to Prove
How to show investors that your product spreads from user to user: the referral step, the conversion at each step, the cost and value of a referral.
Viral Growth Slide: Show the Loop, the Conversion at Each Step and What It Costs
"Viral" is one of the most common words in consumer and product-led decks, and one of the least supported. Investors hear it as a claim that each user brings in more users, so growth costs less over time. To believe it, they need to see the mechanism: what a user does that exposes someone new, how many of those people join, and how many of those pay. This guide uses five real slides, from a rent-payments company that puts a price on each referral to a slide that calls itself viral with its key numbers left blank.
TL;DR
Draw the loop as steps, put a conversion figure on each step, and define every number. Boom does this best: referrals from 170+ affiliates turn into accounts, 31% of referrals become paying users and 15% of those use a second product, with $45.60 of revenue per referral against $15.00 cost per converted referral (3.0x). Cerca reports 7.8 referrals per user without saying what a referral is. BlueOcean explains a believable spread through consultants and departing employees but gives no count. Bunch and Alice Tech label growth as viral or plan to grow by virality without showing a loop.
Five viral and referral growth slides, read in full
Each example quotes the slide, separates the company's claims from what the slide shows, and notes what to copy and what to avoid.
Boom go to market slide — slide 7
Rent reporting and credit building for renters. Slide titled "We've found scalable distribution through partners & are acquiring users at >3x LTV:CAC to start our flywheel".
Boom deck, slide 7. Exact stored slide matched to this analysis.
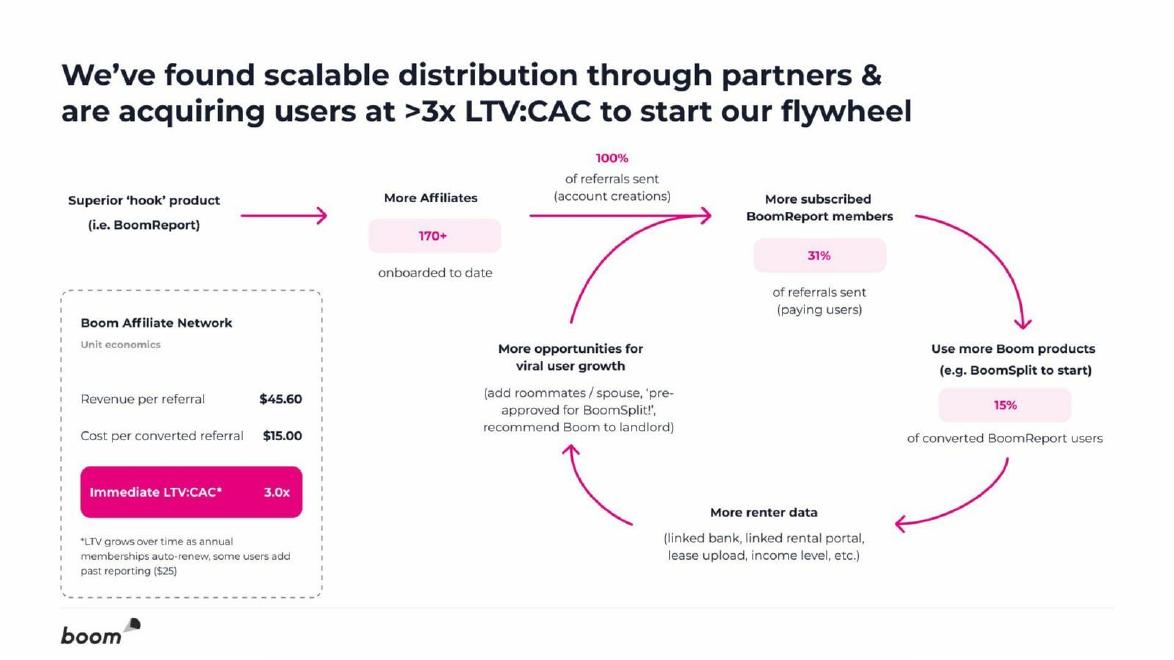
Our analysis: A priced loop with a conversion at each step; $45.60 / $15.00 = 3.04 (our calculation).
Evidence and limitation: Company figures; whether revenue and cost share a denominator is not stated.
What a founder can adapt: Put revenue and cost on the same base and separate affiliate from user-to-user referrals.
Supporting analysis
What the deck claims: "170+ onboarded to date" affiliates; "100% of referrals sent (account creations)"; "31% of referrals sent (paying users)"; "15% of converted BoomReport users"; "Revenue per referral $45.60"; "Cost per converted referral $15.00"; "Immediate LTV:CAC 3.0x".
Presentation choice: Investors can follow each step and see the money in and out.
When it does not fit: Calling an affiliate channel viral without a user-to-user figure.
Brand-tracking software. Slide titled "Brand Tracking is viral".
BlueOcean deck, slide 11. Exact stored slide matched to this analysis.
Our analysis: Three specific routes by which a business product could spread.
Evidence and limitation: Qualitative mechanism; no counts; curve has no values.
What a founder can adapt: Add the share of new accounts that came through an existing user.
Supporting analysis
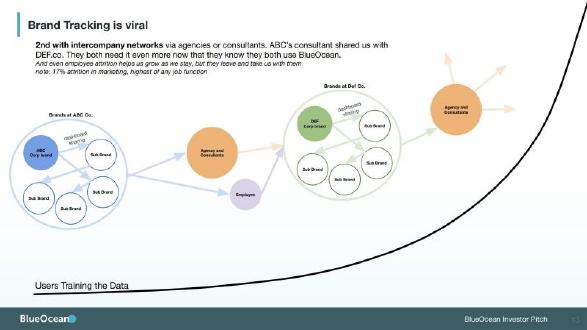
What the deck claims: Dashboard sharing across sub-brands; "2nd with intercompany networks via agencies or consultants. ABC's consultant shared us with DEF.co."; "employee attrition helps us grow as we stay, but they leave and take us with them"; "17% attrition in marketing, highest of any job function".
Presentation choice: Gives investors a believable mechanism they can test in diligence.
When it does not fit: Using a job-market statistic in place of customer data.
Social app. Slide titled "The road to 100k downloads".
Bunch deck, slide 15. Exact stored slide matched to this analysis.
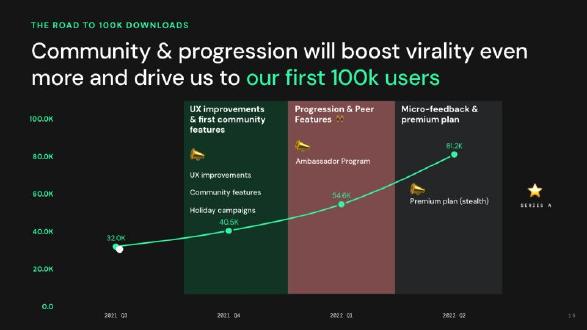
Our analysis: Quarterly growth of about 27%, 35% and 49% (our calculation), labelled viral without a loop.
Evidence and limitation: Actual and forecast points not distinguished; no referral figure.
What a founder can adapt: Mark forecasts and add invites or referred sign-ups per period.
Supporting analysis
What the deck claims: "Community & progression will boost virality even more"; 32.0K (2021 Q3), 40.5K, 54.6K, 81.2K (2022 Q2); periods "UX improvements & first community features", "Progression & Peer Features" with "Ambassador Program", "Micro-feedback & premium plan".
Presentation choice: Ties each growth period to a named feature.
When it does not fit: Attaching the word virality to a download curve.
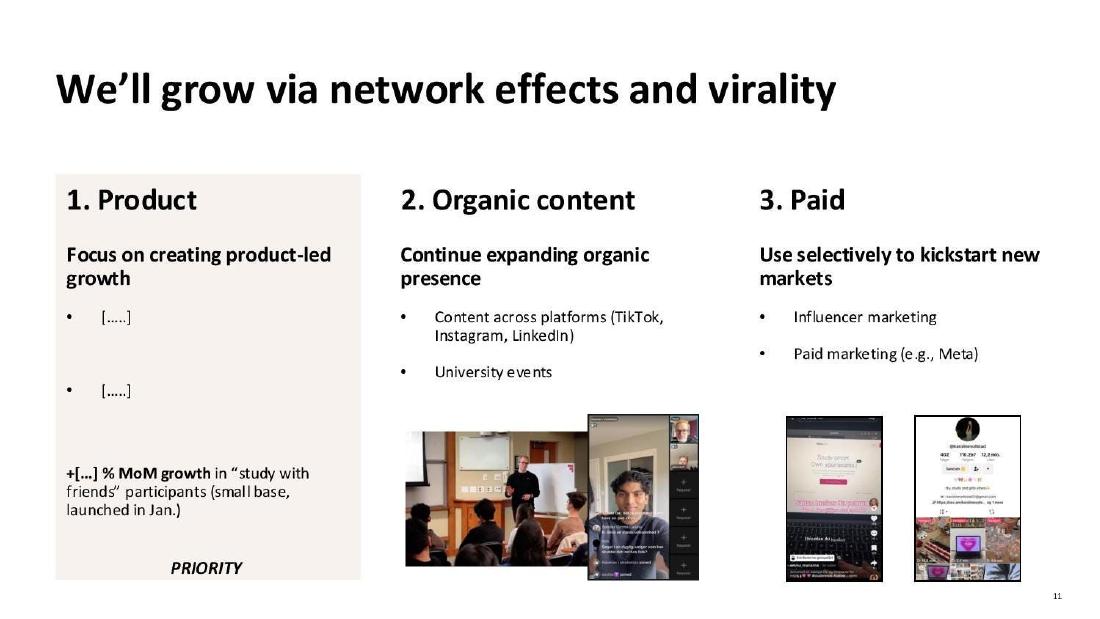
Study app. Slide headed "We'll grow via network effects and virality".
Alice Tech deck, slide 11. Exact stored slide matched to this analysis.
Our analysis: A sensible channel order with a feature that could create a loop, but no loop figures.
Evidence and limitation: Key figure blank in the shared version.
What a founder can adapt: Show invites per participant and the share of invitees who join.
Supporting analysis
What the deck claims: "1. Product" ("PRIORITY"): "Focus on creating product-led growth", bullets shown as "[.....]", "+[...] % MoM growth in 'study with friends' participants (small base, launched in Jan.)"; "2. Organic content"; "3. Paid": "Use selectively to kickstart new markets".
Presentation choice: Names a specific sharing feature and is honest about the small base.
When it does not fit: Sharing a slide whose only supporting number is blank.
Whether each slide shows the loop's steps, a referral figure and the cost or value of a referral.
Example
Loop steps shown
Referral figure
Cost or value
Boom
Yes, with conversions
31% become paying
$45.60 vs $15.00
Cerca
No
7.8 per user (undefined)
No
BlueOcean
Described, no counts
No
No
Bunch
No
No
No
Alice Tech
No
Blank
No
Key Takeaways
Show the loop step by step: share, join, pay.
Put a conversion figure on every step.
Define what counts as a referral or invite.
Give the cost and value of a referred user, on the same base.
Do not call growth viral without a referral number.
Build your viral growth slide
Answer these before you use the word viral.
Action. What does a user do that exposes a new person to the product?
Steps. For a recent group of users, how many shared, how many people they reached, how many joined and how many stayed active or paid?
Rate. How many new active users does each existing user bring in, over what period?
Money. If referrals are rewarded, what does each referred paying user cost and earn, on the same base?
Copyable framework: Users [action]. Of [cohort] users in [period], [share] shared, reaching [number]; [share] joined and [share] became [active or paying]. Each user brings [number] new active users in [period]. Reward cost per referred paying user: [cost]; first-year revenue: [value].
Illustrative example 1 — written by us
Before: Our product is inherently viral and will grow through network effects.
After: Users invite classmates to shared study rooms. Of 4,000 users who joined in March, 38% sent an invite, reaching 5,100 people; 22% joined and 61% of those were still active after 30 days. Each user brings 0.17 new active users in their first month. We pay no reward.
What improved: Our illustrative rewrite; all figures are invented for the example. It names the sharing action, counts each step for a stated group and gives a per-user figure investors can compare.
The question this guide answers
Founders reach for the word viral when they believe the product spreads on its own. Investors want to know whether that spread is real, how strong it is and whether it will last. The organic growth guide in this library covers the share of customers who arrive without paid marketing. This guide covers the mechanism behind one kind of organic growth: users or customers bringing in other users, whether through a paid referral programme, a product that needs other people to work, or sharing that happens in normal use.
The difference matters for the slide. An organic share tells investors how much growth is unpaid. A viral loop tells them why, and whether it compounds. If each user brings in, on average, more than one new user who also stays, growth feeds itself. If the figure is well below one, sharing lowers acquisition cost but does not replace other channels. A slide that shows the steps lets investors judge which case they are looking at.
How we chose and read the examples
We searched the extracted text of the slide library for slides that mention referrals, invites, viral growth or a viral coefficient, and read each candidate at full size; two small slides were enlarged further to confirm their wording. We kept five slides: one that prices its referral loop, one that reports a referral rate, one that explains a spreading mechanism in words and diagrams, one that labels a growth curve as viral, and one that lists virality as its strategy. We dropped a slide whose only mention of virality was sample text in a product screenshot.
We quote what is visible on each slide. We have not checked any company's figures against other sources, and we make no claim that any slide affected a fundraising result. Where we work out a figure, we show the arithmetic and say it is ours.
Price the loop, step by step
Boom, which helps renters build credit from rent payments, titles its slide "We've found scalable distribution through partners & are acquiring users at >3x LTV:CAC to start our flywheel". The loop starts with a "Superior 'hook' product (i.e. BoomReport)" and "More Affiliates": "170+ onboarded to date". Then each step carries a figure: "100% of referrals sent (account creations)"; "31% of referrals sent (paying users)"; "15% of converted BoomReport users" go on to use more Boom products, such as BoomSplit. The loop closes with "More renter data" and "More opportunities for viral user growth (add roommates / spouse, 'pre-approved for BoomSplit!', recommend Boom to landlord)".
A box headed "Boom Affiliate Network, Unit economics" adds "Revenue per referral $45.60", "Cost per converted referral $15.00" and "Immediate LTV:CAC 3.0x", with a note that lifetime value "grows over time as annual memberships auto-renew, some users add past reporting ($25)". The ratio checks out: $45.60 divided by $15.00 is 3.04.
This is the structure every viral or referral slide should copy: a starting point, a figure at each step, and the money in and out. Two points need tightening. First, the denominators. Revenue is given per referral and cost per converted referral; if the first means every referral sent and the second only the 31% who pay, the two are on different bases and the 3.0x is not a like-for-like ratio. The slide should say which. Second, most of the loop is affiliate-driven, which is a partner channel rather than users inviting users. The user-to-user part, adding roommates or recommending Boom to a landlord, has no figure yet. Saying so plainly would be more convincing than labelling the whole loop viral.
Define the referral before you report the rate
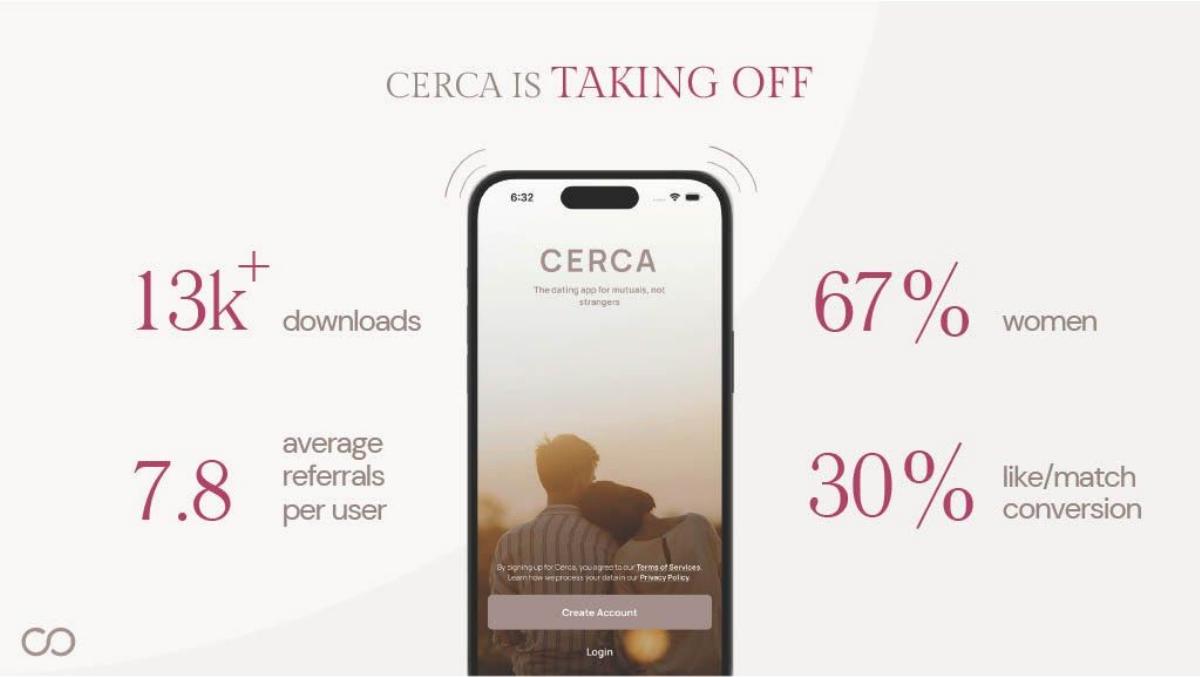
Cerca, a dating app built around mutual friends, has a slide headed "Cerca is taking off" with four figures: "13k+ downloads", "67% women", "7.8 average referrals per user" and "30% like/match conversion".
A referral rate is exactly the kind of number a viral claim needs, and 7.8 per user would be extraordinary if each referral were a new user. But the slide does not say what a referral is. If 13,000 users each brought 7.8 new users, the app would have about 100,000 users from referrals alone (our calculation), far more than the 13k downloads shown. So a referral here most likely means an invitation sent or a friend suggested, not a person who joined. That is still useful, but investors need the next step: what share of referrals download the app, and what share of those become active. Without it, 7.8 measures sharing, not growth.
Explain the mechanism when you cannot yet count it
BlueOcean, which sells brand-tracking software, uses a slide titled "Brand Tracking is viral". It describes spread in two ways. First, inside a company: a diagram shows a corporate brand sharing its dashboard with sub-brands. Second, between companies: "2nd with intercompany networks via agencies or consultants. ABC's consultant shared us with DEF.co. They both need it even more now that they know they both use BlueOcean." It adds a third route: "And even employee attrition helps us grow as we stay, but they leave and take us with them", with a note of "17% attrition in marketing, highest of any job function". A rising curve labelled "Users Training the Data" sits behind the diagram.
This is qualitative evidence, and it is valuable for what it shows: a specific, believable reason a business product might spread, through dashboard sharing, consultants who work for several clients, and marketers who change jobs. Investors can test each route in diligence. What the slide cannot establish is how often any of it happens. It gives no count of accounts that came through a consultant or a former employee, and the curve has no axis values. The 17% attrition figure describes the job market, not BlueOcean's customers. One figure, such as the share of new accounts that named an existing user as their source, would turn the story into evidence.
A growth curve is not a viral loop
Bunch, a social app, titles its slide "The road to 100k downloads" and "Community & progression will boost virality even more and drive us to our first 100k users". A curve runs from 32.0K in 2021 Q3 to 40.5K in Q4, 54.6K in 2022 Q1 and 81.2K in Q2, with the Series A marked just after. Three shaded periods name the features meant to drive each step: "UX improvements & first community features" (with community features and holiday campaigns), "Progression & Peer Features" (with an "Ambassador Program") and "Micro-feedback & premium plan".
From the slide's figures, growth per quarter rises from about 27% to 35% to 49% (our calculation). Linking each period to a named feature is a good habit, because it tells investors what the team believes will drive growth. But the slide does not say which points are actual and which are forecast, and it gives no referral or invite figure at all. The word "virality" is attached to a download curve, which could be driven by any channel. An ambassador programme is also a recruited, often rewarded channel rather than spontaneous sharing; it needs its own cost and results.
A strategy list with the numbers left out
Alice Tech, a study app, uses a slide headed "We'll grow via network effects and virality". It lists three channels in order. "1. Product", marked "PRIORITY": "Focus on creating product-led growth", with two bullet points shown only as "[.....]" and a line reading "+[...] % MoM growth in 'study with friends' participants (small base, launched in Jan.)". "2. Organic content": content on TikTok, Instagram and LinkedIn, and university events. "3. Paid": "Use selectively to kickstart new markets", through influencer and paid marketing such as Meta.
The order is sensible, and "study with friends" is a specific feature that could create a viral loop: a student invites classmates to study together. The honesty of "small base, launched in Jan." is also welcome. But the one figure that would support the headline is blank in the version shared, and the slide does not say how many invitations a participant sends or how many invitees join. As shared, it is a statement of intent.
Comparing the five slides
Only Boom puts a figure on each step of its loop and attaches money to it. Cerca reports a referral rate without a definition or a join rate. BlueOcean gives a convincing mechanism without counts. Bunch and Alice Tech use the language of virality on top of a download curve and a strategy list.
A complete viral growth slide would combine Boom's step-by-step loop with BlueOcean's clear explanation of why users share, and add the one figure none of the five gives directly: how many new active users each existing user brings in over a stated period.
How to build your own viral growth slide
Start by naming the action that exposes a new person to the product: an invite, a shared document, a referral link, a reward. Then count each step for a recent group of users: how many took the action, how many people they reached, how many of those signed up, and how many became active or paying. Divide new active users by the users who brought them in to get an average per user, and say over what period.
If the loop is rewarded, give the reward cost and the value of a referred user on the same base, for example both per paying user. Keep partner or affiliate referrals separate from users inviting users; they behave differently and investors value them differently. Mark any forecast clearly.
If you cannot count the loop yet, explain the mechanism specifically, as BlueOcean does, and say what you will measure. Investors accept an honest early story more readily than an unsupported word.
Common mistakes
Viral as a label. Do not use the word without a referral figure.
Undefined referrals. Say whether a referral is an invite sent or a person who joined.
Mixed denominators. Put cost and value of a referral on the same base.
Partners counted as virality. Keep affiliate referrals separate from users inviting users.
Blank key figures. Use a range rather than leaving the supporting number empty.
Diagnostic checklist
Sharing action named.
Conversion shown at each step.
Referral defined.
New active users per user stated, with a period.
Reward cost and value on the same base.
Frequently asked questions
What does an investor mean by a viral loop?
A cycle in which existing users bring in new users who in turn bring in more. Investors want to see each step counted, not just the word used.
Is a referral programme the same as virality?
Not quite. A rewarded referral programme is a paid channel with its own cost per user; spontaneous sharing costs nothing. Show them separately.
What if my product is too new to measure sharing?
Explain the specific way you expect it to spread, as BlueOcean does, and say which figure you will report once you have a few months of data.
How we chose these examples
Corpus: published pitch deck teardowns on StartupFundraising.com. Founder-uploaded private decks are excluded.
Selection (2026-10-01): we searched extracted slide text for referrals, invites, viral growth and viral coefficients, read candidates at full size, and kept five slides that each show a distinct way of presenting user-to-user growth. A slide whose only reference was sample text in a product screenshot was excluded.
Review: all five stored slide images were read at full size on 2026-10-01 against company, deck and slide number, with the BlueOcean and Bunch slides enlarged further; our calculations were checked against the visible figures (editorial model review, with AI assistance in drafting). No person has yet completed an editorial review of this page. We did not verify any company's figures.