How e-commerce tools and online stores size their market: sellers × price, share of online sales, or share of your slice.
E-commerce Market Slide: Online Sales, Sellers and the Share You Earn
Online sales totals are huge and easy to quote, which is why so many e-commerce market slides stop there. A startup selling to online shops, or earning a commission on online sales, needs to show the smaller number it can actually earn: sellers times price, or the share of sales it touches times its fee. The slides below run from that kind of calculation to a single forecast with no share of its own.
TL;DR
Count the sellers or sales you serve and multiply by what you charge, or take the share of online sales you touch and multiply by your fee. Synder counts 6.5 million US online businesses and gives a $5.5B yearly market at its current price. Pop Shop (DRF deck) goes from a $25.8B market to its addressable share to its commission. Quoting total online sales alone (iConsumer) doesn't show what the startup earns.
E-commerce market slides from real pitch decks
Each example shows the slide above its analysis and links to the full teardown. Revenue-based calculations come first. Claims are as shown on the slides; comments and calculations are ours.
Synder market slide — slide 4
Accounting sync software for online sellers.
Synder deck, slide 4. Exact stored slide matched to this analysis.
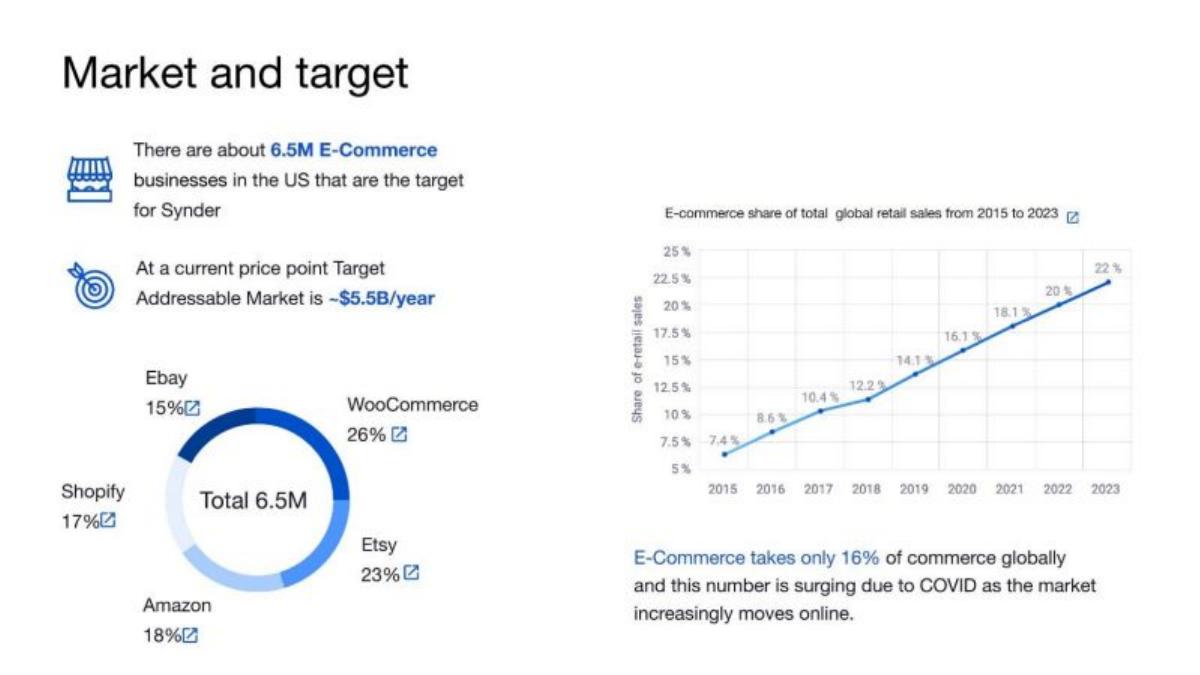
Our analysis: Seller count × current price.
Evidence and limitation: Buyer count × price, the clearest shape here. Our calculations: $5.5B ÷ 6.5M ≈ $850 per business a year (about $70 a month); the slide doesn't state the price. The platform shares add to 99%.
What a founder can adapt: "[N] sellers ([source]) × $[price]/year = $[X]."
Supporting analysis
What the deck claims: "Market and target." "There are about 6.5M E-Commerce businesses in the US that are the target for Synder." "At a current price point Target Addressable Market is ~$5.5B/year." A ring chart splits the 6.5M across platforms: WooCommerce 26%, Etsy 23%, Amazon 18%, Shopify 17%, Ebay 15%. A chart shows e-commerce share of global retail sales rising from 7.4% (2015) to 22% (2023); "E-Commerce takes only 16% of commerce globally."
Presentation choice: The market is revenue Synder could charge, not sales its customers make.
When it does not fit: Leaving the price out so the sum can't be checked.
Pop Shop deck, slide 6. Exact stored slide matched to this analysis.
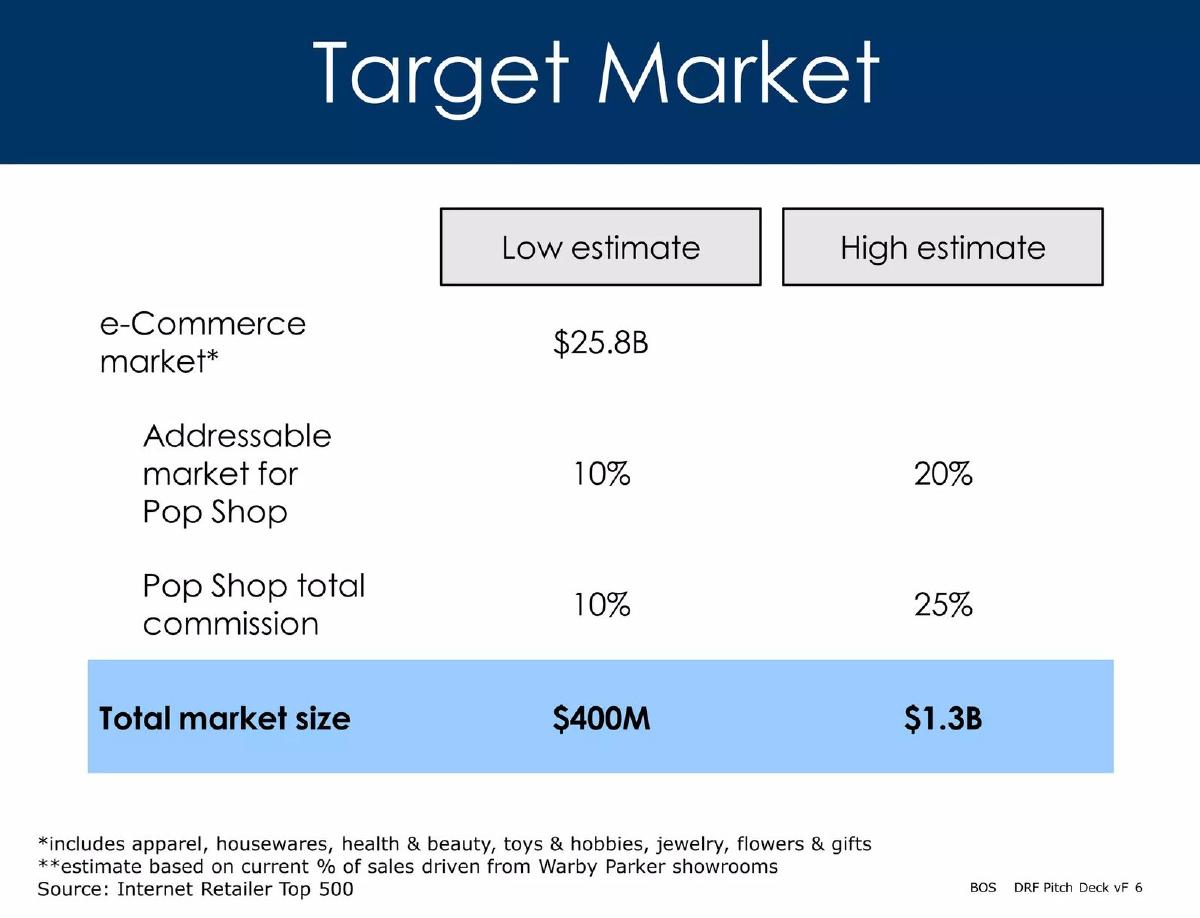
Our analysis: Sales × share × commission, two cases.
Evidence and limitation: Sales total, share and commission, with low and high cases and a sourced basis for the share. Our check: $25.8B × 20% × 25% ≈ $1.3B matches, but $25.8B × 10% × 10% ≈ $258M, not the $400M shown.
What a founder can adapt: "$[sales] × [share]% × [fee]% = $[X] (low) to $[Y] (high)."
Supporting analysis
What the deck claims: "Target Market." "e-Commerce market* $25.8B." "Addressable market for Pop Shop": 10% (low), 20% (high). "Pop Shop total commission": 10% (low), 25% (high). "Total market size": $400M (low), $1.3B (high). Footnotes: the market "includes apparel, housewares, health & beauty, toys & hobbies, jewelry, flowers & gifts"; the share is an "estimate based on current % of sales driven from Warby Parker showrooms"; "Source: Internet Retailer Top 500."
Presentation choice: It turns online sales into revenue Pop Shop would collect.
When it does not fit: A low case that doesn't multiply out.
Order fulfilment for online sellers, UK and Europe.
Huboo deck, slide 4. Exact stored slide matched to this analysis.
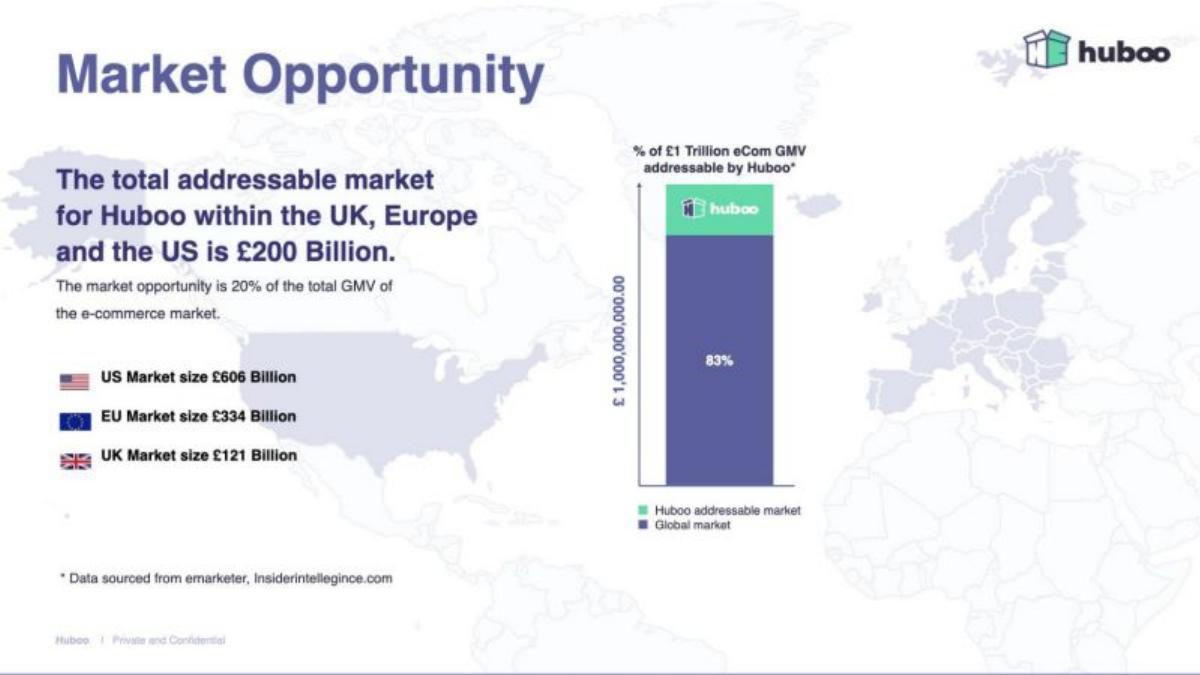
Our analysis: Regional sales × stated share.
Evidence and limitation: Named regions with sourced totals and a stated share. Our check: 606 + 334 + 121 = £1,061B; 20% ≈ £212B, rounded to £200B. The slide doesn't say why fulfilment is worth 20% of sales.
What a founder can adapt: "[Region] sales £[X] ([source]) × [share]% spent on [service] = £[Y]."
Supporting analysis
What the deck claims: "Market Opportunity." "The total addressable market for Huboo within the UK, Europe and the US is £200 Billion." "The market opportunity is 20% of the total GMV of the e-commerce market." "US Market size £606 Billion; EU Market size £334 Billion; UK Market size £121 Billion." "Data sourced from emarketer, insiderintelligence.com."
Presentation choice: Showing the regions and the share lets investors test the total.
iCrowdU deck, slide 5. Exact stored slide matched to this analysis.
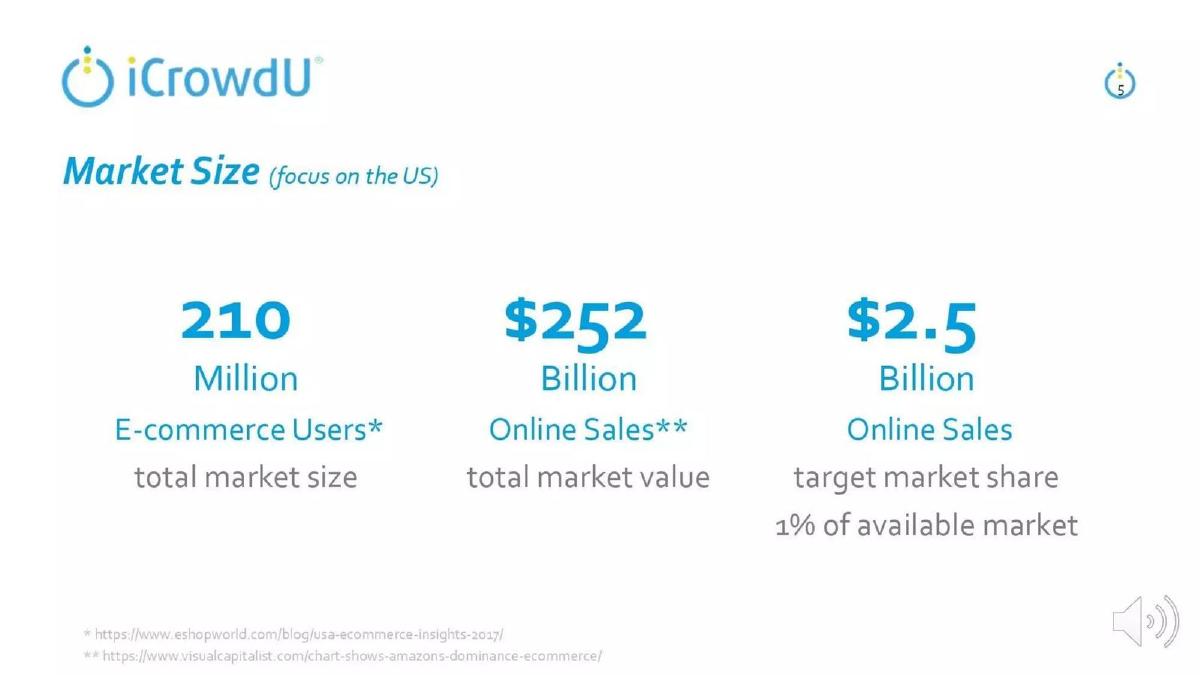
Our analysis: Users, sales and a 1% target.
Evidence and limitation: Users, sales and a target share, sourced. Our check: 1% of $252B = $2.52B, and $252B ÷ 210M ≈ $1,200 per shopper. The $2.5B is sales, not iCrowdU revenue; the slide doesn't say what iCrowdU earns on them.
What a founder can adapt: "[Share]% of $[sales] = $[X] in sales × [fee]% = $[Y] revenue."
Supporting analysis
What the deck claims: "Market Size (focus on the US)." "210 Million E-commerce Users — total market size." "$252 Billion Online Sales — total market value." "$2.5 Billion Online Sales — target market share, 1% of available market." Sources cite ewshopworld and visualcapitalist.
Presentation choice: It narrows to a target, but stops at sales rather than revenue.
When it does not fit: Calling others' sales your market.
Online store for tools and home-improvement supplies, India.
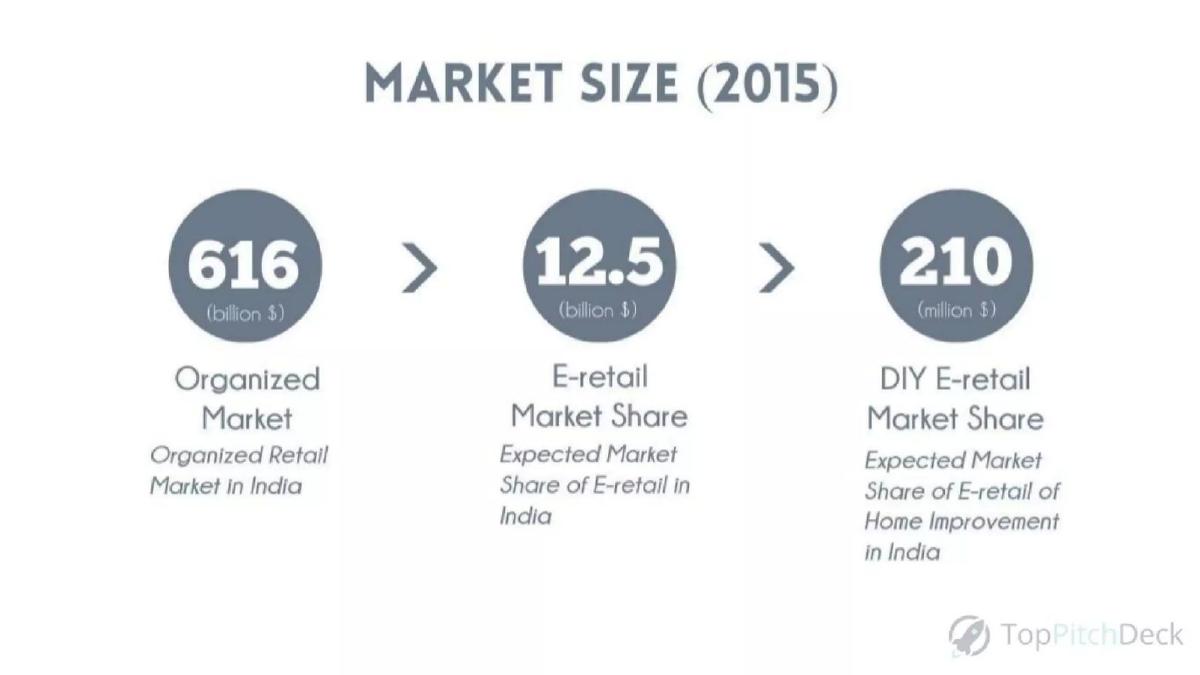
Urjakart deck, slide 6. Exact stored slide matched to this analysis.
Our analysis: Retail › online › own category.
Evidence and limitation: Three steps from retail to its own category. Our calculations: e-retail is about 2% of the retail figure, and home improvement about 1.7% of e-retail. No sources or years beyond 2015 are shown.
What a founder can adapt: "Retail $[X] › online $[Y] › [category] $[Z] ([source, year])."
Supporting analysis
What the deck claims: "Market Size (2015)." "616 (billion $) Organized Market — Organized Retail Market in India" › "12.5 (billion $) E-retail Market Share — Expected Market Share of E-retail in India" › "210 (million $) DIY E-retail Market Share — Expected Market Share of E-retail of Home Improvement in India."
Presentation choice: Each step narrows toward what Urjakart sells.
Freshmart deck, slide 4. Exact stored slide matched to this analysis.
Our analysis: Country total and a sales target.
Evidence and limitation: It names the country and a four-year target. Our calculation: $1.3M is 0.1% of $1.3B. The slide gives no source, doesn't size online grocery, and still shows the template text "Market Opportunity Header".
What a founder can adapt: "Online grocery in [country]: $[X] ([source]); year-4 target $[Y]."
Supporting analysis
What the deck claims: "03. Market Opportunity." "$1.3B Total e-commerce market." "$1.3M Freshmart market." "Market Opportunity Header." "Egypt's total e-commerce market is worth $1.3 billion." "Our target is reach the total transactions equal to $1.3 million in Egypt through 4 years."
Presentation choice: A modest target is credible; the missing grocery figure isn't.
When it does not fit: Leaving template text on the slide.
iConsumer deck, slide 2. Exact stored slide matched to this analysis.
Our analysis: Sourced sales forecast and category spend.
Evidence and limitation: Weaker example. The $7B figure is the useful one: what retailers pay companies like iConsumer (about 1.4% of $500B, our calculation). It is sourced, but the slide doesn't show iConsumer's own share or what it keeps after paying shoppers.
What a founder can adapt: "Retailers pay $[X] for [service] ([source]); we keep [Y]% of [share]."
Supporting analysis
What the deck claims: "Total Addressable Market." "Forrester predicts that by 2020, US ecommerce sales will hit $500 billion." "Retailers pay iConsumer to drive shoppers to their sites and stores." "iConsumer shares those revenues with the shopper." "Retailers will pay an estimated $7 Billion to iConsumer and its competitors for those sales (Forrester)."
Presentation choice: The category spend is right; iConsumer's reach is missing.
When it does not fit: Stopping at a category total shared with competitors.
Before: "Forrester predicts that by 2020, US ecommerce sales will hit $500 billion."
After: "Retailers pay $7B for referral sales (Forrester); at [share]% and a [fee]% cut we'd earn $[X]."
What improved: Our illustrative rewrite of iConsumer's slide; bracketed text is a placeholder, not company fact.
What's different about e-commerce market sizing
Online sales figures are widely published, so the top number is easy. Most e-commerce startups earn a fee per seller or a percentage of sales, not the sales themselves. A useful slide separates the sales total from the revenue the startup could collect.
What investors check
Whether the number is revenue to the startup or sales by others. Whether the seller count or sales total is sourced. Whether the share and fee assumptions are stated and multiply correctly. Which country or region comes first.
How we read each slide
We quote the text on the slide images and mark our own arithmetic as ours. We have not checked any market figure or source. Page numbers are pages in the original deck file. All seven images were already stored and were checked pixel-for-pixel against fresh renders of the decks.
Common mistakes
Others' sales as your market. Show the fee or price you collect.
Sums that don't match. Multiply every row before you present it.
Unsourced shares. Say where each percentage comes from.
Template text left in. Remove placeholder headings.
Diagnostic checklist
Seller count or sales total, sourced.
Price or fee stated.
Every row multiplies out.
Launch country named.
Revenue to you, not just sales.
Frequently asked questions
How should an e-commerce startup size its market?
Count the sellers you serve × your price, or online sales × the share you touch × your fee. Synder uses 6.5M US sellers at its current price for $5.5B a year.
Can I use total online sales as my market?
Only as context. Most e-commerce startups earn a fee, not the sales; show the revenue you'd collect.
How we chose these examples
Corpus: published pitch deck teardowns on StartupFundraising.com. Founder-uploaded private decks are excluded.
Selection (2026-09-26): we searched teardown slide text for market-size wording together with e-commerce or retail terms, kept slides from online-selling businesses with stored images, reviewed ten from the deck files and kept seven.
Excluded: Huboo p5 and iCrowdU p6 (repeat the same deck's figures), Room2Shop p6 (a chart with no market claim of its own), Home Furnishings p5 (same slide as HomeRoots, already in the TAM-SAM-SOM guide). Slides already used in other guides were not reused.
Page numbers are pages in the original deck files. All seven images were already stored and were checked pixel-for-pixel against fresh renders on 2026-09-26.
Market figures and sources are quoted from the slides and not independently verified. Calculations (sums, per-unit figures, shares) are ours and marked as such.
Review: slide images were checked on 2026-09-26 and matched to company, deck and page (editorial model review). No person has yet completed an editorial review of this page. We make no claim that any slide caused a fundraising outcome.