Logistics Market Size Slides: 5 Real Freight Examples
How freight, trucking and delivery startups size their market: sourced funnels, fleet counts, niche carve-outs and fragmentation charts.
Logistics Market Slide: Size the Freight You Can Actually Move
Logistics spend is measured in trillions, so a headline total says almost nothing about what one startup can win. What investors want is the slice you serve: a mode, a lane, a cargo type or a fleet size, and how split up the competition is. The five slides below range from a sourced top-down funnel to a list of unsourced forecasts from different markets.
TL;DR
Start from a sourced total, cut it to the freight you actually move (country, mode, cargo type or fleet size), and show how fragmented that slice is. Shiplyst steps from $164bn global freight forwarding to a $5.5bn Indian addressable market, citing a source for every line. Daseke shows a $133bn US open-deck market where 99.2% of carriers run under 100 tractors. AtoB counts fleets and rivals instead of dollars.
Logistics market slides from real pitch decks
Each example shows the slide above its analysis and links to the full teardown. The clearest sizing comes first; the weakest is last for contrast. Claims are as shown on the slides; comments and calculations are ours.
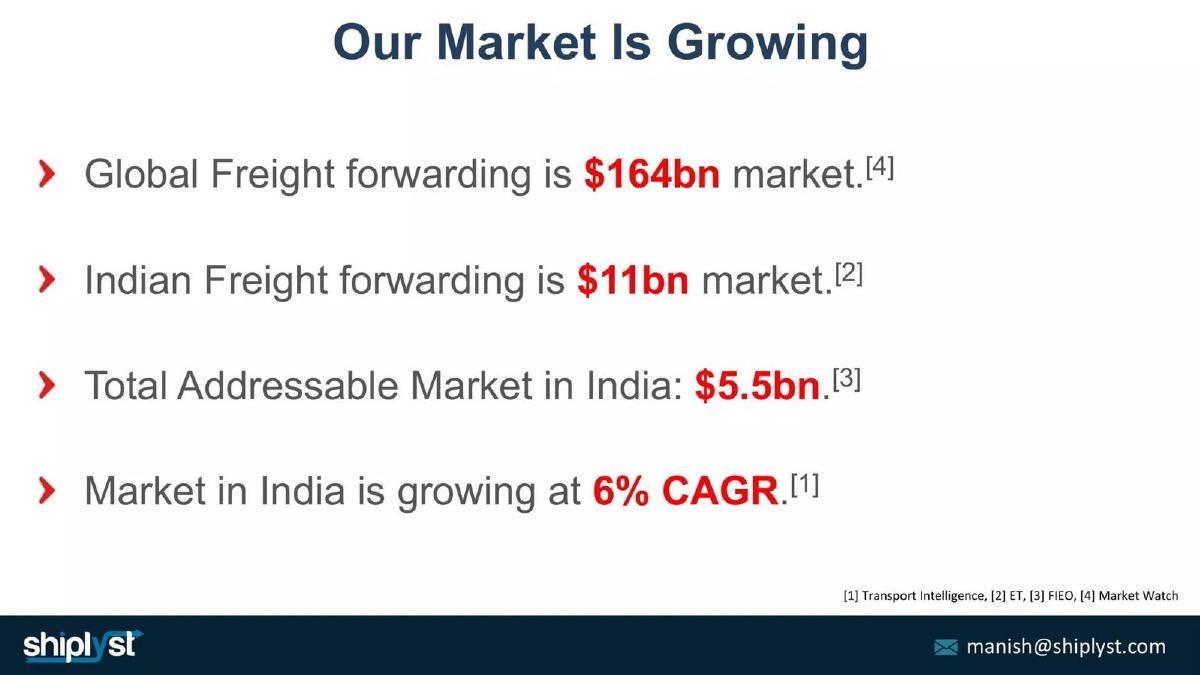
Shiplyst market slide — slide 5
Online freight-forwarding marketplace, India.
Shiplyst deck, slide 5. Exact stored slide matched to this analysis.
Our analysis: A sourced funnel from global to country to addressable.
Evidence and limitation: Every figure has a named source. Our calculation: the $5.5bn addressable market is half of the $11bn Indian market, but the slide does not say which half or why. No year is given for any figure.
What a founder can adapt: "Global [mode] $[X] ([source], [year]) → [country] $[Y] ([source]) → addressable $[Z]: [which segment and why]."
Supporting analysis
What the deck claims: "Our Market Is Growing." "Global Freight forwarding is $164bn market.[4]" "Indian Freight forwarding is $11bn market.[2]" "Total Addressable Market in India: $5.5bn.[3]" "Market in India is growing at 6% CAGR.[1]" Footnotes: "[1] Transport Intelligence, [2] ET, [3] FIEO, [4] Market Watch."
Presentation choice: Investors can trace each step and check each source.
When it does not fit: An addressable figure with no explanation of how it was cut from the total.
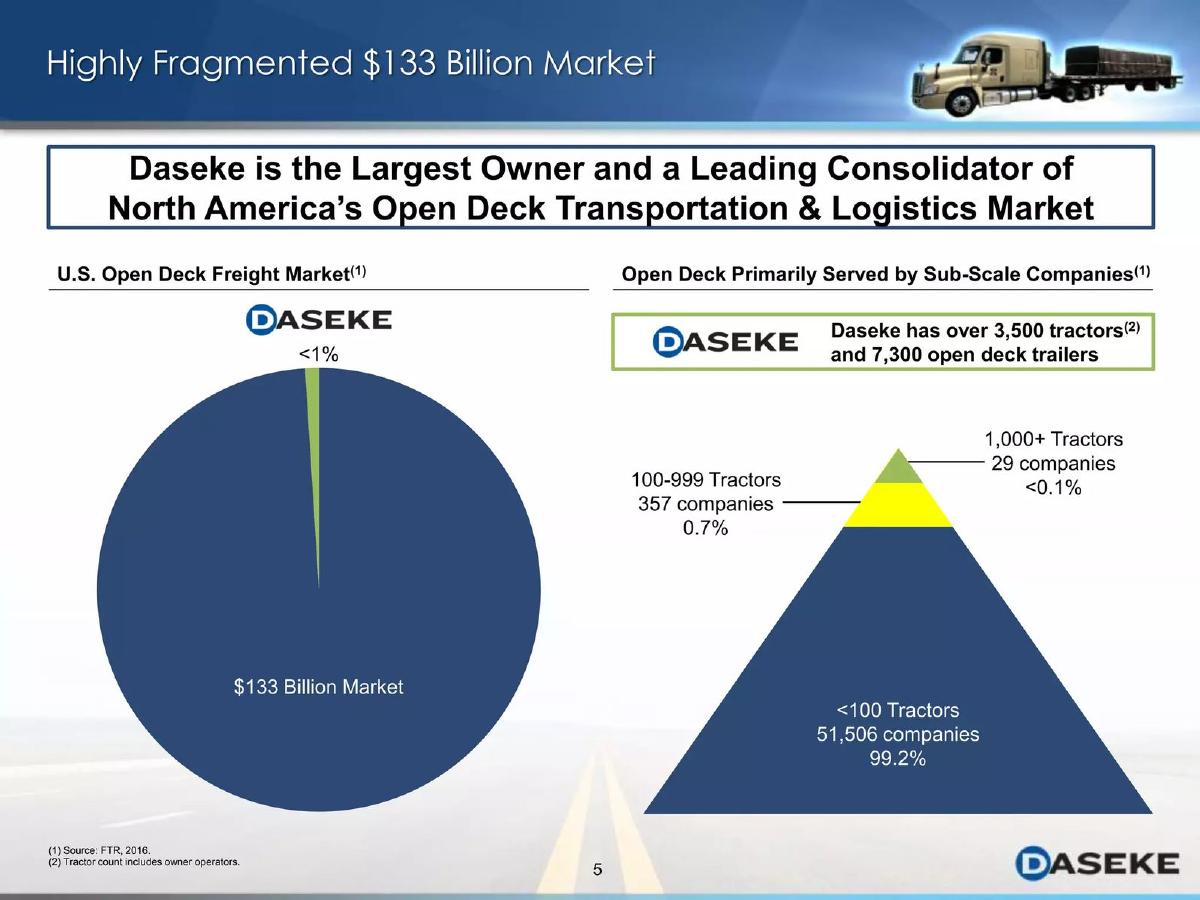
Open-deck (flatbed) trucking consolidator, North America. This is a public-company investor presentation, not a startup fundraising deck; the slide is labelled 5 in the deck.
Daseke deck, slide 6. Exact stored slide matched to this analysis.
Our analysis: Size plus fragmentation, which is the case for a roll-up.
Evidence and limitation: One segment, one source with a year, and carrier counts by size. Our calculation: 51,506 + 357 + 29 = 51,892 companies, and the percentages (99.2%, 0.7%, under 0.1%) match those counts.
What a founder can adapt: "[Segment] $[X] ([source], [year]); [N] carriers, [%] with fewer than [size]. Our share: [%]."
Supporting analysis
What the deck claims: "Highly Fragmented $133 Billion Market." "Daseke is the Largest Owner and a Leading Consolidator of North America's Open Deck Transportation & Logistics Market." "U.S. Open Deck Freight Market": Daseke "<1%" of "$133 Billion Market". "Open Deck Primarily Served by Sub-Scale Companies": "<100 Tractors 51,506 companies 99.2%", "100-999 Tractors 357 companies 0.7%", "1,000+ Tractors 29 companies <0.1%". "Daseke has over 3,500 tractors and 7,300 open deck trailers." "Source: FTR, 2016."
Presentation choice: The carrier counts show why a consolidator has room to grow, not just how big the market is.
When it does not fit: A fragmentation claim without counts. And remember the deck's purpose: this was written for public-market investors.
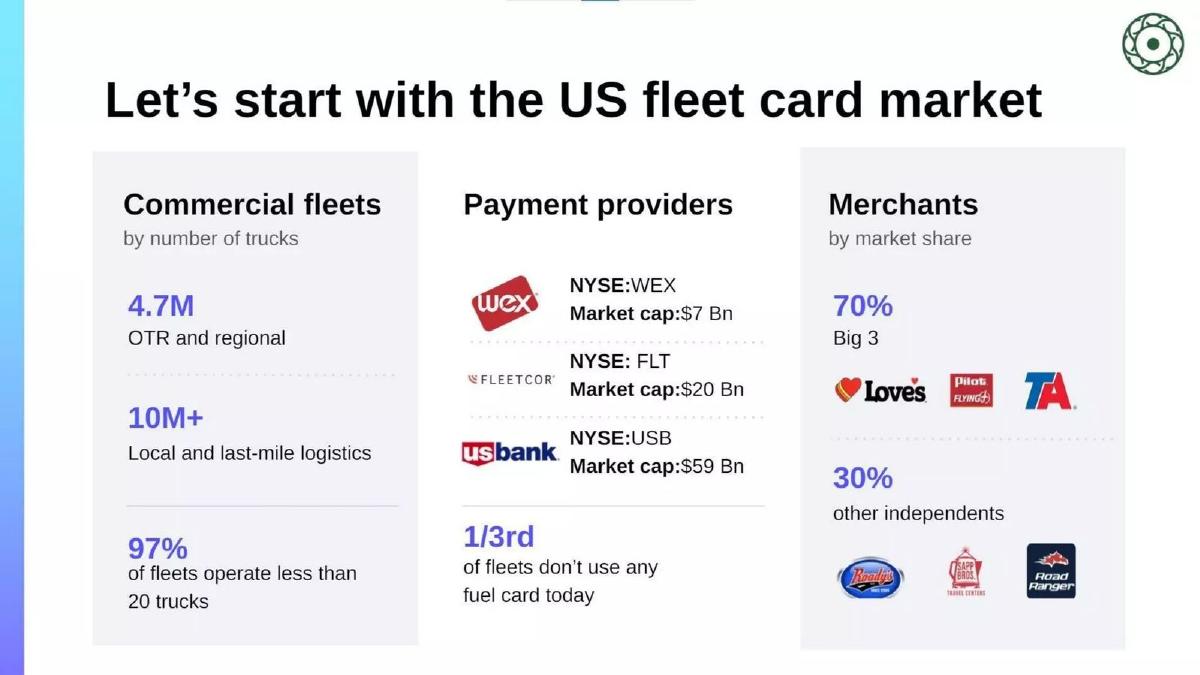
AtoB deck, slide 4. Exact stored slide matched to this analysis.
Our analysis: A structural map: who buys, who sells, who takes the payment.
Evidence and limitation: The market is mapped by customers, incumbents and merchants rather than by spend. No source or year is shown. The market caps describe the incumbents' size, not the fleet card market; US Bank's covers its whole bank.
What a founder can adapt: Add the dollar figure the map implies: "[N] fleets × $[fuel spend] = $[X]; [%] unserved." Cite each count.
Supporting analysis
What the deck claims: "Let's start with the US fleet card market." "Commercial fleets by number of trucks": "4.7M OTR and regional", "10M+ Local and last-mile logistics", "97% of fleets operate less than 20 trucks". "Payment providers": WEX "Market cap: $7 Bn", FleetCor "Market cap: $20 Bn", US Bank "Market cap: $59 Bn"; "1/3rd of fleets don't use any fuel card today". "Merchants by market share": "70% Big 3" (Love's, Pilot Flying J, TA), "30% other independents".
Presentation choice: It shows the gap AtoB targets (small fleets, a third with no fuel card) in one view.
When it does not fit: Using incumbents' market capitalisation as a stand-in for market size.
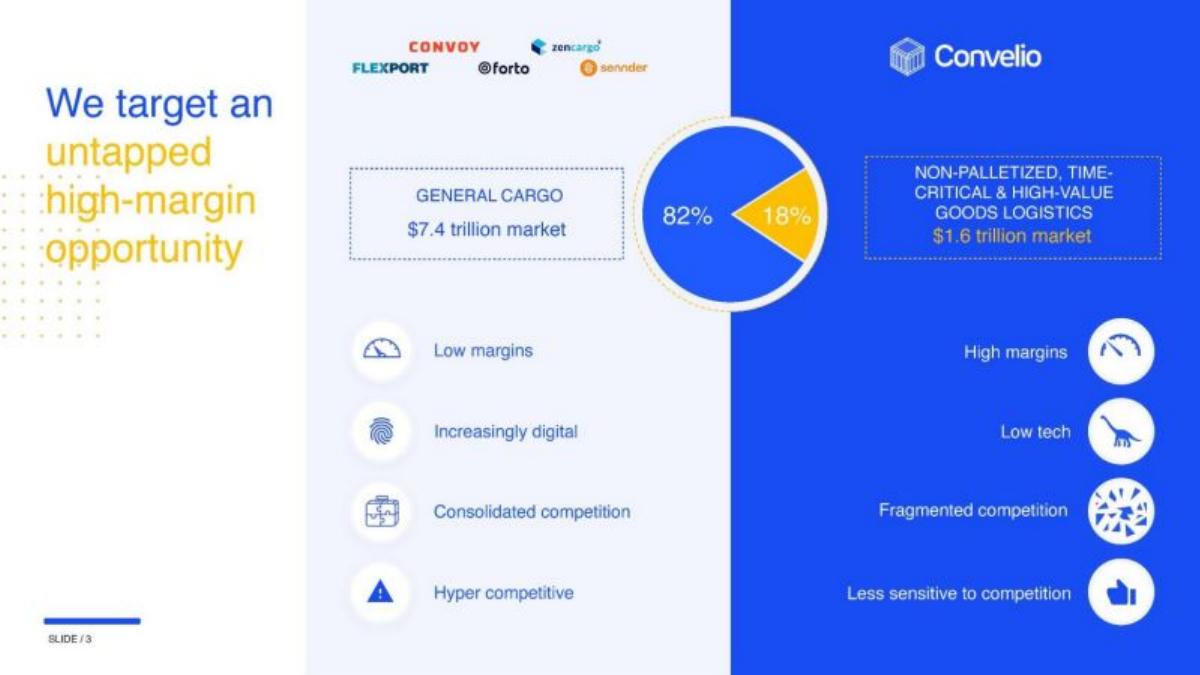
Convelio deck, slide 3. Exact stored slide matched to this analysis.
Our analysis: A carve-out: a niche defined by cargo type, contrasted with the crowded mainstream.
Evidence and limitation: No source or year. Our calculation: the numbers don't agree. If $1.6 trillion is 18% of the whole, the whole is about $8.9 trillion; if the whole is $7.4 trillion, 18% is about $1.3 trillion. The slide doesn't say whether the $7.4 trillion is the total or only the 82%.
What a founder can adapt: "Total [mode] $[X] ([source], [year]); our cargo type [%] = $[Y]; addressable in our lanes $[Z]."
Supporting analysis
What the deck claims: "We target an untapped high-margin opportunity." Pie: "General cargo $7.4 trillion market" 82%, versus "Non-palletized, time-critical & high-value goods logistics $1.6 trillion market" 18%. General cargo: "Low margins", "Increasingly digital", "Consolidated competition", "Hyper competitive", with Convoy, Flexport, Forto, Zencargo and Sennder logos. Convelio's niche: "High margins", "Low tech", "Fragmented competition", "Less sensitive to competition".
Presentation choice: It explains why the niche is attractive (margins, fragmentation), not just that it exists.
When it does not fit: Percentages and totals that don't reconcile, and a trillion-dollar niche with no path to the part you can serve.
Autonomous drone delivery software. The deck is filed under a generic name.
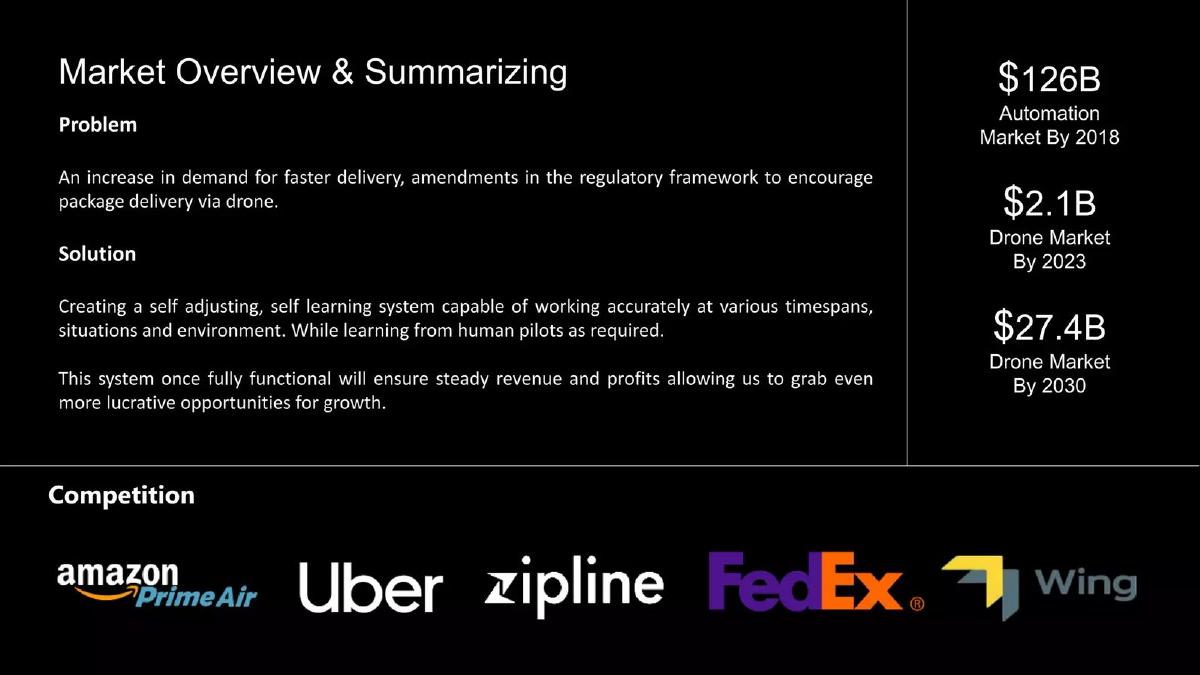
Drone package delivery startup deck, slide 5. Exact stored slide matched to this analysis.
Our analysis: Headline numbers stacked side by side, not a sizing.
Evidence and limitation: Three figures for different markets (automation, drones) at different dates, with no source. None is a delivery market, and the 2018 figure is already in the past.
What a founder can adapt: "[N] parcels a year in [area] ([source]); [%] within drone range × $[price] = $[X]."
Supporting analysis
What the deck claims: "Market Overview & Summarizing." "$126B Automation Market By 2018." "$2.1B Drone Market By 2023." "$27.4B Drone Market By 2030." Problem: "An increase in demand for faster delivery, amendments in the regulatory framework to encourage package delivery via drone." Competition: Amazon Prime Air, Uber, Zipline, FedEx, Wing logos.
Presentation choice: Included as a contrast: it shows what investors discount.
When it does not fit: Adjacent-market forecasts, out-of-date years and no source.
Before: "$126B Automation Market By 2018. $2.1B Drone Market By 2023."
After: "[N] parcels a year in [city] ([source], [year]); [%] within [km] of a depot × $[price] = $[X]."
What improved: Our illustrative rewrite of the drone delivery slide; bracketed text is a placeholder, not company fact.
What's different about logistics market sizing
Freight is split by mode (road, ocean, air, parcel), by lane and by cargo type, and each has different buyers, margins and rivals. Industry bodies and research firms publish spend and carrier counts, which gives a checkable base. Fragmentation matters as much as size: a market of thousands of small carriers is sold and consolidated very differently from one held by a few large players.
What investors check
Whether the headline total is the market the company actually serves. Whether each figure has a source and a year. Whether the step from total to addressable is shown. Whether slices add up. Whether forecasts from different markets and dates are presented side by side as if they were one number.
How we read each slide
We quote the text on the stored slide images and mark our own arithmetic as ours. We have not checked any market figure or source. Page numbers are pages in the original deck file.
Common mistakes
Global logistics spend as your market. Size the slice you move.
Totals and shares that don't reconcile. Check the arithmetic.
Market cap as market size. Show spend, not incumbents' valuations.
Stacking forecasts from different markets. One market, one source, one year.
Diagnostic checklist
Mode, lane or cargo type named.
Source and year for each figure.
Step from total to addressable shown.
Fragmentation shown with counts.
Company share or target.
Frequently asked questions
How should a logistics startup size its market?
Start from sourced spend for your mode or segment, narrow it to the region and cargo you serve, and show carrier counts. Shiplyst goes from $164bn global to $5.5bn addressable in India, with a source for each line.
Should I show fragmentation on a market slide?
Yes, if your plan depends on it. Daseke's slide shows 51,506 of 51,892 open-deck carriers run under 100 tractors (FTR, 2016), which is the case for consolidation.
How we chose these examples
Corpus: published pitch deck teardowns on StartupFundraising.com. Founder-uploaded private decks are excluded.
Selection (2026-09-28): we searched teardown slide text for market-size wording together with freight, logistics, shipping, last-mile, trucking and delivery terms, shortlisted seven slides and kept five.
Excluded: 7bridges p7 and Borzo p8 (no stored slide image), public-company disclaimer pages, and travel, food delivery and off-topic matches. Slides already used in other guides were not reused.
Page numbers are pages in the original deck files. All five images were stored and viewed on 2026-09-28.
Market figures and sources are quoted from the slides and not independently verified. Calculations (sums, shares, reconciliations) are ours and marked as such.
Review: slide images were checked on 2026-09-28 and matched to company, deck and page (editorial model review). No person has yet completed an editorial review of this page. We make no claim that any slide caused a fundraising outcome.