How to Show Milestones Achieved to Date on a Pitch Deck
How startups present their track record: dated milestone stacks, timelines with funding and headcount, revenue charts annotated with events.
How to Show Milestones Achieved to Date on a Pitch Deck
Seven slides from real pitch decks that answer one question: what has this company already done? For each, we record how the track record is presented — a stacked list of achievements, a dated timeline, a revenue chart annotated with events, a panel of cumulative statistics, or a timeline that runs from the past into the plan — and whether a reader can tell what is achieved from what is still planned.
TL;DR
A milestones-to-date slide is evidence of execution speed: it shows what the team delivered with the money and time it has already had. Five formats appear in real decks. A stacked achievement list from formation to the latest win (Banxware: formation, a €100m loanbook, a €4m Series Seed, more than EUR 10m processed loan volume, 25 hires, a PAYONE signing). A dated timeline with partners and the raise (ConnectU Media, 2015 to 2018). A revenue chart annotated with the events that moved it (Florence: launch in London, UK expansion, Series A). A panel of cumulative statistics (Cover Genius: 6 years, 150+ staff, 2.5M customers in 2020; Book My Activity: 67 cities, 7,193 educators). And a timeline that continues past today into the plan (HindXR; Aphea Bio).
Two things separate a strong milestone slide from a weak one. First, dates: an achievement without a date cannot show speed, and Book My Activity's counts carry none. Second, a visible line between done and planned: HindXR marks the fundraising point on its timeline, while Aphea Bio draws achieved funding rounds and a planned regulatory submission, first sales, break-even and "potential exit" in the same style on one axis. If the slide mixes both, label them.
Milestone slides from real pitch decks
Each example shows the exact stored slide beside its analysis and links to the full teardown. Figures are the companies' own claims unless marked as our calculation. Stage and year are given only where the slide states them.
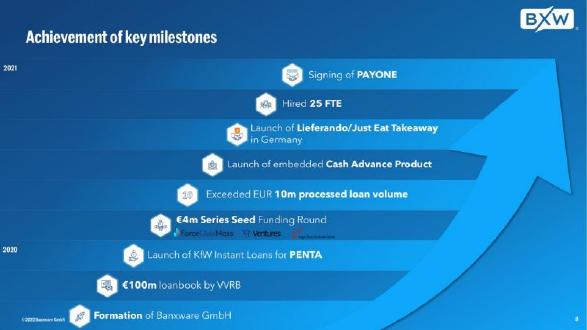
Banxware traction slide — slide 8
German embedded-lending company. The slide is titled "Achievement of key milestones" and carries the page number 8.
Banxware deck, slide 8. Exact stored slide matched to this analysis.
Our analysis: The stack reads as momentum: it moves from incorporation through funding and loan volume to named distribution partners within the two years shown. Most entries are outside confirmations — a funding round, partner launches, a signing — rather than internal activity, which makes the record checkable.
Evidence and limitation: Claimed milestones, not verified. Only two year markers are printed, so individual events are not dated to a month or quarter. The €10m processed loan volume is stated as already exceeded; the €100m loanbook is attributed to a third party (VVRB) and the slide does not say what it means for Banxware's own volume.
What a founder can adapt: List milestones in order with outside confirmations first, and add a month or quarter to each so speed can be read.
Supporting analysis
What the deck claims: A rising stack of nine milestones, earliest at the bottom, with year markers 2020 and 2021 on the left: formation of Banxware GmbH; €100m loanbook by VVRB; launch of KfW Instant Loans for PENTA; €4m Series Seed funding round, with investor logos; exceeded EUR 10m processed loan volume; launch of embedded Cash Advance Product; launch of Lieferando/Just Eat Takeaway in Germany; hired 25 FTE; signing of PAYONE.
Presentation choice: It is the clearest list in this set of achieved, mostly third-party-confirmed milestones in time order.
When it does not fit: Don't leave a large third-party figure, such as a partner's loanbook, unexplained next to your own numbers.
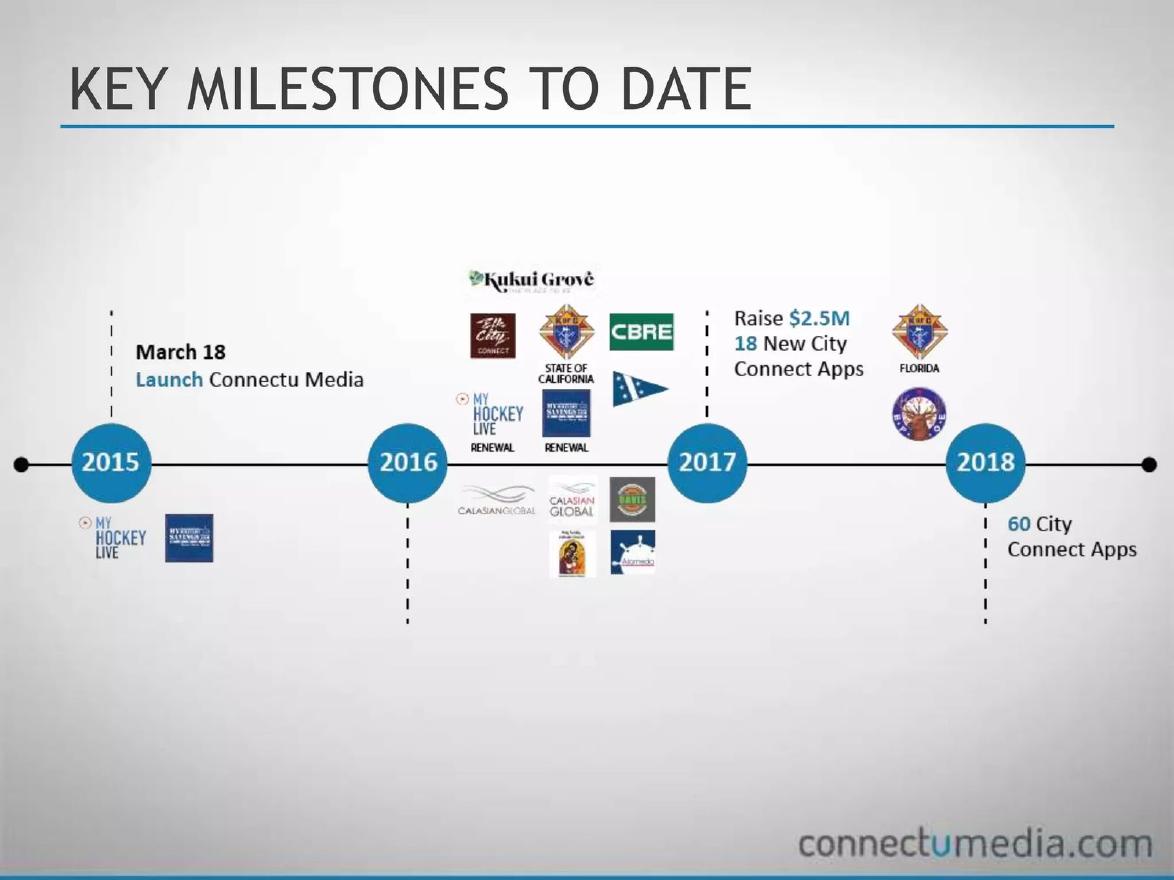
Sports and local media app publisher. The slide is titled "Key milestones to date".
ConnectU Media deck, slide 13. Exact stored slide matched to this analysis.
Our analysis: The timeline uses logos as milestones, which shows who the company works with but not what each relationship produced. The step from 18 new city apps to 60 city apps is the clearest growth signal on the page.
Evidence and limitation: Claimed, not verified. The slide does not say whether the $2.5M raise has closed or is the current ask, and the logos are not labelled as customers, partners or content sources. Our observation: the launch date reads "March 18" but sits above the 2015 marker, so the year of launch is ambiguous on the slide.
What a founder can adapt: Label each logo with what it means (customer, partner, content deal) and state whether a raise is closed or proposed.
Supporting analysis
What the deck claims: A horizontal timeline with 2015, 2016, 2017 and 2018 markers. "March 18 — Launch Connectu Media" sits above 2015; partner and client logos cluster around 2016 and 2017; "Raise $2.5M, 18 new city Connect Apps" is placed after 2017; "60 City Connect Apps" sits under 2018.
Presentation choice: It shows the standard dated-timeline format and its common gaps: unlabelled logos and an unclear raise.
When it does not fit: Don't place an ask on a "to date" timeline without marking it as future.
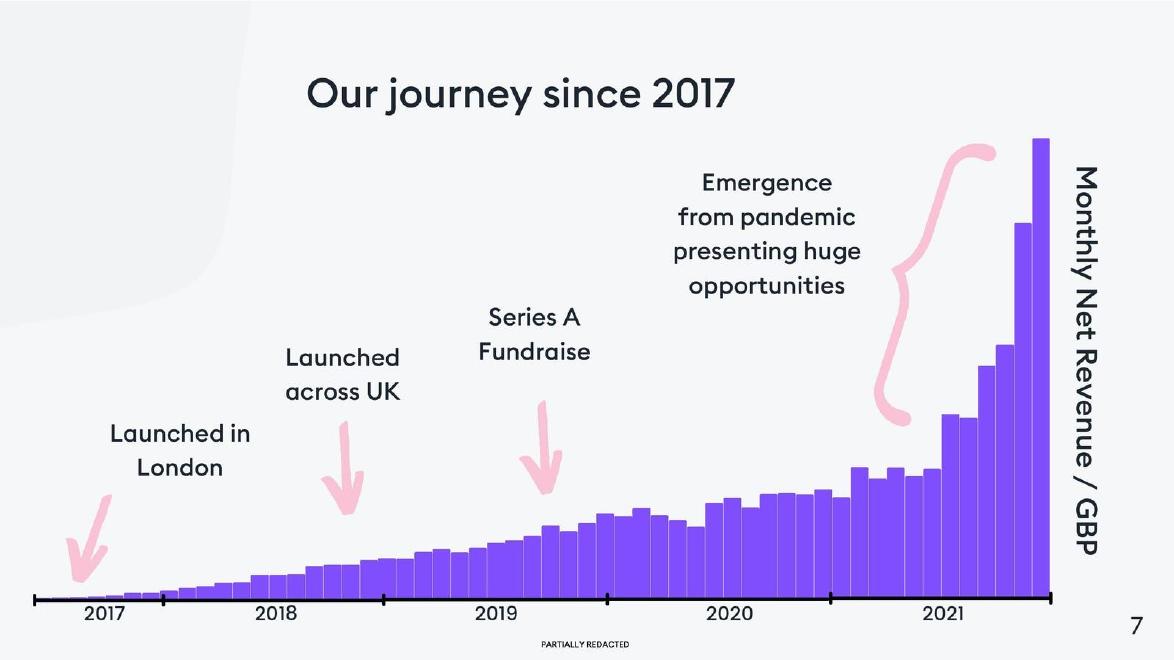
London healthcare staffing marketplace. The slide is titled "Our journey since 2017" and shows the page number 7.
Florence deck, slide 8. Exact stored slide matched to this analysis.
Our analysis: This is the strongest format for linking events to results: each milestone sits on the revenue curve, so the reader sees what happened after the UK launch and after the Series A. Redacting the axis keeps the numbers confidential while still showing the shape.
Evidence and limitation: Measured revenue shape, but the values are redacted, so growth cannot be quantified. The milestones are claims tied to positions on the chart. Our observation: the last bars are several times the height of the 2019 bars, but without a scale no ratio can be calculated.
What a founder can adapt: Plot your core metric over time and annotate it with your milestones; if you must redact, keep the time axis exact.
Supporting analysis
What the deck claims: A bar chart of monthly net revenue in GBP from 2017 to 2021, with annotations and arrows: "Launched in London" at the start, "Launched across UK" in 2018, "Series A Fundraise" in 2019, and "Emergence from pandemic presenting huge opportunities" pointing at the steep rise in 2021. The axis is marked "Partially redacted".
Presentation choice: It is the only slide in this set that ties each milestone to a measured business metric.
When it does not fit: Don't annotate a chart with events that did not visibly change the metric.
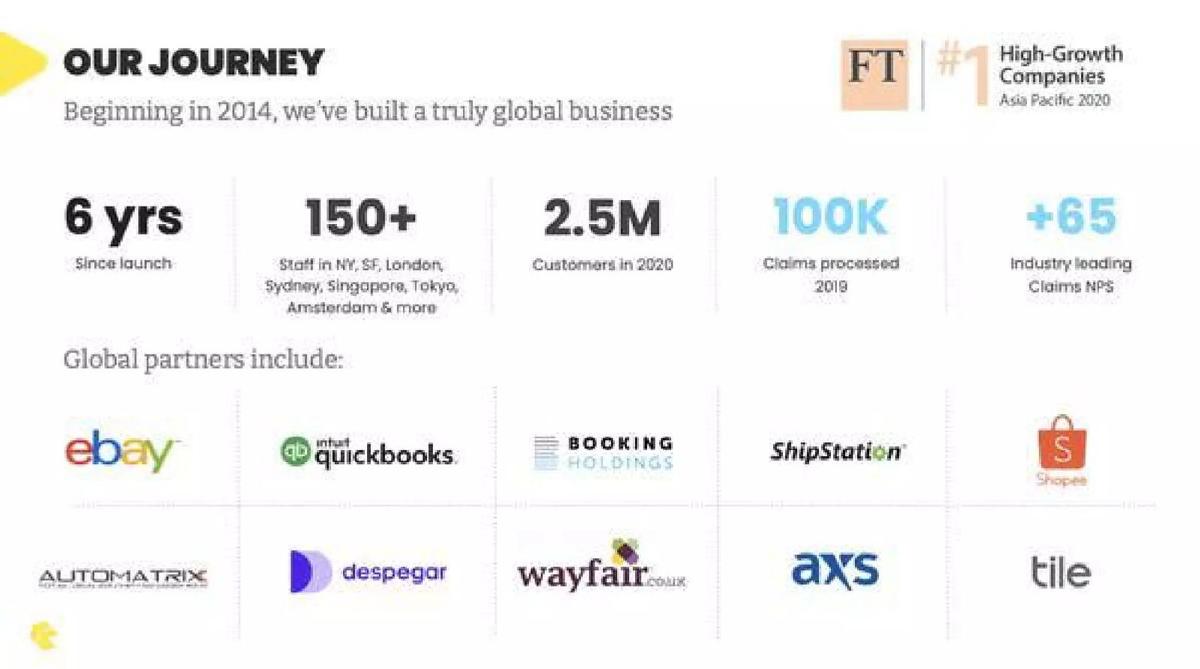
Embedded insurance company. The slide is titled "Our journey" with the subtitle "Beginning in 2014, we've built a truly global business".
Cover Genius deck, slide 3. Exact stored slide matched to this analysis.
Our analysis: Instead of a timeline, the slide compresses the track record into scale: years, people, offices, customers and named partners. It works for a later-stage company whose story is breadth rather than sequence, and the ranking badge provides third-party recognition.
Evidence and limitation: Claimed, not verified. Customers and claims are dated to a year, which is better than undated totals, but they are for different years (2020 and 2019), so they cannot be combined into a claims rate. The NPS has no survey date or sample size.
What a founder can adapt: Use one reference year for all counts, and give the survey basis for any NPS.
Supporting analysis
What the deck claims: Five statistics: "6 yrs since launch", "150+ staff in NY, SF, London, Sydney, Singapore, Tokyo, Amsterdam & more", "2.5M customers in 2020", "100K claims processed 2019" and "+65 industry leading claims NPS". A "#1 High-Growth Companies Asia Pacific 2020" badge with the FT logo, and a grid of global partner logos including eBay, QuickBooks, Booking Holdings, ShipStation, Shopee, Wayfair and Tile.
Presentation choice: It shows the cumulative-scale format for a company with years of history.
When it does not fit: Don't mix figures from different years on one panel without saying so.
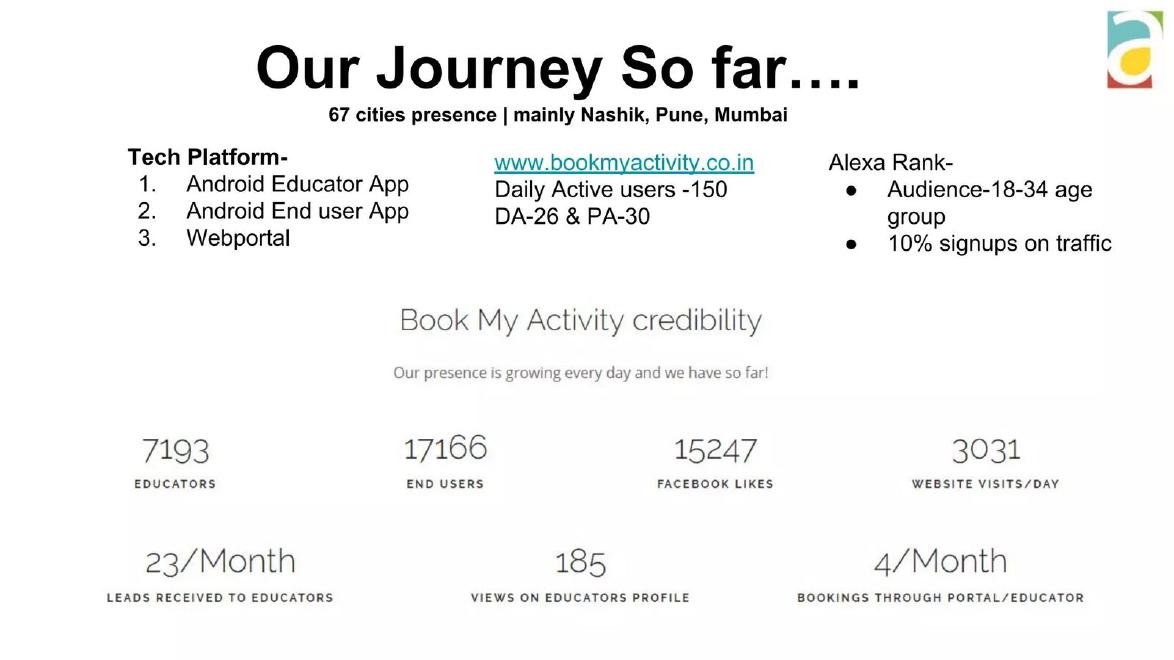
Indian marketplace for activity classes and educators. The slide is titled "Our Journey So far....".
Book My Activity deck, slide 9. Exact stored slide matched to this analysis.
Our analysis: The title promises a journey but the slide is a snapshot: it lists counts without when they were reached. The strongest signal is the per-educator funnel (23 leads, 4 bookings a month), which is a usage metric rather than a milestone.
Evidence and limitation: Claimed, not verified. No figure carries a date or period start, so none shows growth. Our calculation: 150 daily active users against 17,166 end users is under 1%; the slide does not explain the gap. "67 cities" is qualified as mainly three cities.
What a founder can adapt: Turn the counts into dated milestones (when you reached 1,000, then 5,000 educators) and keep the funnel metrics on a traction slide.
Supporting analysis
What the deck claims: "67 cities presence | mainly Nashik, Pune, Mumbai"; a tech platform list (Android educator app, Android end-user app, web portal); "Daily Active users - 150"; domain metrics "DA-26 & PA-30"; an audience note (18–34 age group, 10% signups on traffic). Under "Book My Activity credibility": 7,193 educators, 17,166 end users, 15,247 Facebook likes, 3,031 website visits/day, 23/month leads received to educators, 185 views on educators profile, 4/month bookings through portal/educator.
Presentation choice: It is the contrast case: a "journey" slide with no dates, so no speed or sequence can be read.
When it does not fit: Don't call a list of undated totals a journey.
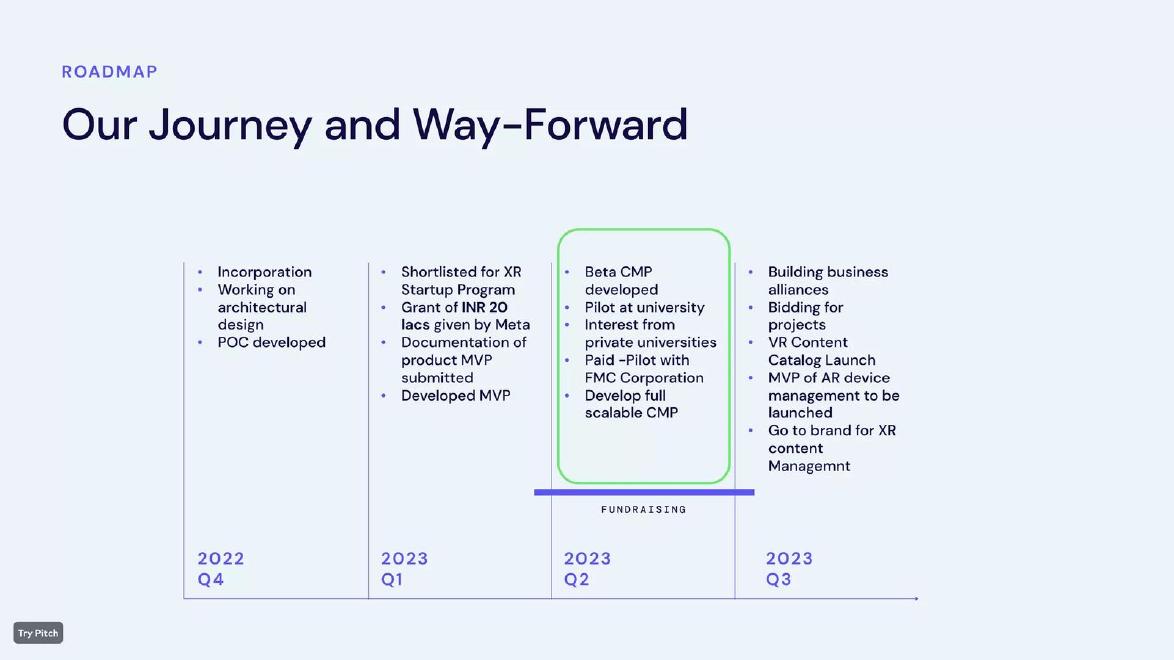
Indian extended-reality startup. The slide is labelled "Roadmap" and titled "Our Journey and Way-Forward".
HindXR deck, slide 12. Exact stored slide matched to this analysis.
Our analysis: Quarter-level dating shows a very young company moving quickly: incorporation to a grant, an MVP and a paid pilot within about three quarters. The fundraising marker gives the reader a clear boundary between the record and what the round funds.
Evidence and limitation: Claimed, not verified. The Q2 column mixes completed items ("beta CMP developed") and plans ("develop full scalable CMP") in one box; the Meta grant and the FMC paid pilot are the items an investor could confirm.
What a founder can adapt: Mark where today and the raise fall on your timeline, and keep completed and planned items in separate columns.
Supporting analysis
What the deck claims: Four quarterly columns. 2022 Q4: incorporation, working on architectural design, POC developed. 2023 Q1: shortlisted for XR startup programme, grant of INR 20 lacs given by Meta for projects, documentation of product MVP submitted, developed MVP. 2023 Q2 (boxed, above a "Fundraising" marker): beta CMP developed, pilot at university, interest from private universities, paid pilot with FMC Corporation, develop full scalable CMP. 2023 Q3: building business alliances, bidding for projects, VR content catalogue launch, MVP of AR device management to be launched, go-to brand for XR content management.
Presentation choice: It is the clearest example in this set of separating achieved from planned on one timeline.
When it does not fit: Don't mix done and to-do items inside one column.
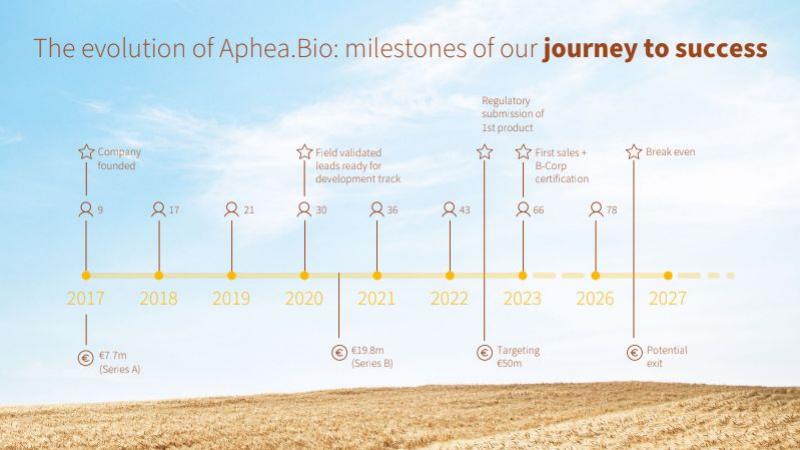
Belgian agricultural biologicals company. The slide is titled "The evolution of Aphea.Bio: milestones of our journey to success".
Aphea.Bio deck, slide 12. Exact stored slide matched to this analysis.
Our analysis: The slide shows a credible record — two rounds and steady hiring — but draws plans in the same style as achievements, so a quick reader may take first sales and break-even as done. Only the dashed end of the axis and the year jump hint at the boundary.
Evidence and limitation: Claimed. Funding rounds and headcount to 2022 are presented as achieved; first sales, 66 and 78 staff, break-even, the €50m target and potential exit are plans. Our calculation: headcount grows from 9 to 43 over the years shown to 2022, and the two completed rounds total €27.5m. The axis jumps from 2023 to 2026, so spacing is not proportional to time.
What a founder can adapt: Keep the combined timeline but shade or label the future section and mark the current raise on it.
Supporting analysis
What the deck claims: A timeline labelled 2017 to 2023, then 2026 and 2027. Above the line: company founded (2017); field validated leads ready for development track (2020); regulatory submission of 1st product; first sales + B-Corp certification (2023); break even (2027). Headcount icons read 9, 17, 21, 30, 36, 43, 66 and 78. Below the line: €7.7m (Series A) in 2017; €19.8m (Series B) after 2020; "Targeting €50m"; "Potential exit".
Presentation choice: It shows the most common risk of a past-plus-future timeline: no clear marker for today.
When it does not fit: Don't draw planned milestones identically to achieved ones, and keep axis spacing proportional.
Columns report what each slide states; the check column notes what a reader can and cannot verify.
Example
Format
Dated
Tied to a metric
Done vs planned marked
What a reader can check
Banxware
Achievement stack
Year markers only
Loan volume
All achieved
Partners, round, signing
ConnectU Media
Timeline with logos
By year
City app count
No (raise unclear)
Launch year, app counts
Florence
Annotated revenue chart
By month
Yes, net revenue (redacted)
All achieved
Shape of growth after each event
Cover Genius
Scale statistics
Mixed years
Customers, claims
All achieved
Partners, FT ranking
Book My Activity
Undated counts
No
Usage counts
All achieved
Little — no dates
HindXR
Quarterly past and plan
By quarter
No
Yes, fundraising marker
Meta grant, FMC pilot
Aphea.Bio
Past and plan timeline
By year
Headcount, funding
Weakly (dashed axis)
Rounds and headcount to 2022
Key Takeaways
Date every milestone. Banxware anchors its stack with 2020 and 2021 markers; ConnectU Media puts each event on a year.
Show the result, not just the activity. Banxware's "exceeded EUR 10m processed loan volume" is an outcome; "launch of" a product is an activity.
Tie events to a metric. Florence plots monthly net revenue and marks launch, UK expansion and Series A on the curve, so each milestone's effect is visible.
Separate achieved from planned. HindXR places a fundraising marker between completed quarters and planned work.
Label future items as plans. Aphea Bio's break-even, first sales and potential exit sit on the same line as past rounds, drawn identically.
Cumulative counts need a date and a denominator. Book My Activity reports 17,166 end users with no period, so growth cannot be read from it.
Build your milestones-to-date slide
Answer each prompt in one line with a date and a name or number where possible.
Start. When was the company formed, and when did the product first reach a customer?
Confirmations. Which partners, customers, grants, approvals or rounds can an outsider verify, and when did each happen?
Metric. Which single business metric best shows the effect of those milestones over time?
Today. Where does today sit on your timeline, and what does the new round fund after it?
Speed. How long did each step take compared with your previous plan?
Copyable framework: Since [founding month/year] we have [milestone 1, date], [milestone 2, date] and [milestone 3, date], taking [metric] from [x] to [y]; this round funds [next milestones] by [date].
Illustrative example 1 — written by us
Before: Our Journey So far: 67 cities, 7,193 educators, 17,166 end users.
After: Launched in [month/year]; 1,000 educators by [date], 7,193 by [date]; active in [n] cities, led by Nashik, Pune and Mumbai.
What improved: Illustrative template for Book My Activity's slide; bracketed values are for the company to supply.
Why a track-record slide matters
Most of a pitch deck is about the future: the market, the plan, the forecast and what the new money will buy. A milestones-to-date slide is about the past, and that is its value. Investors use past delivery to judge whether the forward plan is believable. A team that said it would launch, sign a partner and reach a revenue level, and then did so on schedule, makes its next set of promises more credible.
The slide also answers a quieter question: what did the previous money buy? If a company has raised before, a dated record of what happened after each round shows how efficiently it turned capital into progress. Aphea Bio puts its €7.7m Series A and €19.8m Series B on the same timeline as its headcount and product milestones, which lets a reader line up funding against delivery. Banxware places its €4m Series Seed between the loan-volume and product-launch milestones that follow it.
Finally, a track record helps a reader size the stage of the company. Six years of operation and 150+ staff (Cover Genius) describe a very different company from incorporation and a proof of concept in the last quarter of 2022 (HindXR). Both are honest; the slide simply needs to make the stage obvious.
What makes a milestone worth showing
Not every event is a milestone. The useful ones are hard to fake and matter to the business case: a signed commercial partner, a revenue or volume threshold crossed, a regulatory approval, a funding round, a launch in a new market, or a hiring level reached. Banxware's list is mostly of this kind: the signing of PAYONE, exceeding EUR 10m processed loan volume, the launch with Lieferando/Just Eat Takeaway in Germany.
Weaker milestones describe inputs rather than results: "working on architectural design", "documentation of product MVP", "building business alliances". They may be true and important to a very early team, but they do not show that anyone outside the company has said yes. HindXR's timeline mixes both kinds; its stronger entries are a grant of INR 20 lacs given by Meta, being shortlisted for an XR startup programme, and a paid pilot with FMC Corporation.
A good test: could an investor confirm the milestone with one phone call or one document? A signed partner, a grant award, a closed round and a regulator's acknowledgement pass that test. A design phase does not.
Achieved versus planned on one slide
Many milestone slides are timelines that run through today and into the plan. That is a sensible format, because it shows the bridge from what has been done to what the round will fund. The risk is that a reader cannot tell where the record ends and the projection begins. Aphea Bio's slide is the clearest case in this set: the line runs from 2017 to 2027, with funding rounds, headcount and product events drawn in the same style. The only visual cues are a dashed segment of the axis and a change in the date labels; the regulatory submission, first sales, break-even and potential exit are plans, but they look like the achievements before them.
HindXR handles the same problem with a single device: a box and a "Fundraising" marker on the Q2 2023 column, which splits the slide into what the team has done and what the money is for. The planned column (building alliances, bidding for projects, a VR content catalogue launch) is clearly after the raise. Neither slide uses words such as "achieved" and "planned", but HindXR's marker does the job.
If your timeline crosses today, mark the present. A vertical line, a shaded past, a change of colour, or the words "to date" and "next" are all enough. Then the reader can credit you for the record and judge the plan separately.
Common mistakes
Undated achievements. Without dates, a list cannot show speed or sequence.
Activity instead of outcomes. Prefer signed, launched, crossed and approved over working on.
Plans drawn as achievements. Mark today and label future items as planned.
Unlabelled logos. Say whether each logo is a customer, partner or investor.
Mixed reference years. Put all counts on the same date or label each.
Non-proportional time axes. Space years evenly so the pace is not distorted.
Diagnostic checklist
Every milestone has at least a year, ideally a quarter or month.
Most milestones are outside confirmations: customers, partners, grants, rounds, approvals.
Achieved and planned items are visibly separate.
At least one milestone is tied to a business metric.
Logos and counts say what they represent and when.
The slide makes the company's stage obvious.
Frequently asked questions
How do I show milestones achieved to date in a pitch deck?
List or plot your key achievements in time order, with a date on each, and lead with outside confirmations such as partners, customers, grants and funding rounds. Banxware stacks nine milestones from formation to a PAYONE signing; Florence plots monthly revenue and marks launch, UK expansion and Series A on the curve.
Should my milestones slide include future plans?
It can, if the boundary is obvious. HindXR places a fundraising marker between completed quarters and planned work; Aphea.Bio draws plans in the same style as achievements, which makes them easy to misread.
What counts as a milestone worth showing?
Events that are hard to fake and matter to the business: a signed partner, a revenue or volume threshold crossed, a regulatory step, a funding round, a market launch or a hiring level. Internal activities such as design work are weaker.
Is a list of cumulative statistics a milestones slide?
Only if the figures are dated. Cover Genius dates its customer and claims counts to a year; Book My Activity's counts have no dates, so they show size but not progress.
How is a milestones slide different from a roadmap?
A roadmap shows what you plan to do; a milestones-to-date slide shows what you have done. Many decks combine them on one timeline, which works when today is clearly marked.
How we chose these examples
Search (2026-10-01): the durable corpus index (70,729 unique pages, deduplicated by deck-file sha256 + page) was searched for milestone, milestones achieved, milestones to date, key milestones and our journey (523 pages mention milestone). Decks from companies already publicly listed when the deck was made were excluded (Aridis, Golden Star Resources, Goldmoney, Diplomat Pharmacy).
Eight candidate pages were rendered from the original public deck files and read from the images; seven slides are used: Banxware 8, ConnectU Media 13, Florence 8, Cover Genius 3, Book My Activity 9, HindXR 12 and Aphea.Bio 12. Get A Drive 11 was rejected because it is an unfilled template. Page numbers are PDF pages; printed footers may differ. Figures are as printed on each slide and have not been verified.
How we built this: drafted and checked with AI assistance (model review against the original slide images); no human editor has reviewed this guide.