Series B Traction Slides: Growth-Stage Deck Examples
What a Series B or later traction slide shows: scale, ARR by quarter, net dollar retention, efficiency and market position.
Series B Traction Slides: Real Growth-Stage Pitch Deck Examples
Eight traction slides from Series B and Series C decks, shown in full, compare how growth-stage companies prove scale: multi-year revenue charts, retention broken into parts, growth against cost, and position in the market.
TL;DR
At Series B and later, a traction slide proves the business works at scale and grows efficiently, not just that customers pay. Palta charts consolidated ARR by quarter from "5.1" to "114.0" ($m) with "x10 growth in 2 years", split by region. Juro breaks ARR into new business, expansion, churn and contraction beside "3x net ARR growth y/y". Morty pairs "800% YoY" run-rate growth with "nearly flat expenses". Borzo shows "$87 million gross revenue +90% YoY" and three dated charts. Weaker slides list highlights without figures (AI Rudder's "high net revenue retention") or redact the lead number (Cobalt's "+$XXm ARR").
Series B and later traction slides from real pitch decks
Each example shows the exact stored slide above its analysis and links to the full teardown. Stronger examples come first. Claims are as shown on the slides; we have not verified them.
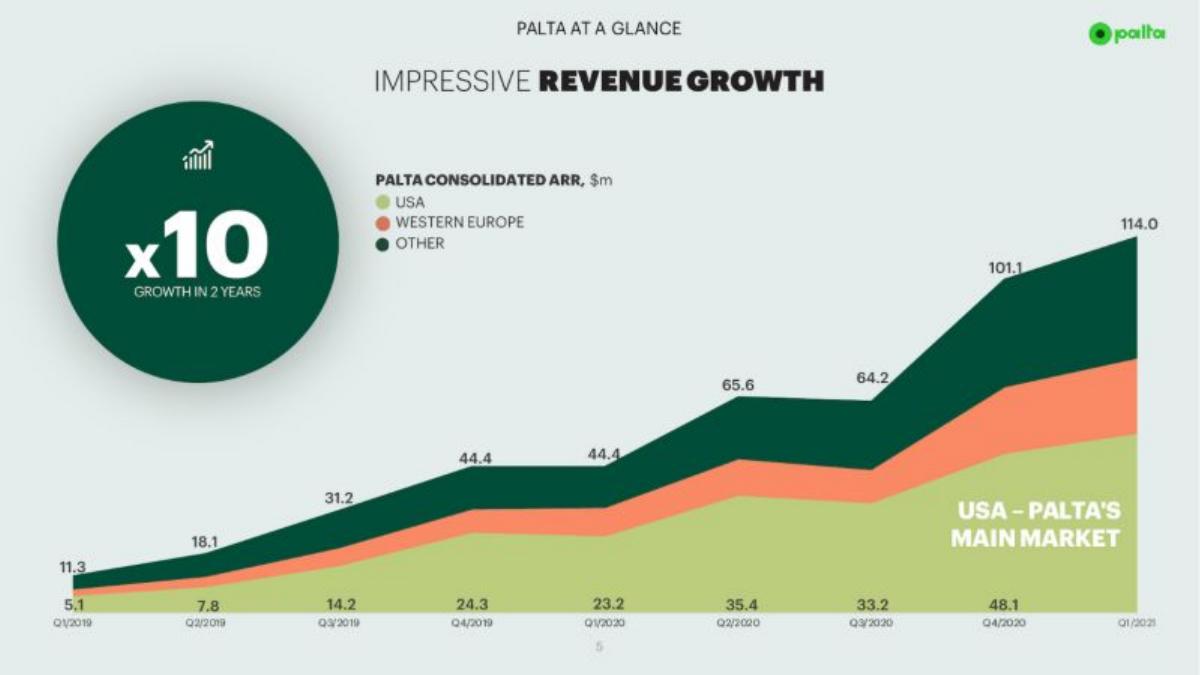
Palta traction slide — slide 4
Series B. Consumer health and fitness apps. One stacked area chart and a large growth badge.
Palta deck, slide 4. Exact stored slide matched to this analysis.
Our analysis: The strongest example here: two years of ARR, every point labelled, and where revenue comes from.
Evidence and limitation: Nine labelled quarters, a regional split and one headline multiple.
What a founder can adapt: Label every quarter and split by your main driver (region, product or segment).
Supporting analysis
What the deck claims: "Palta at a glance. Impressive revenue growth." "x10 growth in 2 years." "Palta consolidated ARR, $m" by quarter from Q1/2019 ("11.3") to Q1/2021 ("114.0"), split into USA, Western Europe and other; "USA – Palta's main market".
Presentation choice: The regional split answers the next Series B question: which market carries the growth?
When it does not fit: "Impressive" adds nothing; the chart makes the case.
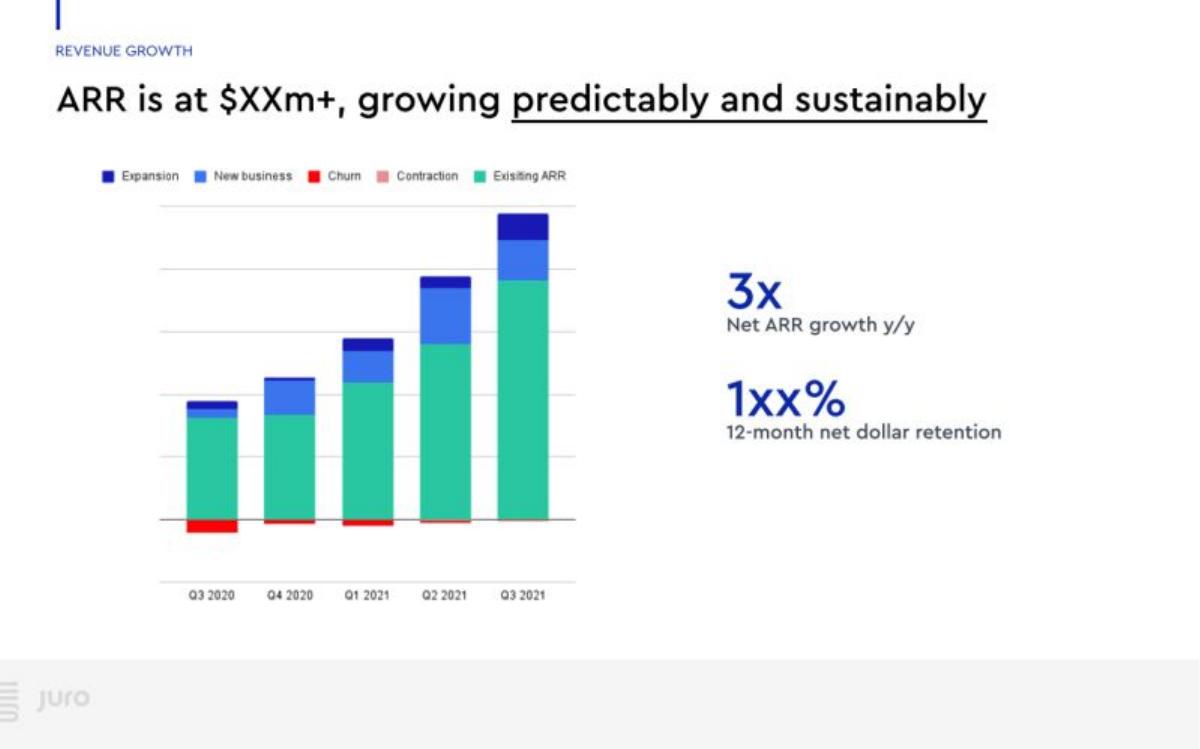
Series B. Contract software. Quarterly ARR bridge and two side figures.
Juro deck, slide 6. Exact stored slide matched to this analysis.
Our analysis: The best structure here: it shows where ARR comes from and what is lost. The redactions weaken the published copy.
Evidence and limitation: ARR broken into movements by quarter, a growth multiple; ARR and retention values redacted in the published version.
What a founder can adapt: Chart new, expansion and churned ARR separately each quarter.
Supporting analysis
What the deck claims: "Revenue growth. ARR is at $XXm+, growing predictably and sustainably." Stacked bars Q3 2020 to Q3 2021: existing ARR, new business, expansion, churn and contraction. "3x Net ARR growth y/y"; "1xx% 12-month net dollar retention".
Presentation choice: Showing churn and contraction openly signals confidence in the numbers.
When it does not fit: Placeholders such as "$XXm" and "1xx%" on any version an investor may see.
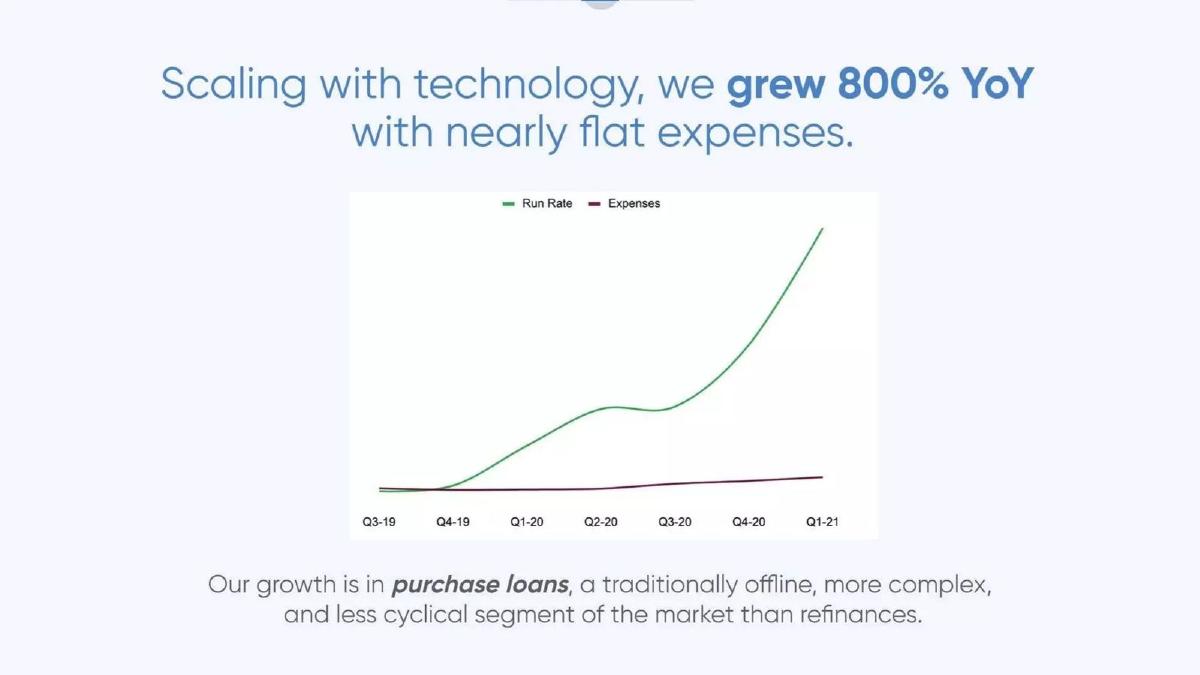
Series B. Online mortgage marketplace. Two lines on one chart.
Morty deck, slide 3. Exact stored slide matched to this analysis.
Our analysis: One clear efficiency message; the chart has no axis values.
Evidence and limitation: A growth rate, a dated chart comparing growth with cost, and a note on revenue quality.
What a founder can adapt: Plot revenue against cost or burn on one chart.
Supporting analysis
What the deck claims: "Scaling with technology, we grew 800% YoY with nearly flat expenses." Run rate and expenses, Q3-19 to Q1-21. "Our growth is in purchase loans, a traditionally offline, more complex, and less cyclical segment of the market than refinances."
Presentation choice: Growth against flat cost is the efficiency proof later-stage investors look for.
When it does not fit: A chart with no numbers on either line; label the latest values.
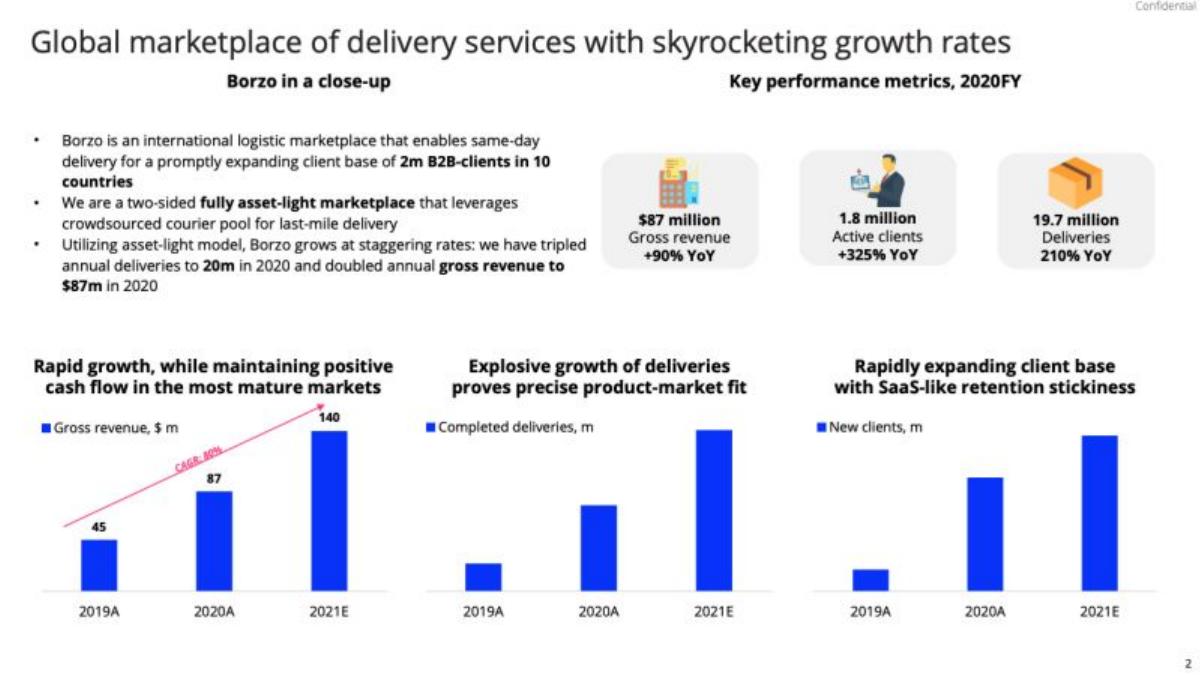
Series C. Same-day delivery marketplace. Summary text, three figure cards and three bar charts.
Borzo deck, slide 2. Exact stored slide matched to this analysis.
Our analysis: Dense but complete: revenue, volume, customers and profitability in mature markets.
Evidence and limitation: Three figures with growth rates, three charts, a cash flow claim.
What a founder can adapt: Show one headline figure per driver, each with a growth rate.
Supporting analysis
What the deck claims: "Global marketplace of delivery services with skyrocketing growth rates." "Key performance metrics, 2020FY": "$87 million gross revenue +90% YoY", "1.8 million active clients +325% YoY", "19.7 million deliveries 210% YoY". Charts 2019A, 2020A, 2021E for gross revenue (45, 87, 140), deliveries and new clients; "positive cash flow in the most mature markets".
Presentation choice: Pairing growth with positive cash flow in mature markets answers "will this ever be profitable?"
When it does not fit: Only revenue has values on the charts; 2021E bars need a forecast label.
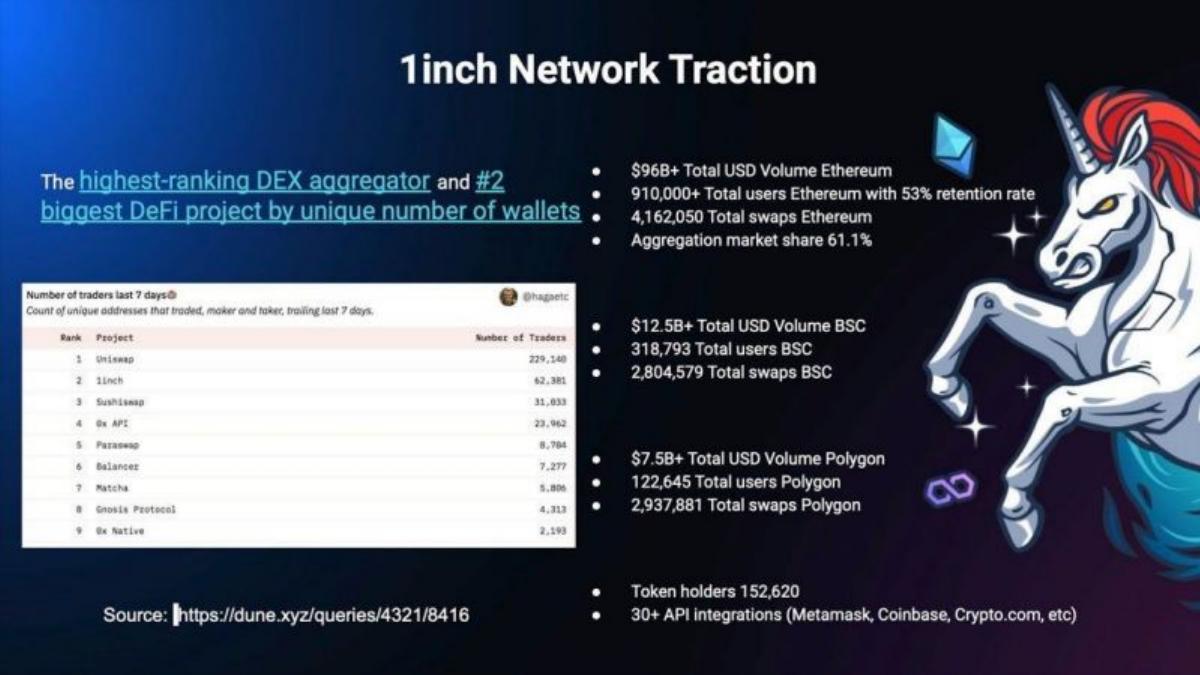
Series B. Decentralised exchange aggregator. Figures per blockchain and a ranking table.
1inch Network deck, slide 3. Exact stored slide matched to this analysis.
Our analysis: Strong on position and sourcing; no time dimension.
Evidence and limitation: Volume, users, retention and market share, a ranked table and a cited source.
What a founder can adapt: Name the source for any ranking or share claim.
Supporting analysis
What the deck claims: "1inch Network Traction." "The highest-ranking DEX aggregator and #2 biggest DeFi project by unique number of wallets." "$96B+ Total USD Volume Ethereum", "910,000+ Total users Ethereum with 53% retention rate", "Aggregation market share 61.1%"; volumes and users for BSC and Polygon; "Source: https://dune.xyz/queries/4321/8416".
Presentation choice: Citing a public data source makes a market-share claim checkable.
When it does not fit: Totals with no growth rate or period.
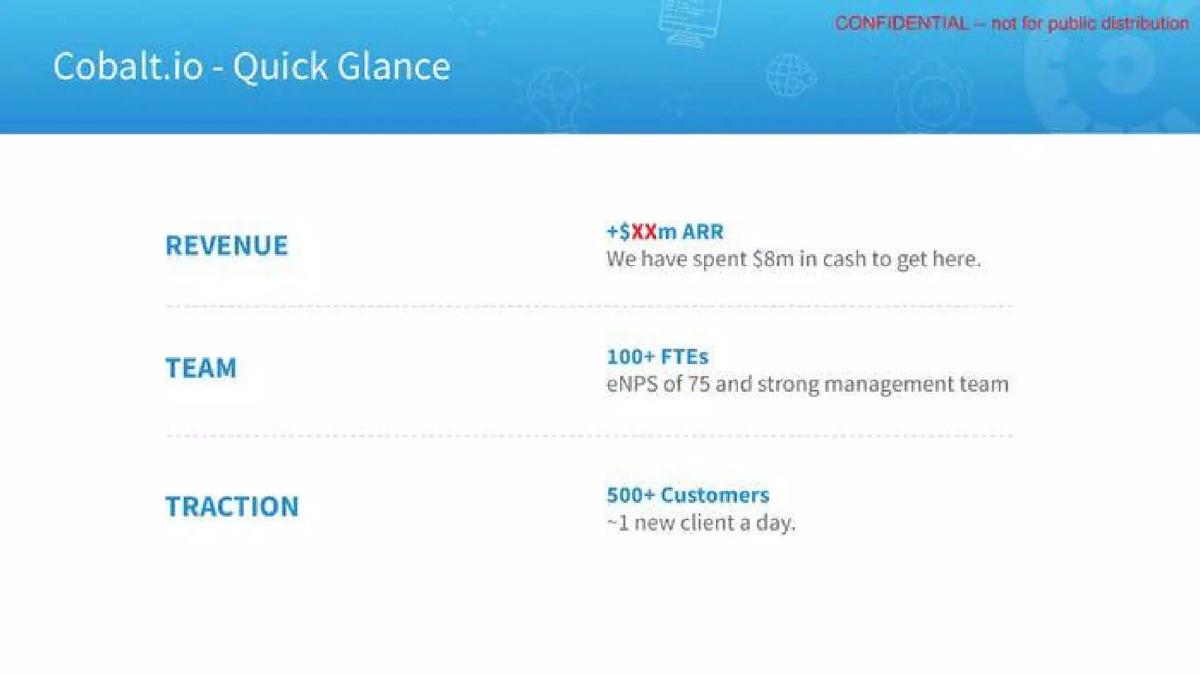
Series B. Penetration testing as a service. Three rows: revenue, team, traction.
Cobalt deck, slide 3. Exact stored slide matched to this analysis.
Our analysis: Partial: the capital-efficiency framing is useful, but the lead number is a placeholder in the published version.
Evidence and limitation: Cash spent, customer count and pace; the ARR figure is redacted.
What a founder can adapt: Put ARR beside cash spent to date.
Supporting analysis
What the deck claims: "Cobalt.io – Quick Glance." "+$XXm ARR. We have spent $8m in cash to get here." "100+ FTEs. eNPS of 75 and strong management team." "500+ Customers. ~1 new client a day."
Presentation choice: "Spent $8m to get here" invites the investor to compute efficiency.
When it does not fit: Redacted lead figures; remove the row instead.
Series B. AI voice assistant for business communications. Five highlight rows with icons.
AI Rudder deck, slide 2. Exact stored slide matched to this analysis.
Our analysis: Weak on purpose: highlights with one number, and a retention claim with none.
Evidence and limitation: One growth multiple and a country count; retention stated without a figure.
What a founder can adapt: Replace each adjective with the figure behind it.
Supporting analysis
What the deck claims: "Company Highlights." "Explosive Growth: revenue growing 4x year-on-year"; "Global Expansion: 10+ countries commercialized across Asia Pacific, Latin America, and Africa"; "Land & expand: High net revenue retention (NRR) with big accounts".
Presentation choice: Kept as a contrast. At Series B, "high NRR" without a percentage invites doubt.
When it does not fit: Retention or growth claims with no number or period.
Stage, lead figure, whether growth is shown over time, and whether the slide shows efficiency or retention.
Example
Stage
Lead figure
Over time
Efficiency or retention
Palta
Series B
$114.0M ARR, x10 in 2 years
Yes (9 quarters)
No
Juro
Series B
3x net ARR growth
Yes (5 quarters)
Yes (churn shown; NDR redacted)
Morty
Series B
800% YoY
Yes (7 quarters, no values)
Yes (flat expenses)
Borzo
Series C
$87M gross revenue
Yes (3 years incl. estimate)
Yes (positive cash flow claim)
1inch Network
Series B
$96B+ volume
No
Yes (53% retention)
BrowserStack
Series B
4M registered users
No
No
Cobalt
Series B
Redacted ARR
No
Partly ($8M spent)
AI Rudder
Series B
4x revenue growth
Partly (year-on-year)
Claimed, no figure
Key Takeaways
Show two or more years of revenue by quarter; one period is a seed or Series A pattern.
Break growth into parts: new business, expansion, churn, or regions.
Show efficiency: growth against expenses, cash spent, or margin.
Give market position with a named source (1inch cites its data query).
State every claim with a number; "high NRR" without a figure reads as a gap.
Build your growth-stage traction slide
Answer the three Series B questions: how big, how efficient, how durable.
Scale over time. ARR or revenue by quarter for at least two years.
Where growth comes from. Split by region, product, or new vs expansion.
Efficiency. Growth against expenses, burn, or cash spent to date.
Durability. Net dollar retention, churn, or market share with a source.
Copyable framework: [ARR] growing [rate] over [period], led by [driver]. [Efficiency figure]. [Retention figure].
Illustrative example 1 — written by us
Before: Land & expand: High net revenue retention (NRR) with big accounts
After: Net revenue retention of 128% across our 40 largest accounts over the last 12 months.
What improved: Our illustrative rewrite; the figures are invented for the example. It turns an adjective into a figure with a scope and a period.
What this guide adds
The seed vs Series A guide compares the two earliest priced rounds. This guide covers the next stage: decks recorded as Series B (six) or Series C (Borzo, and where noted). Stage labels come from the stage recorded for each published teardown, all high confidence.
None of these eight slides appears in another guide. Borzo appears in the marketplace business model guide (slide 5) and the unit economics guide (slide 6); this guide uses its slide 2.
What changes after Series A
Series A slides chart revenue from launch. Growth-stage slides chart it over years and split it: by region (Palta), by movement (Juro's expansion, new business, churn, contraction), by channel or line (Borzo's revenue, deliveries and new clients).
They add efficiency: Morty's expenses line, Cobalt's "We have spent $8m in cash to get here", Borzo's "positive cash flow in the most mature markets". And they claim position: 1inch "the highest-ranking DEX aggregator" with a ranked table and a source link.
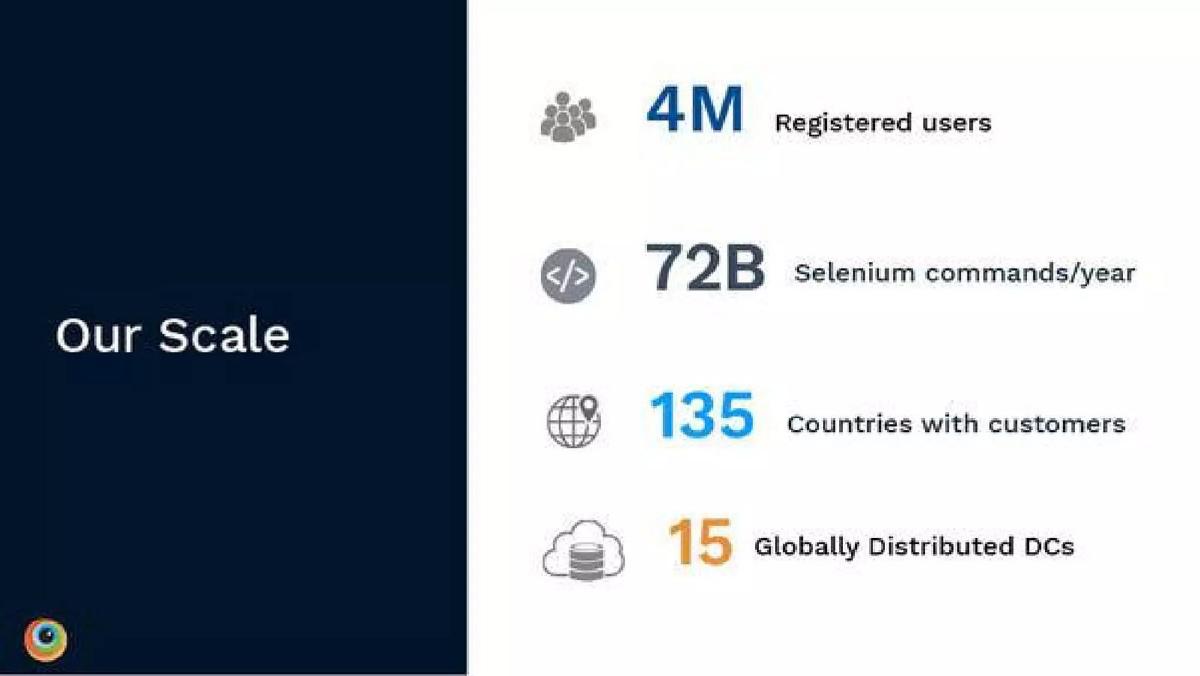
Scale figures (BrowserStack's "4M registered users", "135 countries with customers") show reach but not growth; pair them with a rate.
Common mistakes
One period only. Show two or more years by quarter.
Adjectives instead of figures. "High NRR" needs a percentage.
Redacted lead figures. Remove the row instead.
Scale with no growth. Add a rate to user or country counts.
Forecast mixed with actuals. Label estimated periods.
Diagnostic checklist
Revenue or ARR shown over two or more years.
Growth split by its main driver.
One efficiency figure.
One retention or durability figure.
No placeholders or unlabelled forecasts.
Frequently asked questions
How we chose these examples
Corpus: published pitch deck teardowns on StartupFundraising.com. Founder-uploaded private decks are excluded.
Selection (2026-09-25): we took teardowns whose recorded stage is Series B or Series C with high confidence, then searched slides for traction, growth, momentum or scale headings with revenue, customer or retention figures. Slides already used in another guide (for example Amplitude slide 2 in the SaaS traction guide, Minut slide 5 in the unit economics guide) were excluded. Esusu slide 8, Fortanix slide 13 and Lusha slide 10 were left out because their stored images are missing. Cobalt is marked partial; AI Rudder is kept as a weaker contrast.
Stage is the round recorded for each teardown, not a judgment about the company today.
Review: all eight stored slide images were inspected on 2026-09-25 and matched to company, deck and slide number (editorial model review). No person has yet completed an editorial review of this page.
Claims are as shown on the slides; we have not verified them. We make no claim that any slide caused a fundraising outcome.