Travel Startup Traction Slide Examples: 10 Real Pitch Decks
How travel startups show traction in a pitch deck: bookings, gross booking value, revenue per trip, repeat customers, reviews and subscribers.
Travel Traction Slide: Show Bookings, Value per Trip and Who Comes Back
Travel investors want to know three things from a traction slide: how many trips are being booked, how much each one is worth, and whether travellers come back or recommend the company. Travel is seasonal and booked well ahead of the trip, so a single month or a single total can mislead. The strongest travel traction slides give bookings or revenue over time, the value of an average booking, and one sign that customers return. This guide uses ten traction slides from ten travel startups, from a tour marketplace's first six months to a booking site with $1.1 million in yearly revenue.
TL;DR
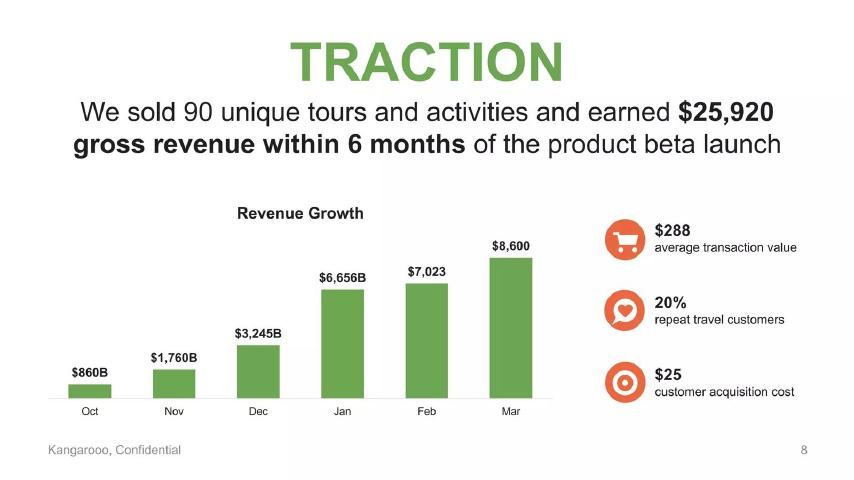
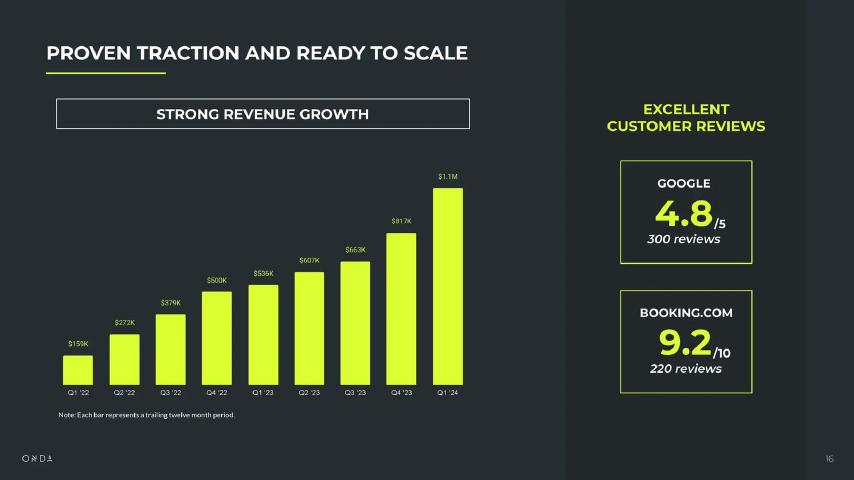
Give the total, the trend and the value per booking. Kangarooo states it sold 90 tours and earned $25,920 in six months, shows the monthly rise, and adds a $288 average sale, 20% repeat customers and a $25 cost to win a customer. Nimbus charts monthly revenue and average ticket per person side by side and adds cost per customer, margin and monthly spending. Onda shows twelve-month revenue rising from $159K to $1.1M, with review scores from Google and Booking.com. Squadtrip and Point.me lead with large totals: $2.4M in gross bookings, and 26,000 subscribers with $2M in revenue. Sparroow's table lists May revenue as 12000 while its chart shows a much lower figure, which is the kind of mismatch investors notice first.
Ten travel traction slides
Strongest first. Each example quotes the slide and notes what an investor can and cannot work out from it.
Kangarooo traction slide — slide 8
Tours and attractions marketplace for travellers in Australia. Slide titled "Traction".
Kangarooo deck, slide 8. Exact stored slide matched to this analysis.
Our analysis: Investors get the total, the monthly trend, the value of a sale, repeat customers and the cost of a customer on one slide.
Evidence and limitation: Company figures.
What a founder can adapt: Copy the structure: headline, monthly chart, three supporting figures.
Supporting analysis
What the deck claims: "We sold 90 unique tours and activities and earned $25,920 gross revenue within 6 months of the product beta launch". A "Revenue Growth" bar chart from October to March: labelled "$860B", "$1,760B", "$3,245B", "$6,656B", "$7,023", "$8,600" (the first four carry a stray "B"). Beside it: "$288 average transaction value", "20% repeat travel customers", "$25 customer acquisition cost".
Presentation choice: Every number a travel investor asks first is on the slide, and the total matches the average sale.
When it does not fit: Stray suffixes such as "B" on chart labels, and "gross revenue" without saying how much the company keeps.
Nimbus deck, slide 11. Exact stored slide matched to this analysis.
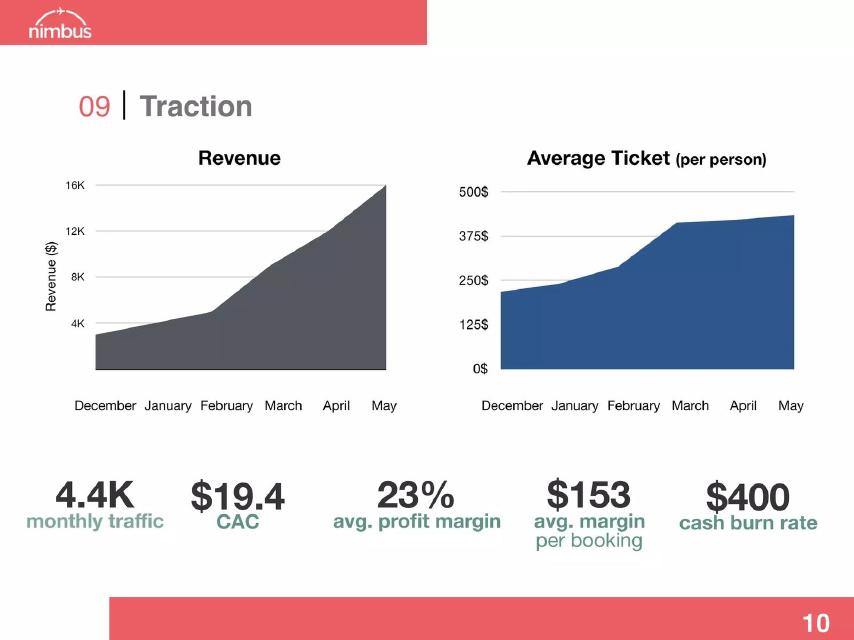
Our analysis: Revenue and price per person are both rising, and each booking earns well above what a customer costs.
Evidence and limitation: Company figures; chart values read from the axes.
What a founder can adapt: Put margin per booking next to cost per customer.
Supporting analysis
What the deck claims: Two charts from December to May: "Revenue" rising to about $16K, and "Average Ticket (per person)" rising to about $440. Below: "4.4K monthly traffic", "$19.4 CAC", "23% avg. profit margin", "$153 avg. margin per booking", "$400 cash burn rate".
Presentation choice: Margin per booking beside cost per customer lets investors check unit economics at a glance.
When it does not fit: Charts with no values on the bars, so totals must be read from the axis.
Group trip booking and payment software. Slide titled "Traction".
Squadtrip deck, slide 8. Exact stored slide matched to this analysis.
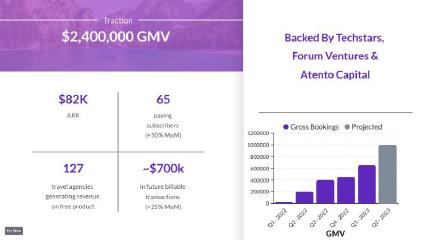
Our analysis: It separates money flowing through the product from the company's own recurring revenue.
Evidence and limitation: Company figures.
What a founder can adapt: Label gross bookings and your own revenue separately.
Supporting analysis
What the deck claims: "$2,400,000 GMV". "$82K ARR"; "65 paying subscribers (+50% MoM)"; "127 travel agencies generating revenue on free product"; "~$700k in future billable transactions (+25% MoM)". "Backed by Techstars, Forum Ventures & Atento Capital". A quarterly "Gross Bookings" chart with a projected next quarter.
Presentation choice: Showing GMV and ARR together stops investors confusing the two.
When it does not fit: Small grey labels that are hard to read on a screen.
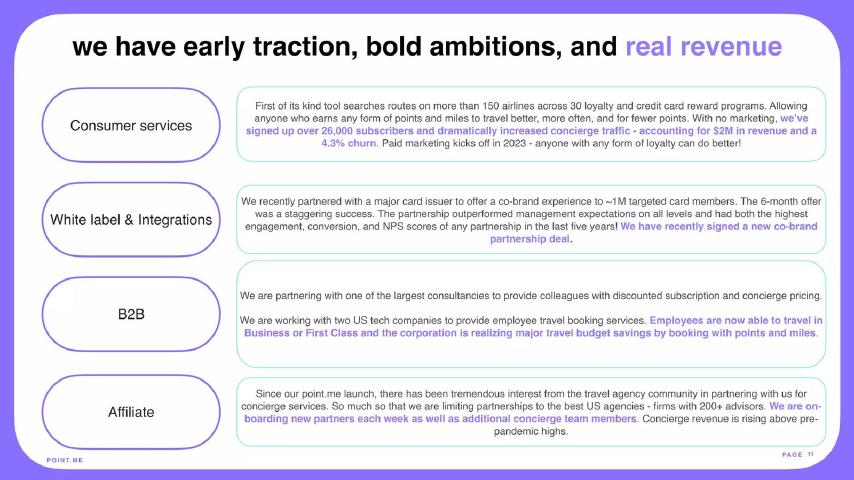
Search tool for booking flights with points and miles. Slide titled "we have early traction, bold ambitions, and real revenue".
Point.me deck, slide 11. Exact stored slide matched to this analysis.
Our analysis: Strong consumer numbers, plus three other channels described in words.
Evidence and limitation: Company figures and descriptions.
What a founder can adapt: Pull the three figures out of the paragraph into large type.
Supporting analysis
What the deck claims: "Consumer services": "With no marketing, we've signed up over 26,000 subscribers and dramatically increased concierge traffic - accounting for $2M in revenue and a 4.3% churn." "White label & Integrations": a co-brand offer with a major card issuer "to ~1M targeted card members" and "a new co-brand partnership deal". "B2B": partnerships with a large consultancy and two US tech companies. "Affiliate": "We are on-boarding new partners each week".
Presentation choice: Subscribers, revenue and churn together show demand and retention.
When it does not fit: Four blocks of small text with the best numbers buried in the first.
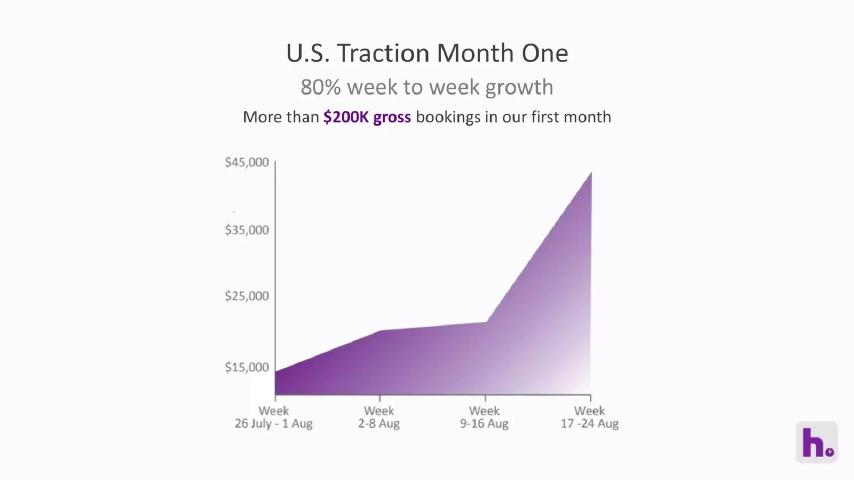
Hotel booking, demo day deck. Slide titled "U.S. Traction Month One".
Hot Hotels deck, slide 20. Exact stored slide matched to this analysis.
Our analysis: Fast early growth in a new market, clearly labelled as gross bookings.
Evidence and limitation: Company figures; weekly values read from the axis.
What a founder can adapt: Say "gross bookings" when that is what you mean.
Supporting analysis
What the deck claims: "80% week to week growth". "More than $200K gross bookings in our first month". A weekly chart from 26 July to 24 August rising from about $15,000 to about $43,000.
Presentation choice: One headline, one chart, one month is easy to absorb in a demo day pitch.
When it does not fit: Relying on four weeks of data without saying what comes next.
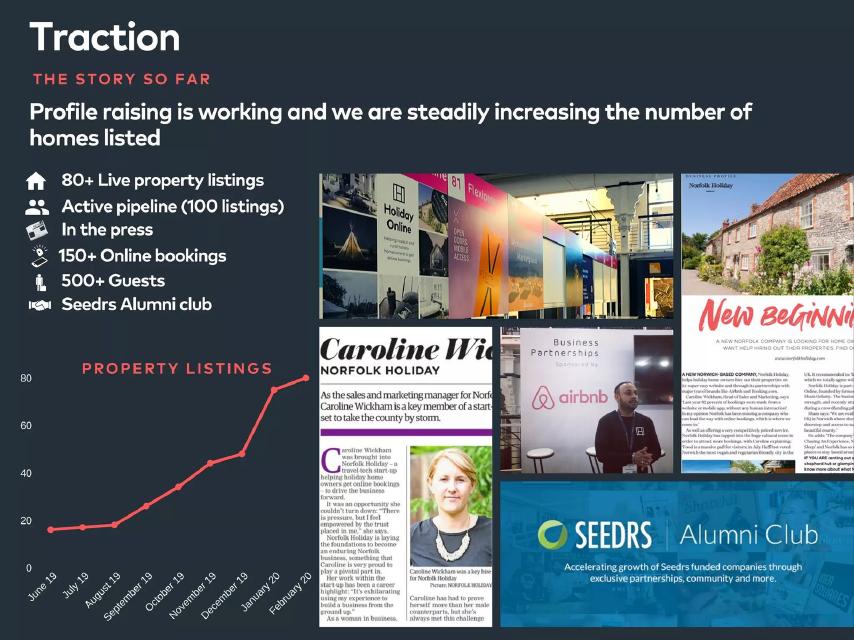
Holiday home listings and bookings. Slide titled "Traction: The story so far".
Holiday Online deck, slide 12. Exact stored slide matched to this analysis.
Our analysis: Supply growth is clear; bookings and guests are given as totals without a period or value.
Evidence and limitation: Company figures and press coverage.
What a founder can adapt: Add bookings per month and average booking value.
Supporting analysis
What the deck claims: "Profile raising is working and we are steadily increasing the number of homes listed". "80+ Live property listings", "Active pipeline (100 listings)", "In the press", "150+ Online bookings", "500+ Guests", "Seedrs Alumni club". A "Property listings" chart from June 2019 to February 2020 rising to about 80. Press clippings.
Presentation choice: For a marketplace, the listings chart shows the supply side growing.
When it does not fit: Press clippings taking more space than the numbers.
Travel Lisa deck, slide 4. Exact stored slide matched to this analysis.
Our analysis: Real revenue and spending at an early stage, though the revenue comes from licensing, not travellers.
Evidence and limitation: Company claims and figures.
What a founder can adapt: Put the revenue and burn in large type at the top.
Supporting analysis
What the deck claims: "Over these 1,5 months built an algorithm that outperform google cloud vision apis for real footage landmark pictures". "Api licensing of the algorithm, current revenue is $10k monthly." "Current burn rate is $4k a month". "Beta version of chatbot on Facebook messenger (200 people in beta)". A conference talk, a cross-promotion with a 500k-subscriber community and a hackathon win.
Presentation choice: Monthly revenue above monthly burn is rare this early and worth leading with.
When it does not fit: A performance claim against Google with no test shown.
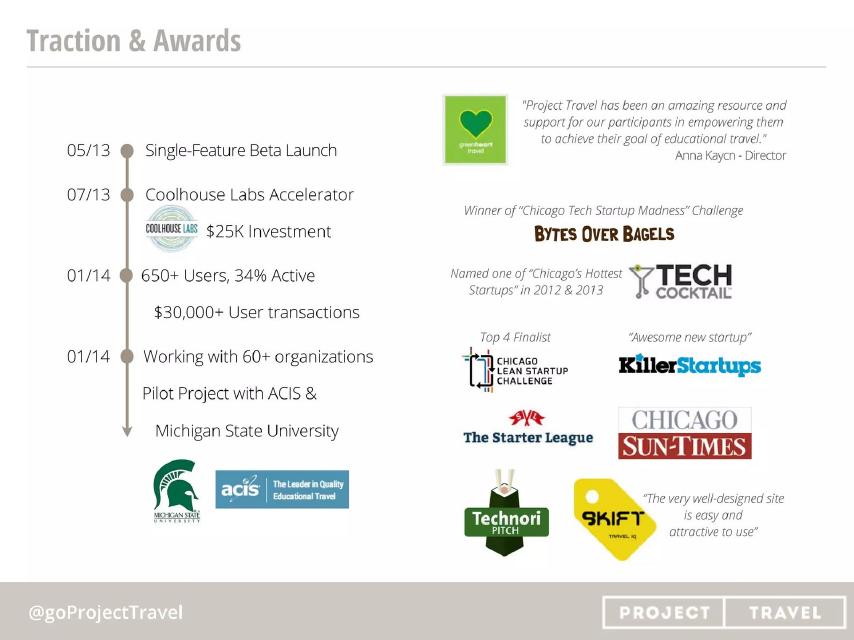
Group travel planning, 2014 deck. Slide titled "Traction & Awards".
Project Travel deck, slide 7. Exact stored slide matched to this analysis.
Our analysis: Users, active share and transactions are given with a date; half the slide is awards.
Evidence and limitation: Company figures and awards.
What a founder can adapt: Move the user and transaction figures into a chart over time.
Supporting analysis
What the deck claims: A timeline: "05/13 Single-Feature Beta Launch"; "07/13 Coolhouse Labs Accelerator, $25K Investment"; "01/14 650+ Users, 34% Active, $30,000+ User transactions"; "01/14 Working with 60+ organizations, Pilot Project with ACIS & Michigan State University". Award logos and two customer quotes.
Presentation choice: Giving the active share, not just sign-ups, is more honest than most early slides.
When it does not fit: Awards and logos crowding out the numbers.
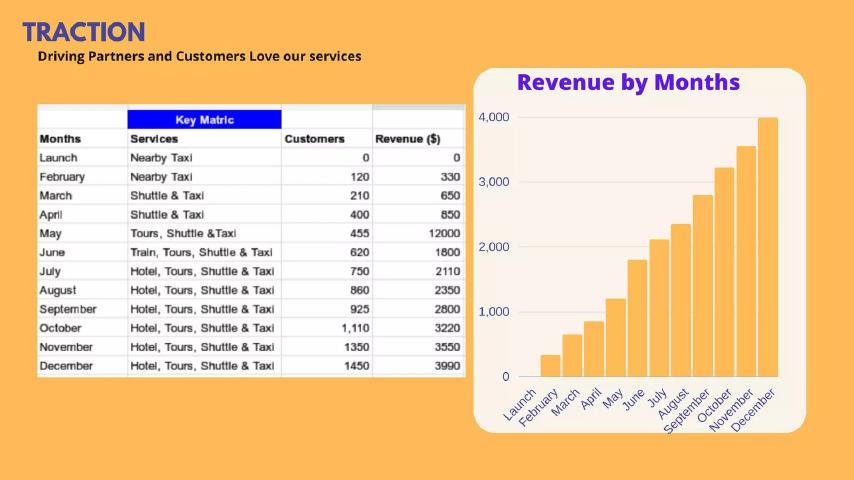
Travel booking app. Slide titled "Traction: Driving Partners and Customers Love our services".
Sparroow deck, slide 14. Exact stored slide matched to this analysis.
Our analysis: Steady monthly growth, but one table value disagrees with the chart and no currency is given.
Evidence and limitation: Company figures; no currency given.
What a founder can adapt: Check every table value against the chart and state the currency.
Supporting analysis
What the deck claims: A "Key Matric" table by month with services, customers and revenue: customers rise from 0 at launch to 1,450 in December; revenue from 0 to 3,990, with May shown as 12000. A "Revenue by Months" bar chart rising steadily to about 4,000.
Presentation choice: Monthly customers and revenue together are the right figures to show.
When it does not fit: A typo that makes one month ten times the others.
Whether each slide gives a trend, a value per booking and a sign of return.
Example
Trend over time
Value per booking
Return or reviews
Kangarooo
Monthly revenue
$288 average
20% repeat
Nimbus
Monthly revenue and ticket
$153 margin per booking
No
Onda
Quarterly, trailing 12 months
No
Google 4.8, Booking.com 9.2
Squadtrip
Quarterly gross bookings
No
No
Point.me
No
No
4.3% churn
Hot Hotels
Weekly, one month
No
No
Holiday Online
Monthly listings
No
No
Travel Lisa
No
No
No
Project Travel
Timeline
No
34% active
Sparroow
Monthly table and chart
No
No
Key Takeaways
Lead with bookings or revenue over time, not a single total.
Give the average value of a booking or trip.
Show one sign that travellers return or recommend you.
Say whether a figure is gross bookings or your own revenue.
Check every number in a table against its chart.
Build your travel traction slide
Gather these figures before you design the slide.
Trend. What were your bookings or revenue in each of the last six months or quarters?
Value. What is the average booking value, and how much of it do you keep?
Return. What share of travellers book again, or what do your reviews say and how many are there?
Label. Is each money figure gross bookings, revenue you keep, or recurring revenue?
Copyable framework: [Bookings] bookings worth [gross] in [period]; we kept [revenue]. Average booking [value]. [Return figure].
Illustrative example 1 — written by us
Before: Strong growth and happy travellers.
After: 1,200 bookings worth $360K in the last six months; we kept $54K. Average booking $300. 18% of travellers booked again within a year.
What improved: Our illustrative rewrite; all figures are invented for the example. It separates gross bookings from revenue and adds return.
What this guide adds
The general traction slide guide covers any startup. This guide covers travel, where money is paid long before the trip, demand rises and falls with the seasons, and much of what a booking site collects is passed on to hotels, airlines and tour operators. Those features change which numbers investors trust on a traction slide.
How we read each slide
We read each stored slide image and quote the text on it. We have not checked any company's bookings, revenue, customer numbers or reviews, and we make no claim that any slide affected a fundraising outcome.
The numbers travel investors look for
Bookings or trips: how many, and how fast they are growing. Kangarooo gives 90 tours; Holiday Online gives 150+ online bookings.
Gross bookings and revenue: the total travellers paid, and the share you keep. Squadtrip leads with $2,400,000 GMV and separately gives $82K ARR, which tells investors both.
Value per booking: the average sale or ticket. Kangarooo gives $288 average transaction value; Nimbus gives $153 average margin per booking and charts the average ticket per person.
Return and recommendation: repeat customers, churn or reviews. Kangarooo gives 20% repeat travel customers; Point.me gives 4.3% churn; Onda gives 4.8 out of 5 on Google from 300 reviews and 9.2 out of 10 on Booking.com from 220.
Cost to win a customer: Kangarooo gives $25 and Nimbus $19.4.
Gross bookings are not revenue
A travel booking site may collect $500 for a hotel stay and keep $50. If the slide shows only the $500, investors will assume you are inflating your size. Squadtrip handles this well: its headline is $2.4M in gross merchandise value, but the slide also gives $82K in annual recurring revenue from 65 paying subscribers. Hot Hotels says "gross bookings" outright.
Label every money figure: gross bookings, revenue you keep, or recurring subscription revenue. If you show only one, show the revenue you keep.
What investors check on a travel traction slide
Is it seasonal? Six months of growth from October to March may be the travel season, not the product. Say what period the figures cover and compare with the same months a year earlier if you can.
Is the growth recent or sustained? Hot Hotels shows four weeks of growth; Onda shows nine quarters. Both are useful, but they say different things.
Does each booking make money? Nimbus gives margin per booking and cost per customer on one slide, so investors can compare them.
Do travellers come back? Most people travel a few times a year, so repeat rates and reviews matter more than daily activity.
Common mistakes on travel traction slides
Numbers that disagree: Sparroow's table gives May revenue as 12000, ten times the months around it, while its chart rises steadily. One mistyped figure makes investors doubt the rest.
Totals with no time period: Holiday Online gives 150+ bookings and 500+ guests without saying over how long.
Awards in place of numbers: Project Travel's slide fills half its space with competition wins and logos, beside 650+ users and $30,000+ in transactions.
Paragraphs instead of figures: Point.me's figures are strong but sit inside four blocks of small text.
Choosing which numbers to show
Start with one chart of bookings or revenue by month or quarter, as Kangarooo, Nimbus and Onda do.
Add the average booking value and the share you keep, so investors can work out revenue from bookings.
Add one figure for return or recommendation: repeat rate, churn or review score with the number of reviews.
If you are early, give what is real and dated, as Travel Lisa does with $10k monthly revenue and a $4k monthly burn, rather than a long list of plans.
Adapting the slide to your type of travel business
Booking marketplaces for stays, tours or flights should show bookings, gross booking value, revenue kept and repeat customers.
Packaged and surprise trips should show trips sold, average price per person and margin per trip, as Nimbus does.
Accommodation operators should show revenue over time and review scores from the sites guests book on, as Onda does.
Subscription and software products for travellers or agencies should show paying subscribers, monthly growth and churn, as Squadtrip and Point.me do.
Early products should show users, active users and the first revenue, with dates, as Project Travel and Travel Lisa do.
Checking a total against its parts
Kangarooo gives enough figures for a rough check. It says it sold 90 tours and earned $25,920. Divided out, that is $288 per tour, exactly the average transaction value the slide shows. The monthly bars add up to about $28,000, slightly more than the headline. That arithmetic is ours, not the slide's; the gap may come from rounding or from what each figure includes.
When the parts on your slide add up to the headline, investors trust the rest. When they do not, explain why in a footnote.
Showing growth in a seasonal business
Travel demand swings with holidays and weather, so month-on-month growth can flatter or hide the real trend. Onda uses a trailing twelve-month total for each bar, which smooths out the seasons; its note reads "Each bar represents a trailing twelve month period". That is a strong choice for any travel company with more than a year of data.
If you have less than a year, say which season your months fall in and what you expect in the quiet months. Investors will ask either way.
Common mistakes
Gross bookings shown as revenue. Label each money figure.
Totals with no period. Say over how long.
Table and chart disagree. Check every value before sending.
Seasons ignored. Use trailing twelve months or compare the same months.
Awards crowding out numbers. Move awards to their own slide.
Best figures buried in text. Pull them into large type.
Diagnostic checklist
Bookings or revenue over time.
Average booking value.
Gross bookings and revenue labelled.
One sign of return or recommendation.
Time period stated for every figure.
Table values match the chart.
Frequently asked questions
What should a travel startup's traction slide show?
Bookings or revenue over time, the average value of a booking, and one sign travellers return or recommend you. Kangarooo shows all three: monthly revenue, a $288 average sale and 20% repeat customers.
Should I show gross bookings or revenue?
Show the revenue you keep, and gross bookings if you label them. Squadtrip shows $2.4M in gross bookings and $82K in annual recurring revenue on the same slide.
How do I show growth in a seasonal travel business?
Use trailing twelve-month totals, as Onda does, or compare the same months a year apart. If you have less than a year of data, say which season it covers.
Do review scores belong on a traction slide?
Yes, with the number of reviews and the site they come from. Onda gives 4.8 out of 5 on Google from 300 reviews and 9.2 out of 10 on Booking.com from 220.
How we chose these examples
Corpus: published pitch deck teardowns on StartupFundraising.com. Founder-uploaded private decks are excluded.
Selection (2026-10-01): we searched extracted slide text across the full corpus for traction slides that mention bookings, travel, hotels, trips, guests or flights. We shortlisted 10 travel slides from 10 companies not used in other guides, viewed all 10 and kept all 10.
Review: stored slide images were read on 2026-10-01 against company, deck and slide number, each read at full size (editorial model review). No person has yet completed an editorial review of this page. We did not verify any company's bookings, revenue, customers or reviews.