Racing the Leaders' Early Months: How AgFunder's Deck
A whole-deck walkthrough of AgFunder's 11-page deck: page 2 sets its $20m against CircleUp's $15m and LendingClub's $17.8m over similar-length windows.
Racing the Leaders' Early Months: How AgFunder's Deck Benchmarks Itself Against CircleUp and LendingClub
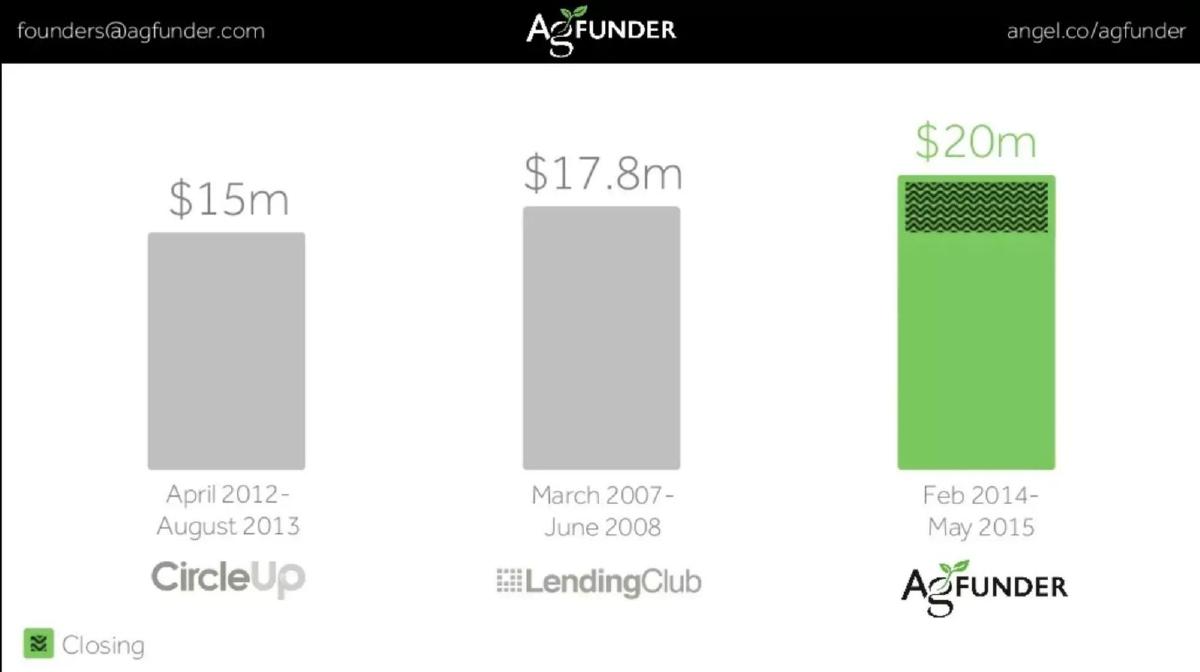
Comparing your early numbers with a famous company's early numbers is one of the fastest ways to tell investors what you might become. It's also easy to do unfairly. AgFunder's 11-page deck for an online investment platform in agriculture puts the comparison on page 2, before anything else: three bars for CircleUp ($15m, April 2012 to August 2013), LendingClub ($17.8m, March 2007 to June 2008) and AgFunder ($20m, February 2014 to May 2015), with the top of AgFunder's bar hatched and a legend reading 'Closing'. We read the deck page by page and test the comparison: what each bar measures, how much of AgFunder's is done, and what the platform earns from it.
TL;DR
A peer benchmark is fair when the windows, the measure and the status match, and when you say what the number means for your revenue. AgFunder's windows are well matched: roughly 16 to 17 months each. Its bar includes money still 'Closing', drawn as the hatched top, while the peers' bars are, presumably, completed history. And the three companies move different kinds of money: CircleUp raises equity for consumer brands, LendingClub (in that period) funded personal loans, and AgFunder raises equity for agriculture companies.
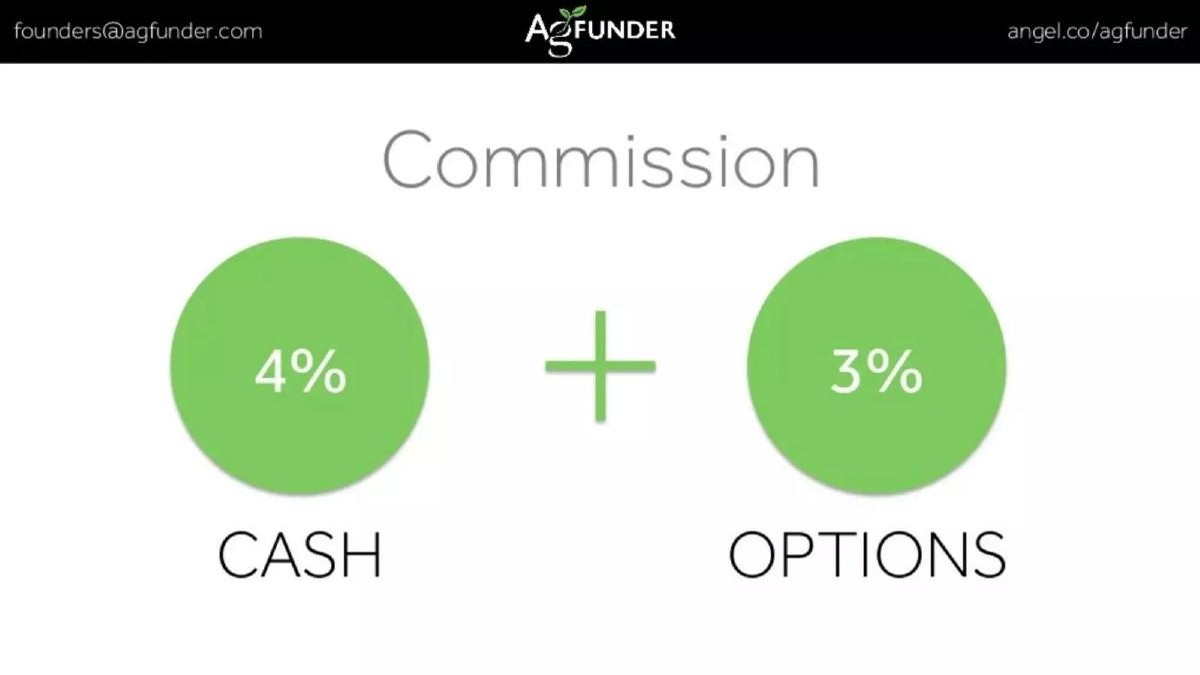
Page 8 supplies the missing step: 'Commission 4% CASH + 3% OPTIONS'. Applied to closed deals, that turns volume into revenue. The deck never does the sum, and it doesn't say how much of the $20m is closed.
The lesson for founders: match windows and stages, mark what's unfinished, explain why the peer is comparable, and follow the volume through to your own revenue.
The deck page by page, following the benchmark
Seven pages from AgFunder's 11-page deck, from the benchmark chart to the platform vision.
How each element of page 2's comparison holds up, and what would make it checkable.
Element
What the deck shows
Fair?
What would help
Window length
About 16–17 months each
Yes
Say each starts at launch
Status
AgFunder's top hatched 'Closing'
Tilted
Closed money as the bar; pending outlined
Kind of money
Equity (CircleUp, AgFunder) vs loans (LendingClub)
Partly
Explain comparability or use the closest peer
Era
2007–08, 2012–13, 2014–15
Context
Note market and rule changes
Sources
None for peers
Unchecked
Source line per peer
Revenue
4% cash + 3% options, separate page
Missing link
Commission earned beside the bars
Key Takeaways
Match the length and stage of benchmark windows.
Separate closed from closing in your own figure.
Explain why each peer moves comparable money.
Convert platform volume into your revenue.
Source peer figures and their dates.
Check your peer benchmark
Answer these before you put your number next to a famous company's.
Measure. Does each bar count the same kind of money or activity?
Window. Same length, and does each start at launch?
Status. Is your figure closed, or does it include pending deals?
Source. Where does each peer figure come from, and when?
Closest peer. Which peer is the nearest match, and why?
Revenue. What does your volume earn you?
Copyable framework: Capital raised on platform, first [n] months from launch: [Peer] $[x] ([dates], source); [Us] $[y] closed + $[z] closing ([dates]). Our cash commission on closed deals: $[c].
Illustrative example 1 — written by us
Before: Three unlabelled bars: $15m, $17.8m, and $20m with a hatched 'Closing' top.
After: Capital raised on platform, first 16 months from launch: CircleUp $15m ([source]); AgFunder $[18m] closed + $[2m] closing. Cash commission at 4%: about $[720K].
What improved: Our illustrative rewrite. Bracketed values are placeholders or our estimates from the chart, not AgFunder's stated figures; it makes the race checkable and adds the revenue line.
The question this guide answers
Our AgFunder teardown summarises the deck as a minimalist approach to agriculture capital markets. No guide uses its slides, and no walkthrough has looked at a deck that opens with a peer benchmark. Our Accel Club walkthrough covers decks built on borrowed industry figures; this one asks a narrower question: when a startup puts its own number next to peers' numbers on the same chart, what makes the comparison fair, and what should follow it?
How we read the deck
We rendered all 11 pages of the original file in our library and read each one, with page 2 also read at full size. Pages 8 and 9 show the same commission slide; page 9 adds the header bar, so the deck may have been exported with a duplicate. Page 2's AgFunder window ends in May 2015, so the deck was probably prepared around then; that's our inference. Every page carries a founders' email and an AngelList address. The library copy comes from PitchDeckHunt, a public deck collection. We make no claim about whether this deck raised money.
Peer figures are reported as the deck shows them; we haven't checked them against CircleUp's or LendingClub's own records. All arithmetic in this guide is ours and rounded.
Step one: press, then the benchmark
Page 1 shows a farm field with a sensor overlay ('HOME FARM', soil moisture 46%) and press logos: TechCrunch, Fast Company, CNNMoney, Agri Investor, Forbes, CNBC, Entrepreneur, The Huffington Post and Reuters. Page 2 is the three-bar chart, with no title.
Our reading: opening on a benchmark is a confident choice, and it works as a one-line pitch: we're moving faster than two companies you already know. The press logos on page 1 say the story has been covered, though they don't say what was written. The chart has no title or unit, so a reader infers that each bar is money raised through the platform in that window. That inference is reasonable, and the deck's later pages support it, but a title ('Capital raised on platform, first 16 months') would remove the guess.
Step two: testing the comparison
Windows. CircleUp's runs April 2012 to August 2013, about 17 months; LendingClub's March 2007 to June 2008, about 16 months; AgFunder's February 2014 to May 2015, about 16 months. That's a careful match on length. The deck doesn't say whether each window starts at launch, which is what makes a race fair; if CircleUp's or LendingClub's windows begin after launch, they show a later stage than AgFunder's.
Status. AgFunder's bar includes a hatched top marked 'Closing', about a fifth of the bar's height by our measurement. The peers' bars have no hatching. The bars aren't drawn to one scale (CircleUp's $15m bar is about 238 pixels tall and LendingClub's $17.8m bar about 263, a ratio of 1.10 rather than 1.19), so the pending amount can't be read from the drawing. That matters: if more than about $2.2m of the $20m was still closing, AgFunder's closed money falls below LendingClub's $17.8m, and the race on closed money is only won against CircleUp's $15m. Comparing closed history with partly-pending money tilts the race; the honest version shows AgFunder's closed figure as the bar and the closing amount as a separate outline, with both numbers printed.
Measure. The three bars may not count the same kind of money. LendingClub in 2007 and 2008 funded personal loans that are repaid in a few years; CircleUp and AgFunder raised equity for private companies. A dollar of consumer lending and a dollar of startup equity are different products with different revenue per dollar. That's not an error in the chart, but it's a reason to say why each peer is comparable, or to compare with the closest one only.
Era. The windows sit in different years, 2007 to 2008 during a financial crisis, 2012 to 2013 and 2014 to 2015 after US rules on online fundraising began to change. Market conditions differ, and a reader may weigh LendingClub's crisis-era figure differently. The deck gives no sources for either peer figure.
Step three: investors and the market
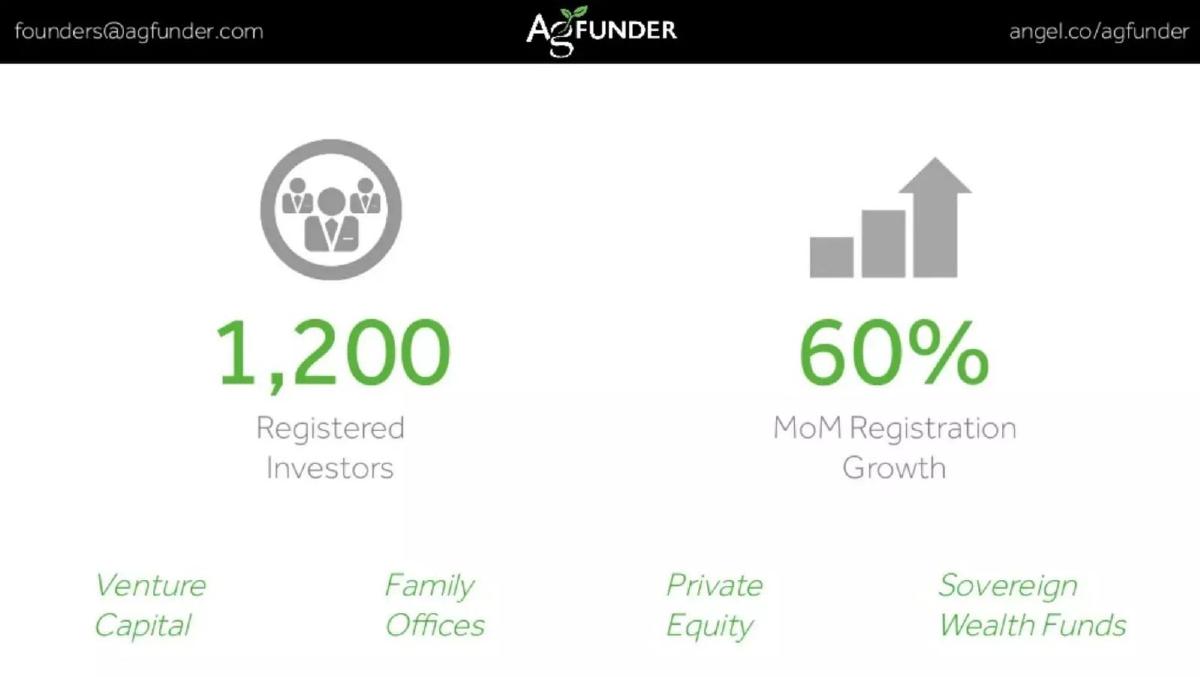
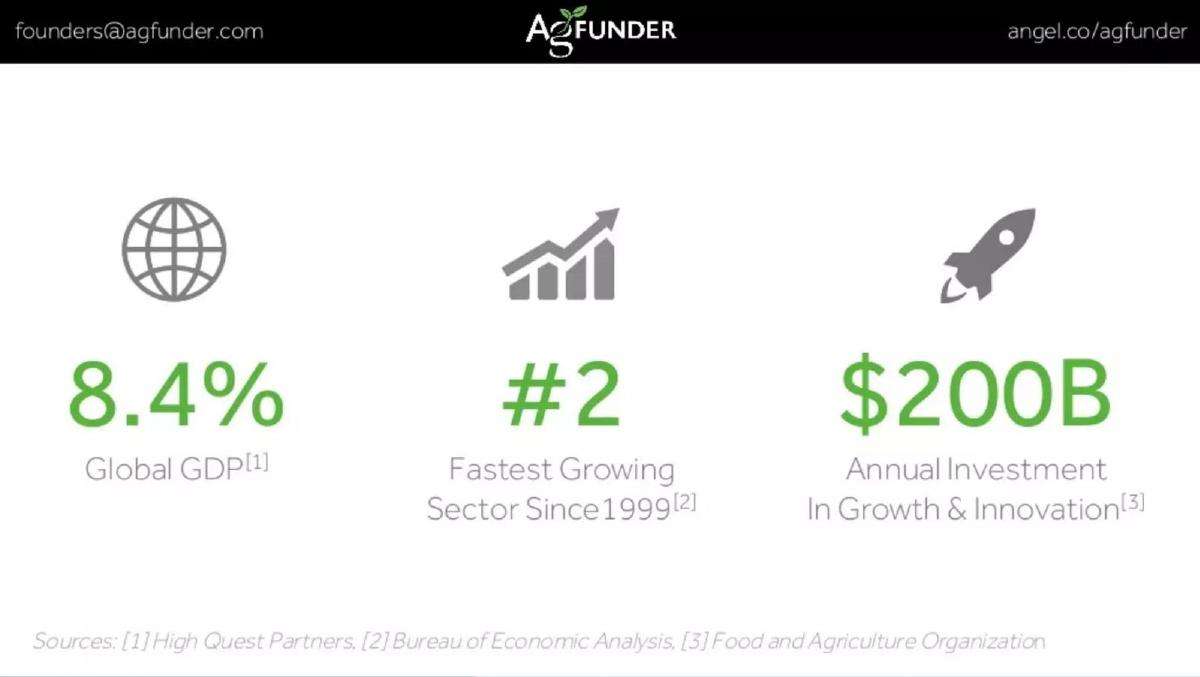
Page 3 shows '1,200 Registered Investors' and '60% MoM Registration Growth', with four investor types: 'Venture Capital', 'Family Offices', 'Private Equity' and 'Sovereign Wealth Funds'. Page 4 shows '8.4% Global GDP', '#2 Fastest Growing Sector Since 1999' and '$200B Annual Investment In Growth & Innovation', with footnoted sources: High Quest Partners, the Bureau of Economic Analysis and the Food and Agriculture Organization.
Our reading: page 3 is the platform's demand side. 'Registered' isn't 'invested', so a reader can't tell how many of the 1,200 put money into the $20m, or the average cheque. The investor types are institutional, which suggests large cheques, but the page doesn't say how many of each type have registered. 60% monthly growth in registrations is fast; the period isn't stated, and at that rate the base would have been small a few months earlier.
Page 4 is the only page with sources, and that's to its credit. Its three figures describe agriculture as a whole. The '#2 fastest growing' claim cites a US source, while '8.4% of global GDP' and '$200B' are global, so they're different scopes rather than a contradiction. None of them is the market AgFunder serves, which is equity raised online by agriculture companies.
Step four: deals as evidence
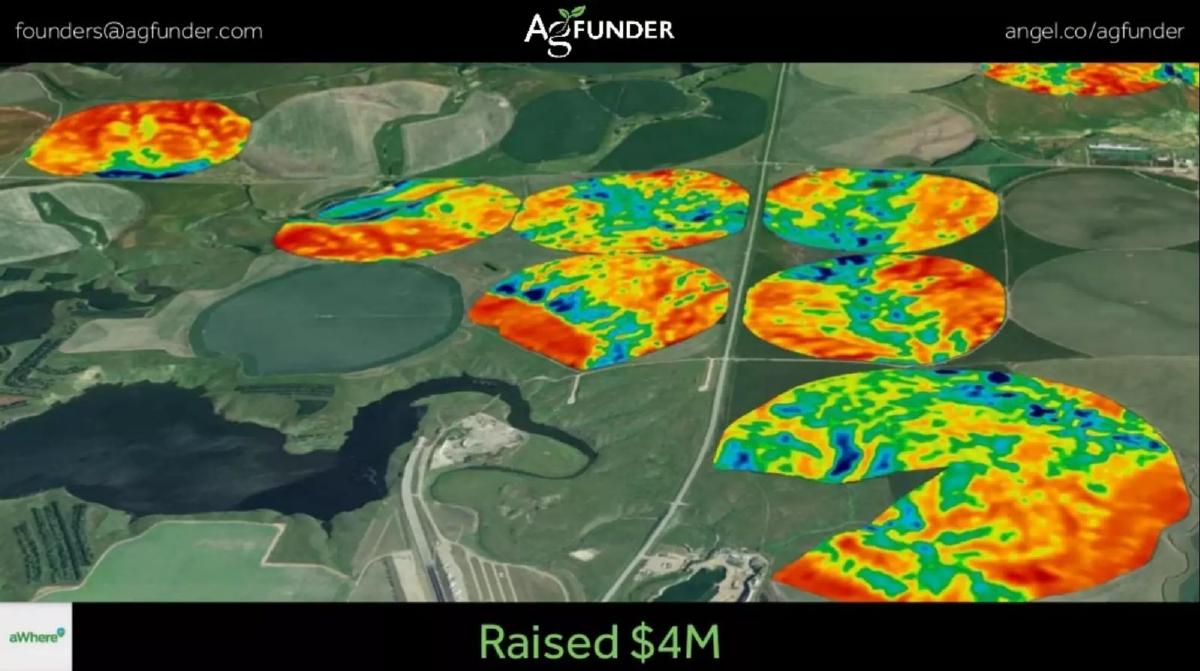
Page 5 is a joke: the cast of a technology comedy series in black turtlenecks, one in an AgFunder cowboy hat. Page 6 shows satellite crop imagery with an 'aWhere' logo and 'Raised $4M'. Page 7 shows the Edyn logo, a garden sensor and its app, with 'Raised $2M / Closing on $3M'.
Our reading: the two deals are the most concrete evidence in the deck and they connect to page 2: they're examples of the money in AgFunder's bar. 'Closing on $3M' matches the hatched 'Closing' idea, so some of the $20m may be rounds like Edyn's that are still open. The deck doesn't say whether AgFunder raised all of each round or part of it; '$4M raised' could be a company's whole round with AgFunder investors contributing some of it. That changes what the $20m means and what commission AgFunder earned.
Our reading: this is the page that makes page 2 matter to an investor in AgFunder rather than its deals. If the 4% cash commission applies to money raised through the platform, then every $1m closed brings about $40,000 in cash, plus options worth 3% of the raise in the companies themselves. On the deck's figures, if all $20m closes, that is about $800,000 over 16 months; every $1m still closing removes about $40,000. That's our illustration, assuming the rate applies to the whole amount, which the deck doesn't confirm. The options are a different kind of asset: they could be worth much more or nothing, and they pay only when a company exits.
The deck leaves this sum for the reader. Putting it next to the benchmark ('$20m raised, about $800K in cash commission, plus options in [n] companies') would turn a volume chart into a revenue chart, and it would let a reader compare AgFunder's earnings with its peers' as well as its volume.
Step six: team and platform
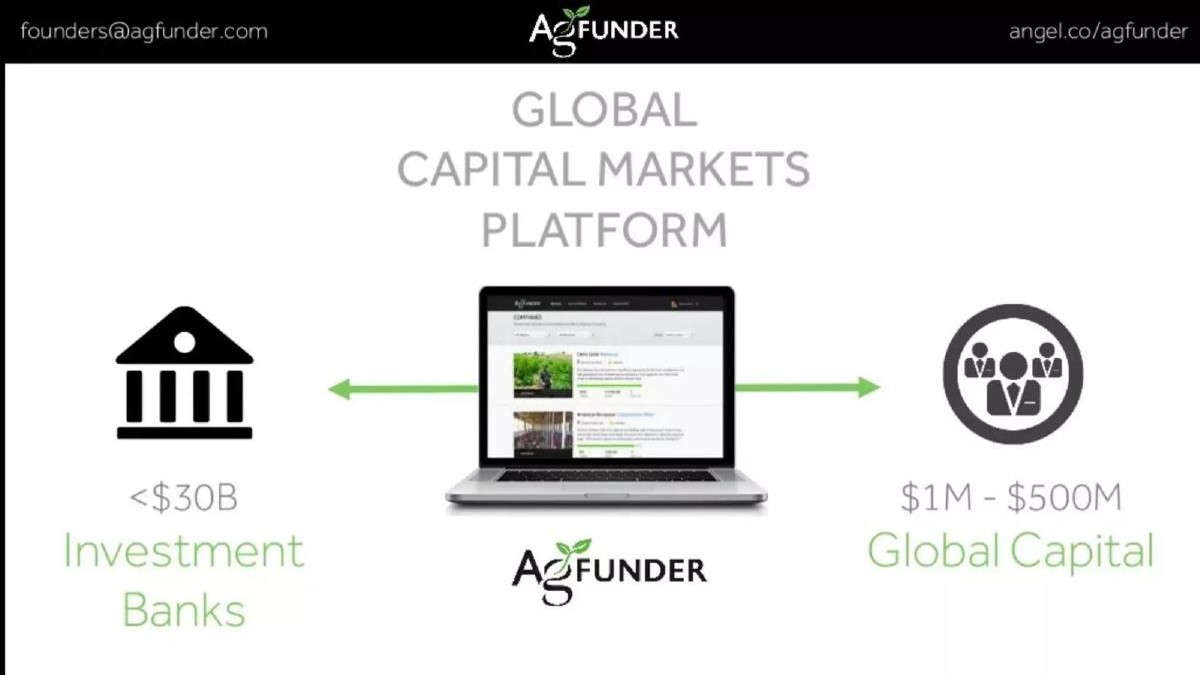
Page 10 shows the founders, Rob Leclerc, PhD (Founder / CEO) and Michael Dean, JD, LLM (Founder / COO), five more team members, and logos including BCG, Morgan Stanley, Yahoo!, Elance, Yale, Oxford, Princeton, Kellogg and Berkeley. Page 11, 'Global Capital Markets Platform', shows investment banks on one side, labelled under $30B, a laptop in the middle, and '$1M - $500M Global Capital' on the other.
Our reading: the team's finance and online-marketplace backgrounds fit the business. Page 11 suggests AgFunder wants to serve deals from $1m to $500m and compete with investment banks, which is a larger ambition than the early-stage deals on pages 6 and 7. The deck doesn't say what the bank figure measures or how the platform would win larger deals. It ends without an ask.
Building a fair benchmark
Five changes would keep the force of page 2 and remove the doubts. Title the chart with its measure and window. Start each peer's window at launch, or say where it starts. Draw your bar as closed money only, with pending money as a dashed outline beside it. Add a source line for each peer figure. And pick the closest peer first: for AgFunder, CircleUp is a nearer match than LendingClub, because both raise equity for private companies.
Then put the revenue line under the chart. A benchmark tells investors you can attract volume; commission tells them you can earn from it. A founder who shows both on one page answers the next two questions before they're asked.
What a reader can't tell
Missing from the deck as published: whether each window starts at launch; the sources for the CircleUp and LendingClub figures; how much of AgFunder's $20m is closed; whether aWhere's and Edyn's figures are whole rounds or AgFunder's part; how many of the 1,200 registered investors invested; the period behind 60% monthly growth; whether the 4% applies to all money raised; commission earned to date; what the investment-bank figure measures; the ask; and the deck's date. We don't guess at any of these.
When this structure works
Our view, drawing on this deck: leading with a peer benchmark is powerful when investors already know the peers and the comparison is fair on its face. AgFunder's choice of similar-length windows shows care. The structure is strongest when the reader can check the race (same start, same status, same kind of money) and when the next page turns volume into the company's own revenue.
Common mistakes
Pending money in the race. Show closed and closing separately.
Windows that start at different stages. Start each at launch, or say where.
Different kinds of money. Explain why peers are comparable.
Unsourced peer figures. Add a source and date for each.
Volume without revenue. Show what the volume earns you.
Diagnostic checklist
The benchmark chart has a title and unit.
Windows match in length and start point.
Your figure separates closed from pending.
Each peer figure is sourced.
Comparability of each peer is explained.
Revenue from the volume is shown.
The ask is stated.
Frequently asked questions
Is it a good idea to compare my startup with a famous company in my pitch deck?
Yes, if the comparison is fair: the same measure, windows of the same length starting at the same stage, completed figures on both sides, and sources. Explain why the peer is comparable.
Had AgFunder closed $20m when it made this deck?
Not all of it, on the deck's own chart. The top of its bar is hatched and labelled 'Closing'. The deck doesn't say how much was closed.
How does AgFunder make money, according to the deck?
Page 8 shows a commission of 4% in cash plus 3% in options. The deck doesn't say how much commission it had earned.
Is LendingClub a fair comparison for AgFunder?
The time windows are similar, but LendingClub funded personal loans in 2007–08 while AgFunder raised equity for agriculture companies. CircleUp, which raises equity, is a closer match.
Did AgFunder raise money with this deck?
The deck gives no ask, and we haven't confirmed any funding from it, so we make no claim that it raised money.
How we chose these examples
Selection (2026-10-02): saved lead from the previous run. Distinctness check: the teardown summarises the deck and no guide uses its slides; the Accel Club walkthrough covers borrowed industry figures and the ActivityHero walkthrough covers booked value versus revenue, while this walkthrough asks what makes a head-to-head peer benchmark fair and how platform volume becomes revenue.
All 11 pages of the original deck file (sha256 8b1d2979…, matching our inventory) were rendered at 1200 px wide and read on a contact sheet at about 600 px per page; page 2 was also read at full size (AI editorial model review, not human). Seven images are used: pages 8, 10 and 11 were stored for this draft on 2026-10-02 from the renders, and pages 2, 3, 4 and 6 reuse images already in our library.
Window lengths, the closing share (estimated by eye from the hatched area) and commission figures are our rounded arithmetic. The deck's date (around May 2015) is our inference from page 2. Peer figures are reported as shown and not independently checked.
Eligibility: private company; the deck comes from PitchDeckHunt, a public deck collection, and is already in our library with an existing teardown; no takedown request is recorded. Team, deal and press details are reported as shown. No funding or outcome claim is made.