AgFunder’s 11-slide deck from 2013 presents a streamlined vision for a global capital markets platform dedicated to agriculture. Rather than relying on dense text, the founders use large-scale icons and high-contrast graphics to highlight 60% month-over-month registration growth (Slide 3) and a clear revenue model consisting of 4% cash and 3% options (Slide 8). The deck successfully positions the company alongside fintech giants like LendingClub and CircleUp, suggesting a total addressable market where agriculture represents 8.4% of global GDP (Slide 4). While it lacks a traditional 'problem'…
Key takeaways
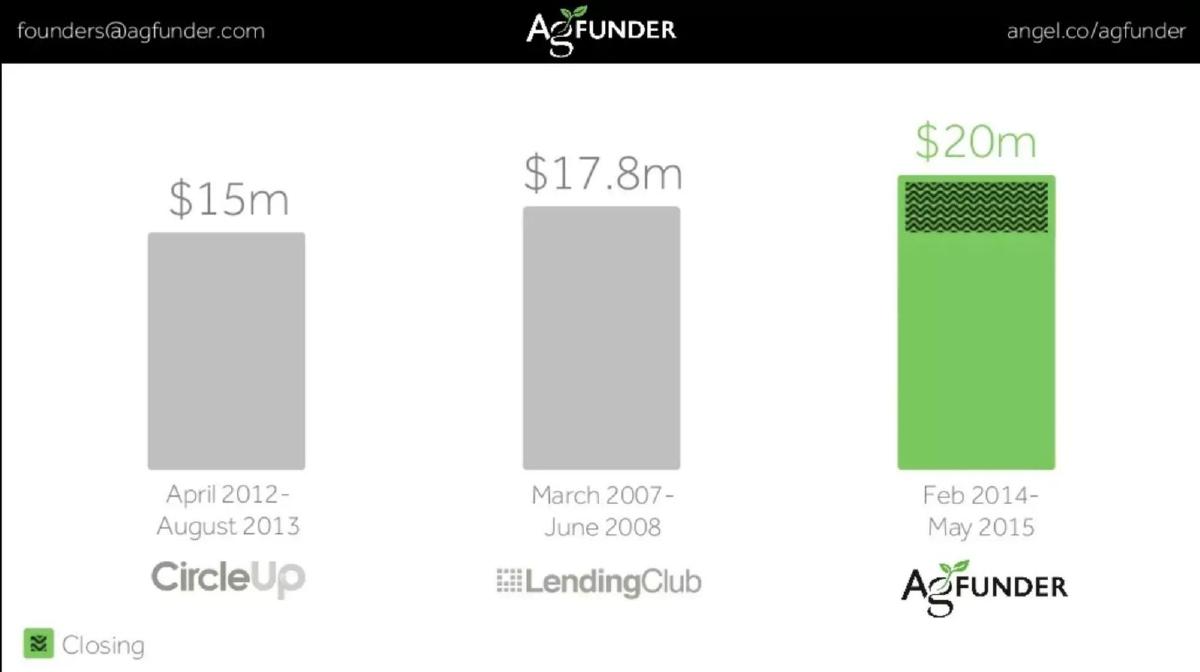
- The deck uses a comparative benchmarking strategy on Slide 2, placing AgFunder's $20m projection alongside CircleUp ($15m) and LendingClub ($17.8m).
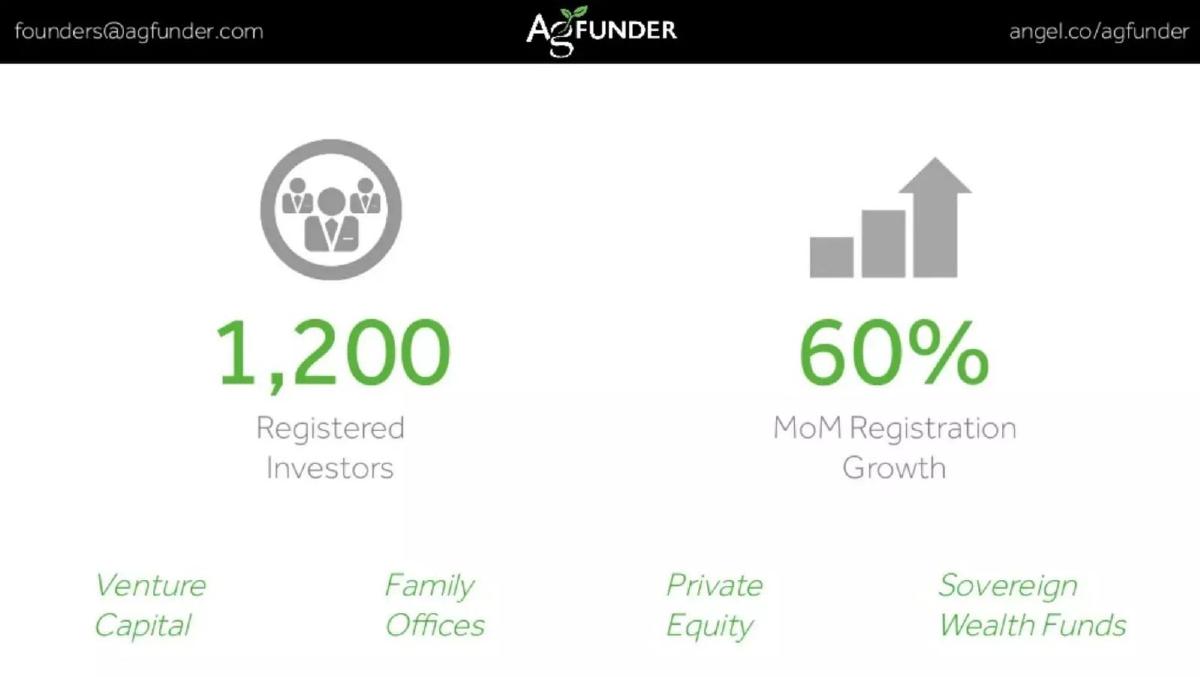
- Traction is evidenced by 1,200 registered investors and a 60% month-over-month growth rate in registrations on Slide 3.
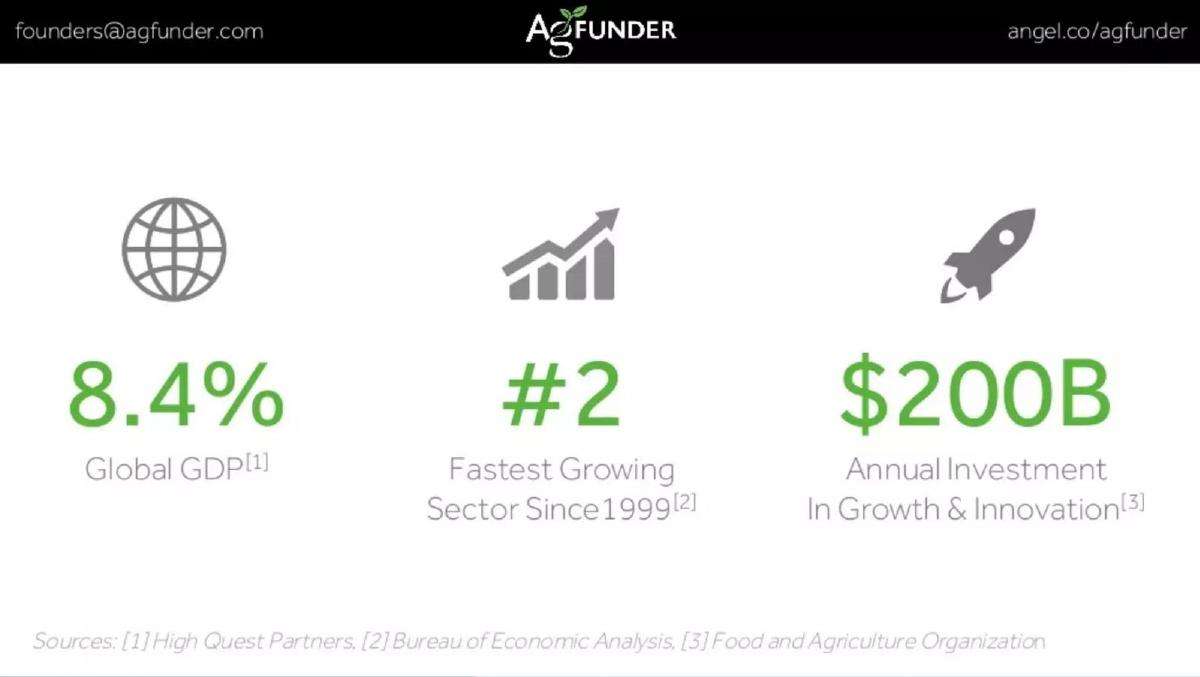
- Market size is defined by agriculture's 8.4% share of global GDP and $200B in annual growth and innovation investment (Slide 4).
- The revenue model is explicitly stated on Slide 8 and Slide 9 as a commission of 4% cash plus 3% options.
- The platform facilitates capital flow between investment banks and global capital ranging from $1M to $500M (Slide 11).
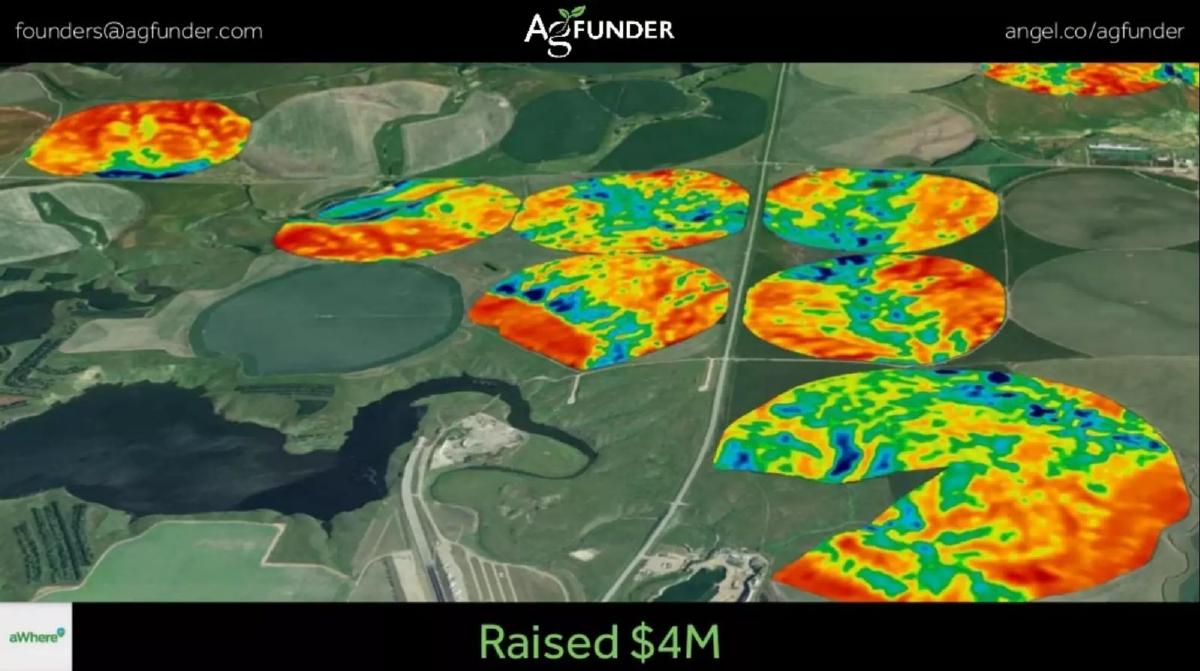
- Specific deal proof is provided through the aWhere $4M raise (Slide 6) and the Edyn $2M raise (Slide 7).
- The team slide (Slide 10) emphasizes academic and corporate pedigree, featuring logos from BCG, Morgan Stanley, Yale, and Oxford.
- The deck omits a formal 'Ask' slide, failing to specify the exact amount of capital being raised in this specific round.
What this deck is
The AgFunder pitch deck from 2013 is a lean, 11-slide presentation designed to position the company as the 'LendingClub of Agriculture.' At a time when agtech was still a niche vertical, this deck focused on bringing institutional-grade credibility to the sector. It relies heavily on large-scale typography and iconography, minimizing text to ensure the focus remains on growth metrics and the revenue model. The deck serves as a bridge between the traditional world of agriculture and the emerging world of equity crowdfunding and fintech.
Slide 1: Title and Media Validation
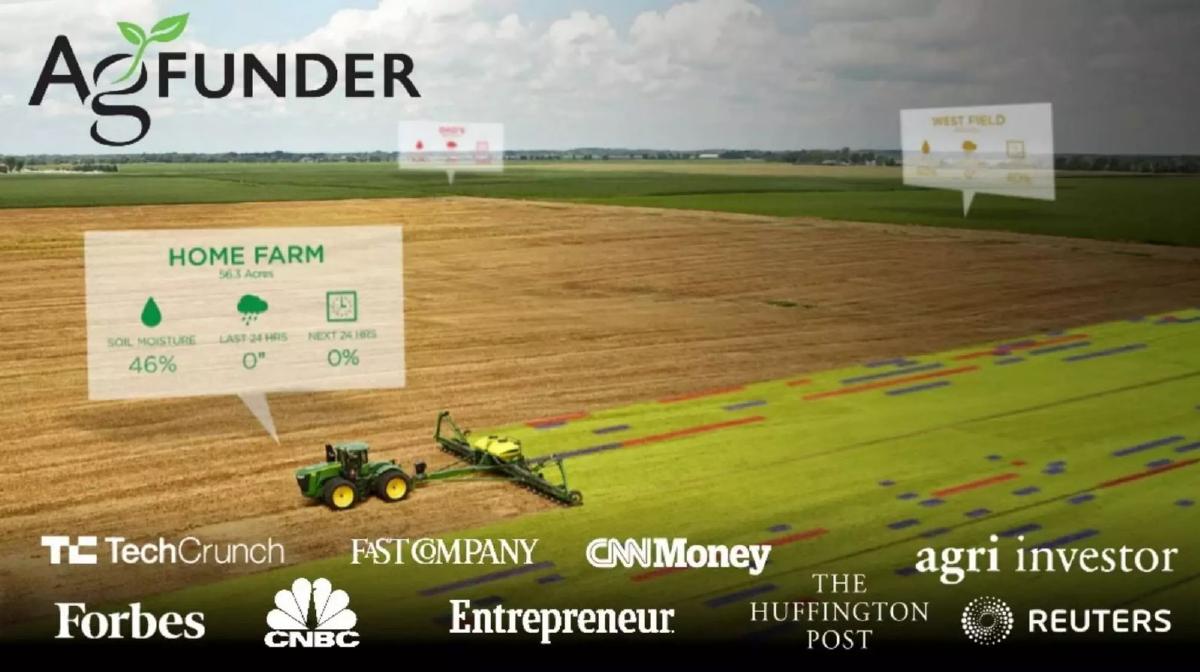
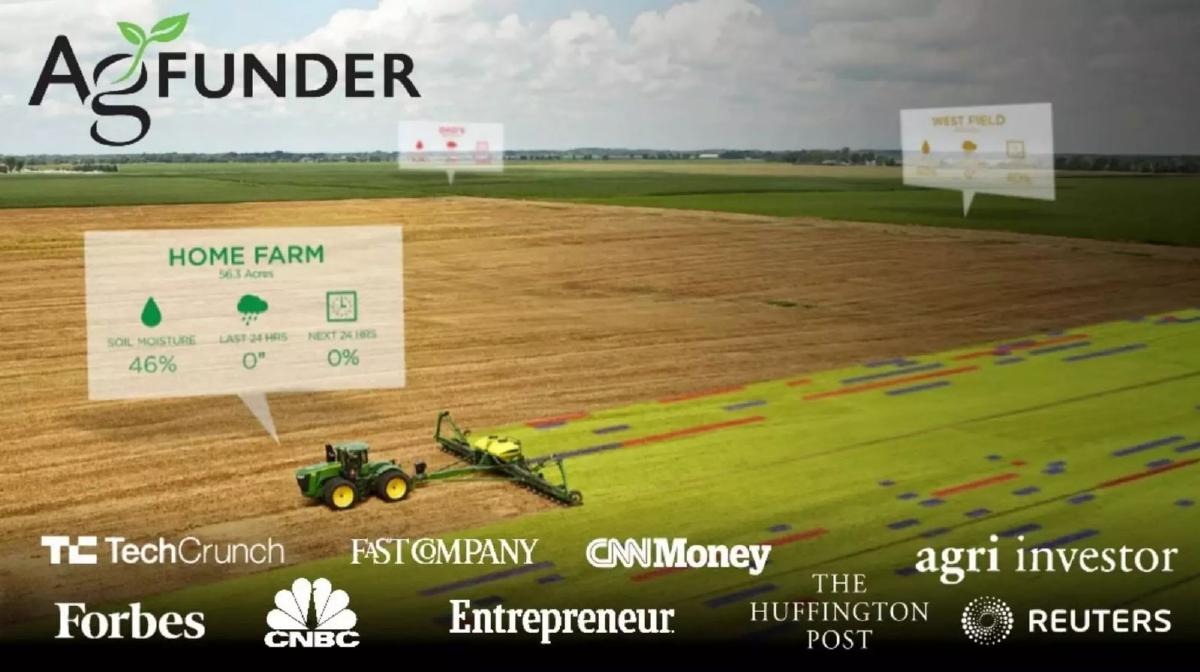
The cover slide features the AgFunder logo over a high-resolution image of a tractor in a field, overlaid with digital data points like 'Soil Moisture 46%' and 'Home Farm 56.3 Acres.' This immediately signals the 'tech' in AgTech. Crucially, the bottom of the slide is anchored by a row of high-authority media logos, including TechCrunch, Forbes, CNBC, Fast Company, CNN Money, Entrepreneur, The Huffington Post, Agri Investor, and Reuters. This is a classic social proof tactic to establish immediate legitimacy before the first data point is even shown.
Slide 2: Benchmarking and Projections
Slide 2 is a bar chart that uses a 'comparable' strategy. It shows CircleUp at $15m (April 2012 - August 2013) and LendingClub at $17.8m (March 2007 - June 2008). The third bar is AgFunder, highlighted in green, projecting $20m for the period of Feb 2014 - May 2015. By placing themselves next to established fintech winners, AgFunder is telling investors that they are following a proven trajectory in a new vertical. The '$20m' figure is the central focus of the slide, though the deck does not explicitly state if this refers to platform volume or company revenue at this stage.
Slide 3: Investor Traction
This slide focuses on the demand side of the marketplace. It lists 1,200 Registered Investors and highlights a 60% MoM Registration Growth . Below these figures, they list their target segments: Venture Capital, Family Offices, Private Equity, and Sovereign Wealth Funds. This slide is critical because it demonstrates that the platform has already solved the 'cold start' problem of a two-sided marketplace by securing a significant base of high-net-worth and institutional capital.
Slide 4: The Macro Opportunity
AgFunder moves from internal metrics to the global market. They cite three sources (High Quest Partners, Bureau of Economic Analysis, and the Food and Agriculture Organization) to support three massive claims: Agriculture is 8.4% of Global GDP , it is the #2 Fastest Growing Sector Since 1999 , and there is $200B in Annual Investment In Growth & Innovation . This slide justifies why a fintech platform should exist specifically for this sector, rather than being a generalist platform.
Slide 5: Cultural Identity
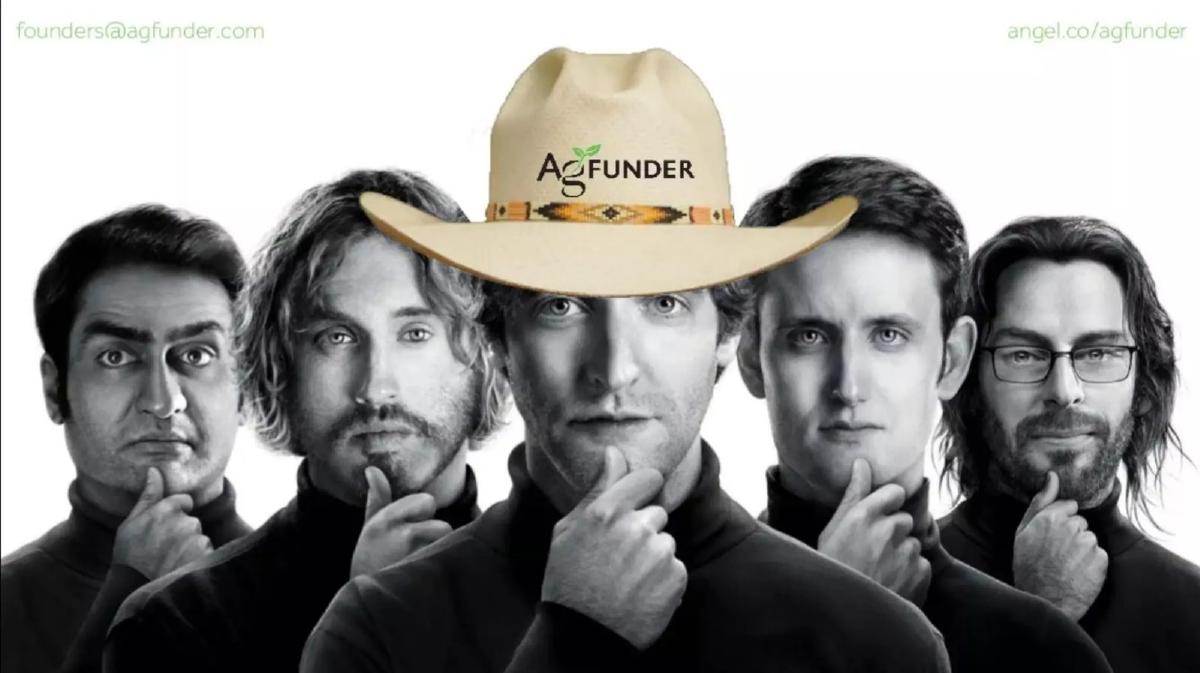
Slide 5 is a curious addition. It features a black-and-white photo of five men (presumably the team or a representation of the 'Silicon Valley' archetype) with the central figure wearing a cowboy hat with the AgFunder logo. There is no text on this slide. It appears to be a visual metaphor for the company's position at the intersection of Silicon Valley technology and traditional 'boots on the ground' agriculture. While it adds personality, it provides no hard data.
Slide 6 & 7: Portfolio Proof Points
These two slides function as 'deal cards.' Slide 6 shows 'aWhere,' a weather data company, noting it Raised $4M . Slide 7 shows 'Edyn,' a hardware sensor, noting it Raised $2M / Closing on $3M . By showing successful raises for both a data/software company and a hardware company, AgFunder demonstrates the breadth of their platform's reach and their ability to close multi-million dollar rounds.
Slide 8 & 9: The Revenue Model
AgFunder does something rare in early-stage decks: they show the exact same slide twice (Slide 8 and Slide 9). This may have been a technical error in the uploaded deck or a deliberate attempt to emphasize the point during a presentation. The slide titled 'Commission' shows a simple equation: 4% CASH + 3% OPTIONS . This is a very clear, high-margin revenue model that gives the company both immediate cash flow and long-term equity upside in the companies they fund. It removes any ambiguity about how the platform makes money.
Slide 10: The Team
The team slide features two primary founders: Rob Leclerc, PhD (Founder / CEO) and Michael Dean, JD, LLM (Founder / COO) . Below them are five additional team members. The slide is heavy on institutional logos: BCG, Morgan Stanley, Yahoo!, Elance, Yale, Oxford, Princeton, Kellogg, and Berkeley. This emphasizes that while they are in the 'Ag' space, the team has the 'Blue Chip' pedigree expected by Silicon Valley investors.
Slide 11: The Platform Vision
The final slide summarizes the AgFunder ecosystem. It depicts a laptop showing the AgFunder interface, flanked by 'Investment Banks' (noted as <$30B) on one side and 'Global Capital' ($1M - $500M) on the other. This positions AgFunder as a Global Capital Markets Platform . It suggests that they are not just a crowdfunding site for small startups, but a serious financial utility capable of moving hundreds of millions of dollars between institutional players.
What works in this deck
The primary strength of this deck is its extreme clarity . By using a 4% + 3% commission model as a standalone slide, the founders avoid the 'revenue fluff' that plagues many early-stage decks. The benchmarking against LendingClub and CircleUp is also a brilliant move; it allows the investor to use an existing mental model to understand AgFunder's business, simply swapping the vertical from 'personal loans' or 'consumer goods' to 'agriculture.'
The use of specific deal amounts (Slide 6 and 7) provides concrete evidence that the platform works. Many marketplace decks talk about 'potential' volume, but AgFunder shows actual millions raised for actual companies. Finally, the team slide effectively uses logos to communicate 'competence' without requiring the reader to scan long biographies.
What is missing from this deck
The most glaring omission is a specific 'Ask' slide . While the deck mentions a $20m projection, it never states how much the company is currently raising from the investors viewing this deck. There is also no mention of the 'Use of Funds'—will the money go toward engineering, sales, or regulatory compliance?
Additionally, the deck lacks a competitive landscape . While they benchmark against fintech companies in other sectors, they don't address who else is trying to digitize ag-financing. There is also no unit economics data beyond the commission percentage. Investors would likely want to know the cost of acquiring a registered investor (CAC) versus the lifetime value (LTV) of the commissions generated from that investor's activity.
What a founder should copy
Founders should emulate the visual hierarchy used here. AgFunder uses very little text, opting instead for large numbers and clear icons. This makes the deck highly 'skimmable,' which is essential for busy VCs. The comparative benchmarking on Slide 2 is another excellent tactic for founders entering a 'niche' vertical; by tying your startup to a successful company in a different vertical, you make your business model feel less risky.
Finally, the transparency of the revenue model on Slide 8 is a best practice. If you have a clear way of making money, don't hide it in a complex table. Put it in giant green circles. It shows confidence in your business's ability to capture value.
Note: This teardown is based on the 11-slide deck provided, which represents the company's positioning in 2013. According to the catalogue listing, the company was founded in 2013 and has since grown to manage over 50 companies across four funds.
Frequently asked questions
- What is AgFunder's primary business model according to the deck?
- AgFunder operates as a global capital markets platform for the agriculture sector. According to slides 8 and 9, their revenue is generated through a commission structure. They take a 4% cash commission and a 3% options stake in the deals facilitated through their platform. This aligns their incentives with both immediate liquidity and long-term portfolio growth.
- How does AgFunder justify the market opportunity for agtech?
- On slide 4, the company cites three key data points: agriculture represents 8.4% of global GDP, it is the #2 fastest-growing sector since 1999, and there is $200B in annual investment in growth and innovation. By framing agriculture as a massive, high-growth macroeconomic pillar, they move the conversation beyond 'farming' into 'global capital markets.'
- Who are the target users of the AgFunder platform?
- Slide 3 identifies four specific categories of registered investors: Venture Capital, Family Offices, Private Equity, and Sovereign Wealth Funds. Slide 11 further clarifies that the platform connects these sources of 'Global Capital' (ranging from $1M to $500M) with investment opportunities, effectively acting as a digital intermediary for investment banks.
- What evidence of early success does the deck provide?
- The deck uses slides 6 and 7 as mini-case studies. Slide 6 shows a satellite heat map for a company called 'aWhere' which raised $4M. Slide 7 features 'Edyn,' a smart gardening sensor, noting it raised $2M and was closing on an additional $3M. These slides prove the platform's ability to close diverse types of agtech deals.
- What is missing from this pitch deck?
- The deck is notably missing a specific 'Ask' slide detailing how much money they are currently raising and how those funds will be allocated. It also lacks a detailed competitor analysis or a deep dive into the technology stack. The 'Problem' slide is also absent, as the deck assumes the investor already understands the inefficiency of traditional ag-financing.