Sales Team Capacity Slide Examples: Proving Your Sales Reps
How to show investors that hiring more salespeople will produce more revenue: quota attainment, sales per rep, capacity against target and payback.
Sales Capacity Slide: Show What One Salesperson Produces Before Asking to Hire Twenty
When a round is meant to pay for a sales team, investors ask a simple question: if we fund ten more salespeople, how much more will you sell? A hiring plan says who you will hire. A sales capacity slide says what each of those people is likely to produce, based on what the existing ones already have. This guide uses six real slides, from a software company whose first five sales hires beat their targets to a plan that lists roles with no figures at all.
TL;DR
Show what your current salespeople produce, measured against a target, and then show how many more you need to hit the plan. Replicated says its first 5 account executives reached 135% of their net quota over the last 5 quarters. Mixpanel started 2014 with 5 quota-carrying reps, planned to end with 33, and puts sales payback at about 6 months. Tattle works out one salesperson's output: 15 restaurant locations a month at $100 a month each. Pendo compares sales capacity with bookings each quarter but shows no numbers on the axis, SportID gives only headcount, and Lago lists roles without a single figure.
Six sales capacity slides, read in full
Each example quotes the slide, separates the company's claims from what the slide shows, and notes what to copy and what to avoid.
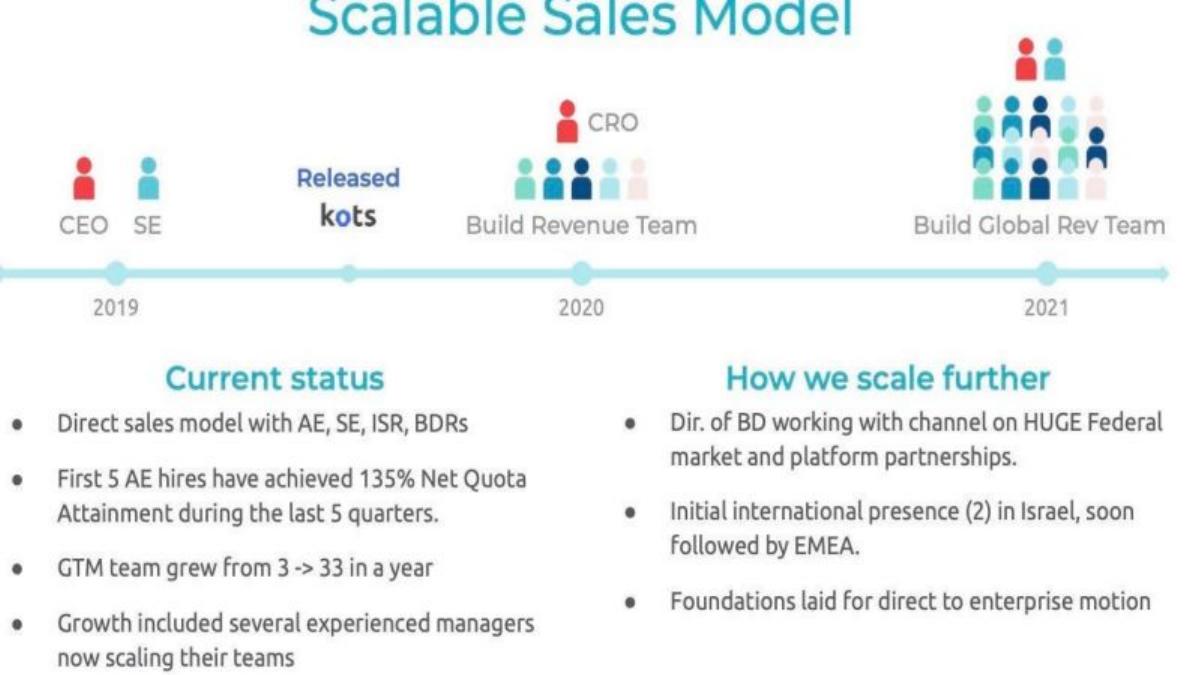
Replicated go to market slide — slide 19
Software distribution platform. Slide titled "Scalable Sales Model".
Replicated deck, slide 19. Exact stored slide matched to this analysis.
Our analysis: Hired salespeople, not founders, beat their target over five quarters.
Evidence and limitation: Company-reported attainment; quota size not given.
What a founder can adapt: Add quota per rep, ramp time and how many of the five hit target.
Supporting analysis
What the deck claims: "Direct sales model with AE, SE, ISR, BDRs"; "First 5 AE hires have achieved 135% Net Quota Attainment during the last 5 quarters"; "GTM team grew from 3 -> 33 in a year".
Presentation choice: Direct evidence that selling is repeatable by a team.
When it does not fit: An attainment percentage with no quota behind it.
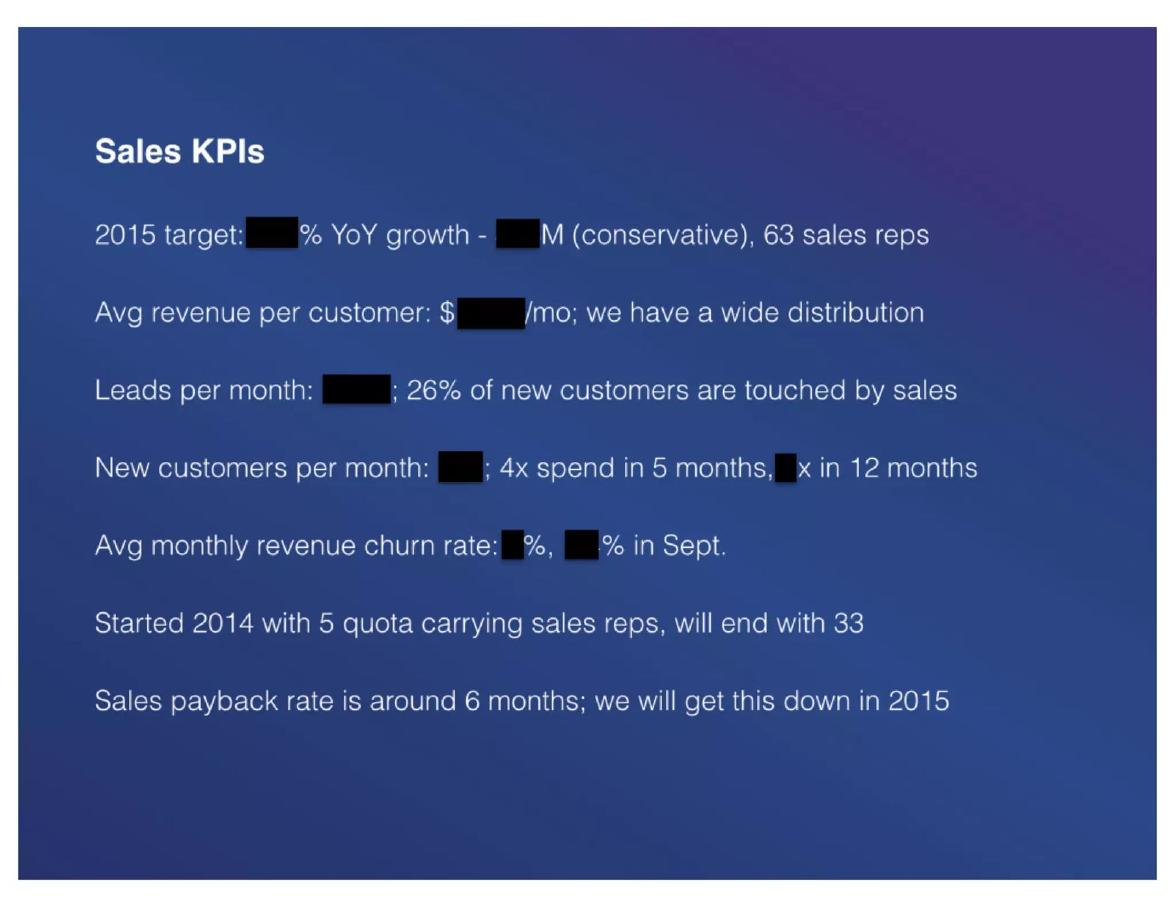
Mixpanel deck, slide 8. Exact stored slide matched to this analysis.
Our analysis: Quota-carrying reps, sales share of customers and payback in one place.
Evidence and limitation: Readable lines only; growth, revenue per customer, leads and churn redacted.
What a founder can adapt: Keep the structure and show every figure, or use ranges.
Supporting analysis
What the deck claims: "Started 2014 with 5 quota carrying sales reps, will end with 33"; 2015 target "63 sales reps"; "26% of new customers are touched by sales"; "Sales payback rate is around 6 months".
Presentation choice: Ties team growth to cost recovery and to a self-serve base.
When it does not fit: Sharing a capacity slide with its numbers removed.
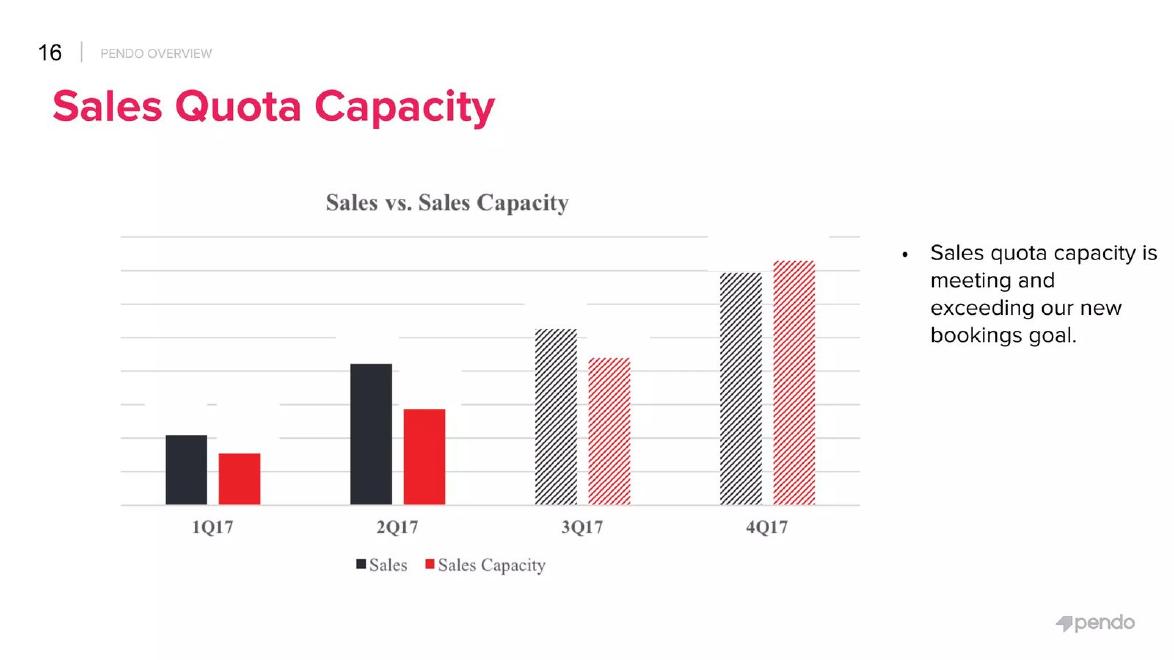
Pendo deck, slide 15. Exact stored slide matched to this analysis.
Our analysis: Right comparison, unreadable result.
Evidence and limitation: No axis values; sales bar taller than capacity in three quarters.
What a founder can adapt: Label values and explain which bar is which.
Supporting analysis
What the deck claims: Chart "Sales vs. Sales Capacity" for 1Q17 to 4Q17, last two quarters hatched; "Sales quota capacity is meeting and exceeding our new bookings goal."
Presentation choice: Capacity against the bookings goal tests whether hiring matches the plan.
When it does not fit: A chart that seems to contradict its caption.
Billing software. Slide titled "Scale from founder-led to a high-performing system".
Lago deck, slide 19. Exact stored slide matched to this analysis.
Our analysis: Names the founder-led problem but gives no evidence of a handover.
Evidence and limitation: Roles only; no counts, quotas or results.
What a founder can adapt: Add founder-led results and what each new hire will be measured on.
Supporting analysis
What the deck claims: Sales, "Hiring in Europe and NYC": SDR/BDR, account executives, solution engineers, business operations; marketing: content, SEO, product marketing, community.
Presentation choice: The headline asks the right question.
When it does not fit: A list of job openings presented as a sales system.
Whether each slide shows rep results, per-rep output or cost, and capacity against the plan.
Example
Rep results vs target
Per-rep output or cost
Capacity vs plan
Replicated
135% over 5 quarters
No
No
Mixpanel
No
Payback about 6 months
Rep counts only
Tattle
No (plan)
15 locations a month, costs
No
Pendo
No
No
Chart without values
SportID
No
No
Headcount only
Lago
No
No
No
Key Takeaways
Start with what one salesperson actually produces.
Measure reps against a stated quota or target.
Say how long a new rep takes to become productive.
Show capacity against the plan with real numbers.
Headcount alone is not evidence of a sales engine.
Build your sales capacity slide
Answer these before you add any hiring numbers.
Today. How many quota-carrying reps do you have, what is the quota and what did they reach, over which period?
Ramp. How many months does a new rep take to reach full quota?
Attrition. How much rep-time do you assume you lose to departures in the period, and is it subtracted only once?
Cost. What does one rep cost fully loaded, and how long until their sales pay that back?
Plan. How many productive reps does the bookings target need each quarter, and does the hiring plan supply them?
Copyable framework: [Number] reps carry a [quota] annual quota; over [period] they reached [attainment]. New reps reach full quota in [months]. We assume [attrition]. Each costs [cost] and pays back in [months]. Planning at [rate] per productive rep-year, [rep-years] gives [capacity] against a [target] target; this round funds [hires].
Illustrative example 1 — written by us
Before: We will scale from founder-led sales by hiring a world-class sales team in Europe and the US.
After: 3 account executives carry a $480k annual new-bookings quota; over the last 4 quarters they booked $538k each on average (112% attainment), and all three passed 95%. Assumptions: 10 hires start in January and ramp evenly to full quota over 5 months (about 9.5 productive months each); one rep leaves mid-year and is not replaced; we plan at 100% of quota, not the observed 112%. Capacity: 3 + 10 x 9.5/12 - 0.5 = 10.4167 productive rep-years (unrounded) x $480k = about $5.0m, in line with next year's $5.0m new-bookings target. Each rep costs $160k fully loaded and pays back in 7 months.
What improved: Our illustrative rewrite; all figures are invented for the example. It separates observed sales, quota and attainment, keeps one measure and period, applies ramp and attrition once each, labels the assumptions and reconciles capacity with the target.
The question this guide answers
Many startups raise money once founder-led selling works and they want to hand it to a team. Investors know this step often fails: the founder sells because of deep product knowledge and personal credibility, and hired salespeople do not repeat the results. So the question behind every sales hiring plan is whether selling is repeatable by people who are not the founder.
Other guides in the library cover neighbouring questions. The hiring plan guide covers which roles a round pays for and when. The sales cycle guide covers how long deals take to close. The payback guide covers how long it takes to earn back what it costs to win a customer. This guide covers the link between them: evidence that a salesperson, once hired and trained, produces a predictable amount of revenue, and how many salespeople the plan therefore needs.
How we chose and read the examples
We searched the extracted text of the slide library for slides that mention quotas, sales reps, account executives or sales capacity alongside a figure, and read each candidate at full size. We kept six slides that together show the range: measured quota attainment, a team growth figure with payback, a calculation of one rep's output, a capacity chart, a headcount timeline and a list of roles. We stopped once each lesson had a clear example.
We quote what is visible on each slide. We have not checked any company's quota, revenue or headcount figures against other sources, and we make no claim that any slide affected a fundraising result. Where we work out a figure, we show the arithmetic and say it is ours.
Measured attainment: the strongest evidence
Replicated's slide is titled "Scalable Sales Model". A timeline runs from 2019 (a CEO and one solutions engineer), through 2020 ("Build Revenue Team", with a chief revenue officer), to 2021 ("Build Global Rev Team"). Under "Current status" it gives four points: a "Direct sales model with AE, SE, ISR, BDRs"; "First 5 AE hires have achieved 135% Net Quota Attainment during the last 5 quarters"; "GTM team grew from 3 -> 33 in a year"; and growth "included several experienced managers now scaling their teams".
The second point is the one investors look for. It names a group (the first five account executives, not the founders), a measure (net quota attainment, meaning results against target after losses are counted), a result (135%) and a period (five quarters). Five people over five quarters is a small sample, but it is real evidence that people other than the founders can sell the product above target.
The slide leaves out what the quota is. 135% of a small quota proves less than 135% of a large one, and investors will ask for the quota per rep, the time new reps took to reach it, and whether all five hit it or a few high performers carried the average. A one-line note with the annual quota per account executive would make the figure far more useful.
Team growth with a payback figure
Mixpanel's "Sales KPIs" slide comes from a deck shared with most figures blacked out, but several lines remain readable. "Started 2014 with 5 quota carrying sales reps, will end with 33". The 2015 target lists "63 sales reps". "26% of new customers are touched by sales". "Sales payback rate is around 6 months; we will get this down in 2015". Customer spend is described as "4x spend in 5 months".
The readable lines show a useful structure. Saying how many reps carry a quota separates sellers from support staff. Saying what share of new customers sales touches tells investors that most customers arrive without a salesperson, so reps are adding to a self-serve base rather than generating every sale. And a payback period ties the team's cost to what it brings in. From the slide's own figures, the plan grows quota-carrying reps more than sixfold in 2014 (5 to 33) and nearly doubles them again in 2015 (to 63).
What a reader of the shared version cannot assess is everything that was blacked out: the growth target, revenue per customer, leads per month and churn. In the original meeting those figures were presumably visible. If you share a deck after the meeting with numbers removed, the capacity argument collapses, because it depends on the arithmetic.
Work out one rep's output, and check the sums
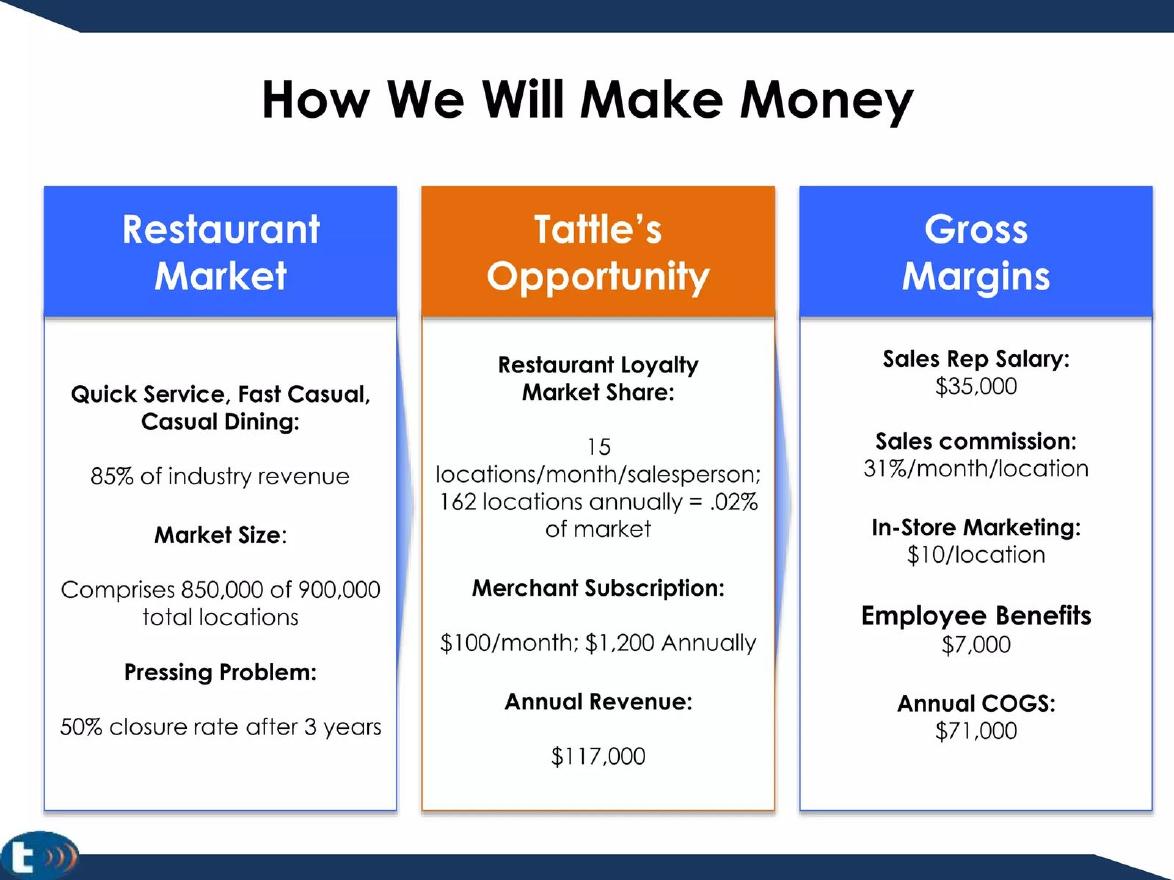
Tattle, a restaurant feedback service, builds its revenue model around a single salesperson. Its slide "How We Will Make Money" gives "15 locations/month/salesperson; 162 locations annually = .02% of market", a merchant subscription of "$100/month; $1,200 Annually" and "Annual Revenue: $117,000". On the cost side it lists "Sales Rep Salary: $35,000", "Sales commission: 31%/month/location", "In-Store Marketing: $10/location", "Employee Benefits $7,000" and "Annual COGS: $71,000".
This is the right way to think about sales capacity: what one person signs, what that is worth, and what that person costs. The $117,000 revenue figure is consistent with a rep adding 15 locations every month, each paying $100 a month from the month it signs: 15 locations times 78 location-months (12 + 11 + ... + 1) times $100 equals $117,000. That is our reconstruction; the slide does not show it.
Two figures do not reconcile. Fifteen locations a month for twelve months is 180, not the 162 stated, and the slide does not say whether the difference is cancellations or a slower first month. And the $71,000 cost total cannot be rebuilt from the listed items: salary and benefits come to $42,000, and adding in-store marketing for 162 locations ($1,620) and a 31% commission on $117,000 ($36,270) gives about $79,900. A capacity slide is only as convincing as its arithmetic, so show the calculation or make sure every total can be rebuilt from the parts.
A capacity chart needs numbers on it
Pendo's slide is titled "Sales Quota Capacity" and shows a chart, "Sales vs. Sales Capacity", for each quarter of 2017. Solid bars for the first two quarters are results; hatched bars for the last two are forecasts. In every quarter the sales bar and the capacity bar sit side by side, and the text reads "Sales quota capacity is meeting and exceeding our new bookings goal."
Comparing the team's combined quota with the bookings goal is the right test: it tells investors whether the company has hired enough salespeople to hit its plan. The hatched forecast bars are also clearly marked, which is good practice.
But the chart has no values on its axis, so neither the bookings nor the capacity can be read. It also seems to contradict its own caption: in the first three quarters the sales bar is taller than the capacity bar, which could mean sales ran ahead of the team's quota, or that the labels are swapped; only in the fourth quarter is capacity higher. Without numbers or a legend that explains which is which, investors cannot tell whether the team is over-hired, under-hired or on target.
Headcount and roles are not capacity
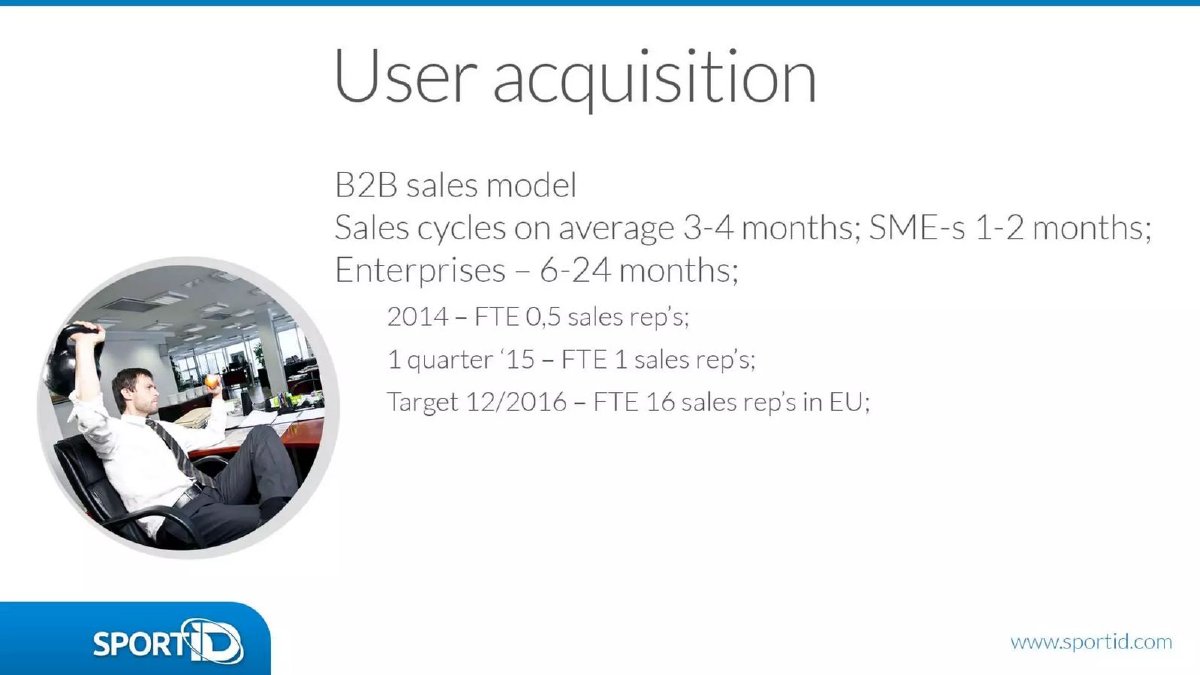
SportID's "User acquisition" slide states a "B2B sales model" with sales cycles averaging "3-4 months; SME-s 1-2 months; Enterprises – 6-24 months". It then gives headcount: "2014 – FTE 0,5 sales rep's", "1 quarter '15 – FTE 1 sales rep's" and "Target 12/2016 – FTE 16 sales rep's in EU". Splitting the sales cycle by customer size is useful. But the jump from one rep to sixteen comes with no figure for what one rep has sold, so investors cannot judge whether sixteen reps will produce sixteen times the revenue. With enterprise cycles of up to 24 months, new reps hired in 2016 might not close an enterprise deal until 2018.
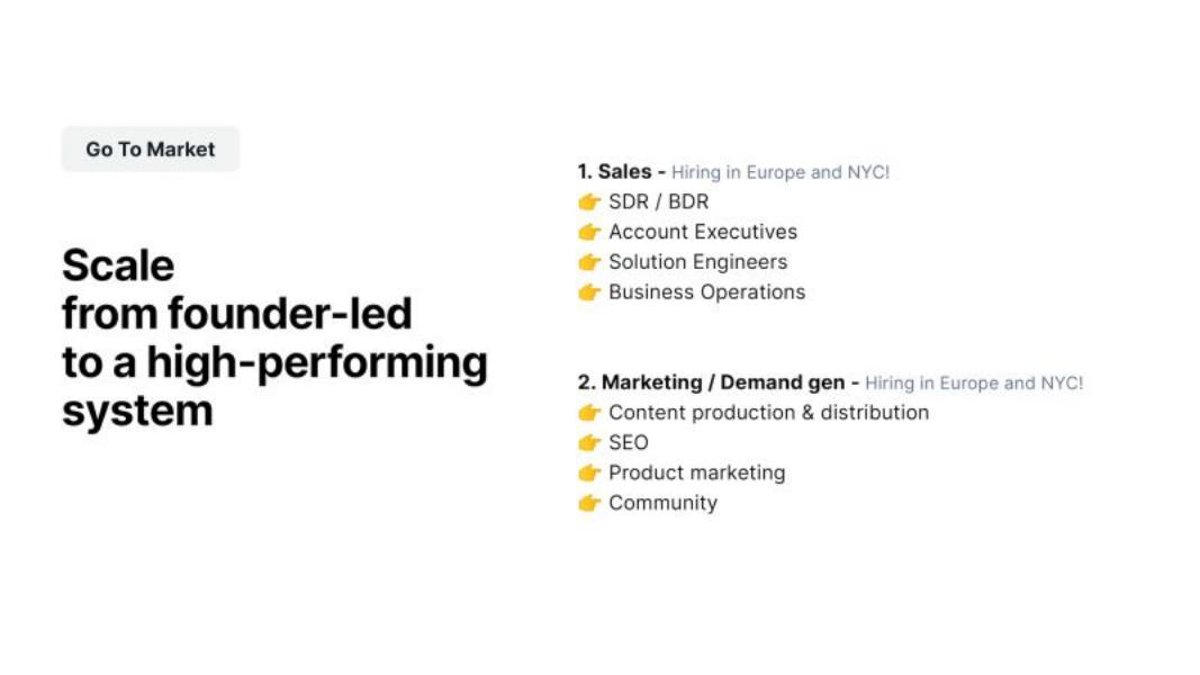
Lago's slide, "Scale from founder-led to a high-performing system", names the right problem in its headline. Under sales it lists the roles it is hiring in Europe and New York: SDR/BDR, account executives, solution engineers and business operations; under marketing, content, SEO, product marketing and community. It gives no number of hires, no quota, no result from the founder-led period and no target. It works as a list of job openings, not as evidence that selling can be handed over.
Comparing the six slides
Only Replicated reports how hired salespeople actually performed against a target. Mixpanel and Tattle supply the other half of the argument, the cost and payback of a rep or the output of one rep, though Mixpanel's shared version hides most numbers and Tattle's sums do not fully add up. Pendo uses the right comparison but shows it without values. SportID and Lago show only growth in headcount or roles.
Put together, a complete sales capacity slide would combine Replicated's measured attainment, Tattle's per-rep calculation, Mixpanel's payback period and Pendo's capacity-against-plan comparison, with the numbers visible.
How to build your own sales capacity slide
Start with the reps you already have, not the founders. For each, or for the group, give the quota, the attainment over a stated period and how many months it took a new rep to reach full productivity. If you only have founder-led sales so far, say that plainly and show what the founders sold per month, then explain what the first hire will be measured on.
Next, turn that into a capacity figure, keeping three numbers apart: observed productivity (what reps actually sold per period), quota (the target each rep carries) and attainment (observed sales divided by quota). Capacity is productive rep-time multiplied by one planning rate per rep, and that rate should be either quota at an assumed attainment or observed productivity, never both. Use one revenue measure (for example new annual bookings) and one period for every figure. Count ramp once, as the months each new hire spends below full output, and attrition once, as rep-time lost when someone leaves; do not also lower the per-rep rate for the same effect. Label each of these as an assumption. Put the result next to the bookings target for each period so investors can see whether the hiring plan matches the revenue plan. Add the cost side: fully loaded cost per rep and the payback period.
Finally, check that every total can be rebuilt from the figures on the slide. Investors will redo the arithmetic, and a total that does not reconcile does more damage than a modest one that does.
Common mistakes
Headcount as evidence. Show what each rep produces, not how many you will hire.
Attainment with no quota. State the quota the percentage refers to.
Ignoring ramp time. New reps do not sell at full quota on day one.
Counting an adjustment twice. Apply ramp and attrition once each, and plan on quota at an assumed attainment or on observed sales, not both.
Charts without values. Label the axis so capacity and target can be read.
Totals that do not add up. Make every total rebuildable from its parts.
Diagnostic checklist
Current reps' quota and attainment stated.
Ramp time given.
Observed sales, quota and attainment kept separate, in one measure and period.
Ramp and attrition assumptions labelled and applied once each.
Cost per rep and payback shown.
Capacity compared with the bookings target.
All arithmetic checks out.
Frequently asked questions
What is a sales capacity slide?
A slide that shows what each salesperson produces and how many productive salespeople the revenue plan needs.
What if only the founders have sold so far?
Say so, show what the founders sold per month, and explain what the first hires will be measured on and when you will know if it works.
Is quota attainment above 100% always good?
Only if the quota is meaningful. Give the quota size and the spread across reps; a few high performers can hide others who missed.
How we chose these examples
Corpus: published pitch deck teardowns on StartupFundraising.com. Founder-uploaded private decks are excluded.
Selection (2026-10-01): we searched extracted slide text for quotas, sales reps, account executives and sales capacity alongside a figure, read candidates at full size, and kept six slides that each show a distinct way of presenting sales capacity.
Review: all six stored slide images were read at full size on 2026-10-01 against company, deck and slide number, and our calculations were checked against the visible figures (editorial model review, with AI assistance in drafting). No person has yet completed an editorial review of this page. We did not verify any company's quota, revenue or headcount figures.