Developer Tools Market Slides: 6 Real Pitch Deck Examples
How developer tools startups size their market: count the teams or systems that would use the tool, narrow to the ones you can reach, and source every figure.
Developer Tools Market Slide: Count the Teams Who Would Pay
Developer tools are often sold to a narrow group, such as teams without an analytics division or websites without an API, inside a very large technology market. Investors read a devtools market slide for how the founder gets from the big number to the buyers they can actually reach. This guide compares six real market slides from decks tagged developer tools in our library, from an analytics company that narrows a sourced $26.9B figure to a $50M first-year target to a slide that compares the company to other cloud businesses without a number.
TL;DR
Start from a sourced total, narrow it to the teams you can sell to, and say how you narrowed it. TelemetryDeck goes from a Statista figure of "26.9B USD" for developer services to "500M USD" for apps without their own analytics team and "50M USD" in the first year. Apifier counts "250.000.000 active websites" and says "only 15.000 of them have an API". Tracer and Marpipe cite sources for large adjacent markets. Granulate gives one share ("80% of production workloads run on Linux") without a size, and Skyflow places itself among other cloud companies with no figures.
Developer tools market slides from real pitch decks
Each example shows the exact stored slide above its analysis and links to the full teardown. The clearest slides come first; weaker ones follow for contrast. Claims are as shown on the slides; comments are ours.
TelemetryDeck deck, slide 6. Exact stored slide matched to this analysis.
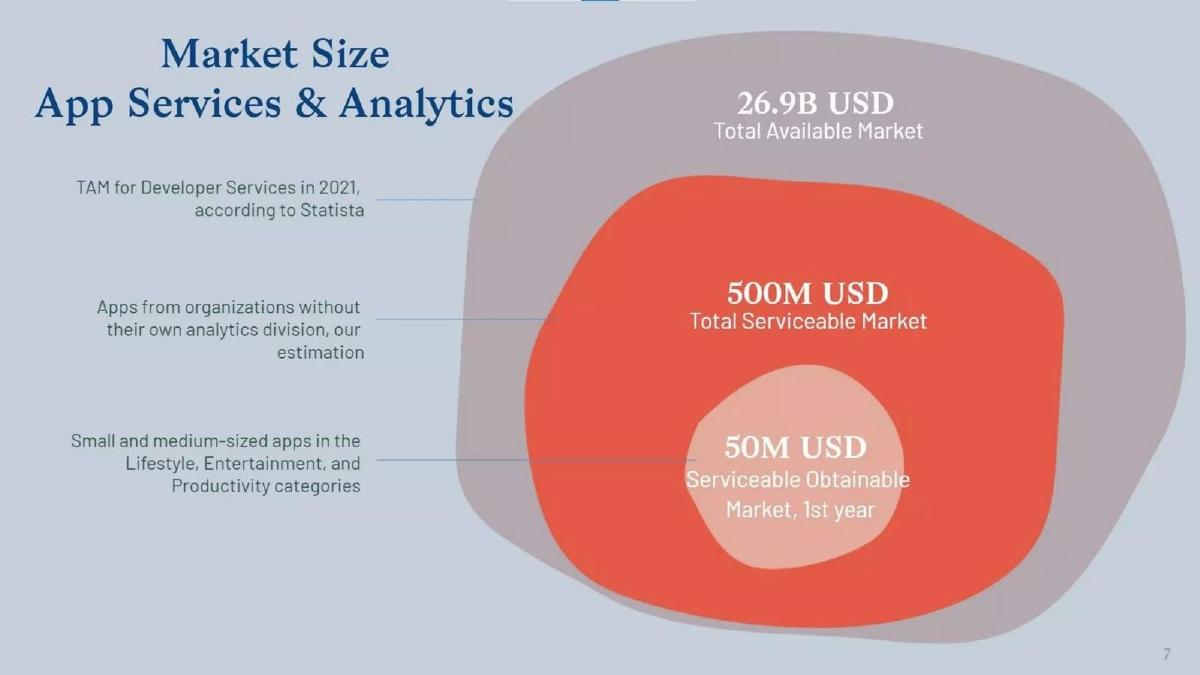
Our analysis: Each step says which apps are in it, so an investor can follow the narrowing. The two smaller figures are the company's own estimates, and the slide doesn't show how many apps they represent or the price per app.
Evidence and limitation: Three figures, each with a label saying who is included and one with a named source.
What a founder can adapt: Add the number of apps and the price that produce $500M and $50M.
Supporting analysis
What the deck claims: "26.9B USD Total Available Market": "TAM for Developer Services in 2021, according to Statista". "500M USD Total Serviceable Market": "Apps from organizations without their own analytics division, our estimation". "50M USD Serviceable Obtainable Market, 1st year": "Small and medium-sized apps in the Lifestyle, Entertainment, and Productivity categories".
Presentation choice: Labelling each circle with who is in it turns a standard diagram into an argument.
When it does not fit: Unlabelled circles; say who each one contains.
Web scraping platform (later Apify). Slide titled "Market".
Apifier deck, slide 4. Exact stored slide matched to this analysis.
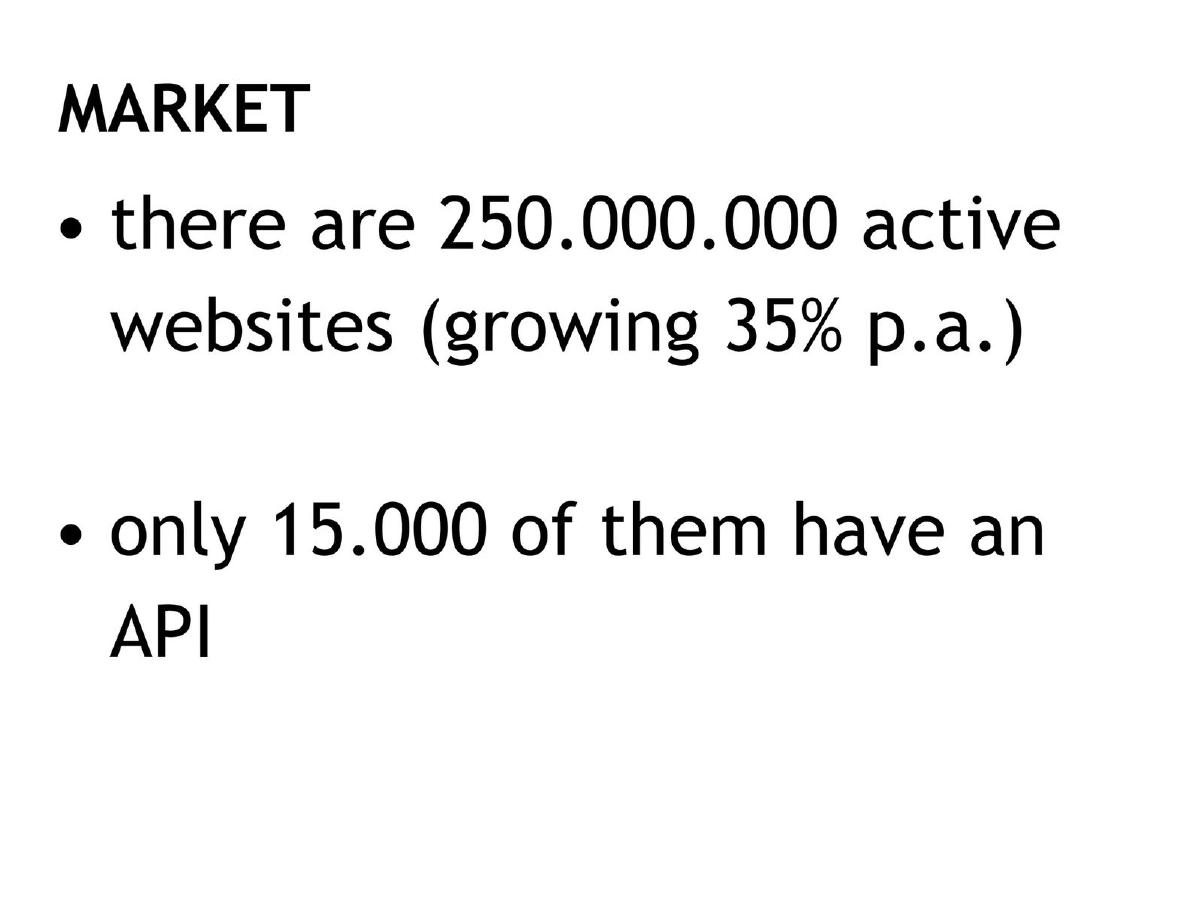
Our analysis: Two numbers show the gap the product fills: almost no websites offer their data through an API. The slide counts websites, not buyers, and gives no source or price.
Evidence and limitation: A count of websites, a growth rate and a count of the few with an API.
What a founder can adapt: Add who would pay to extract data and how many of them there are.
Supporting analysis
What the deck claims: "there are 250.000.000 active websites (growing 35% p.a.)"; "only 15.000 of them have an API".
Presentation choice: A count that shows the gap is often clearer than a dollar figure for a new category.
When it does not fit: Stopping at the count of websites; say who buys.
Data intelligence platform. Slide titled "The Market: The Tracer Opportunity".
Tracer deck, slide 2. Exact stored slide matched to this analysis.
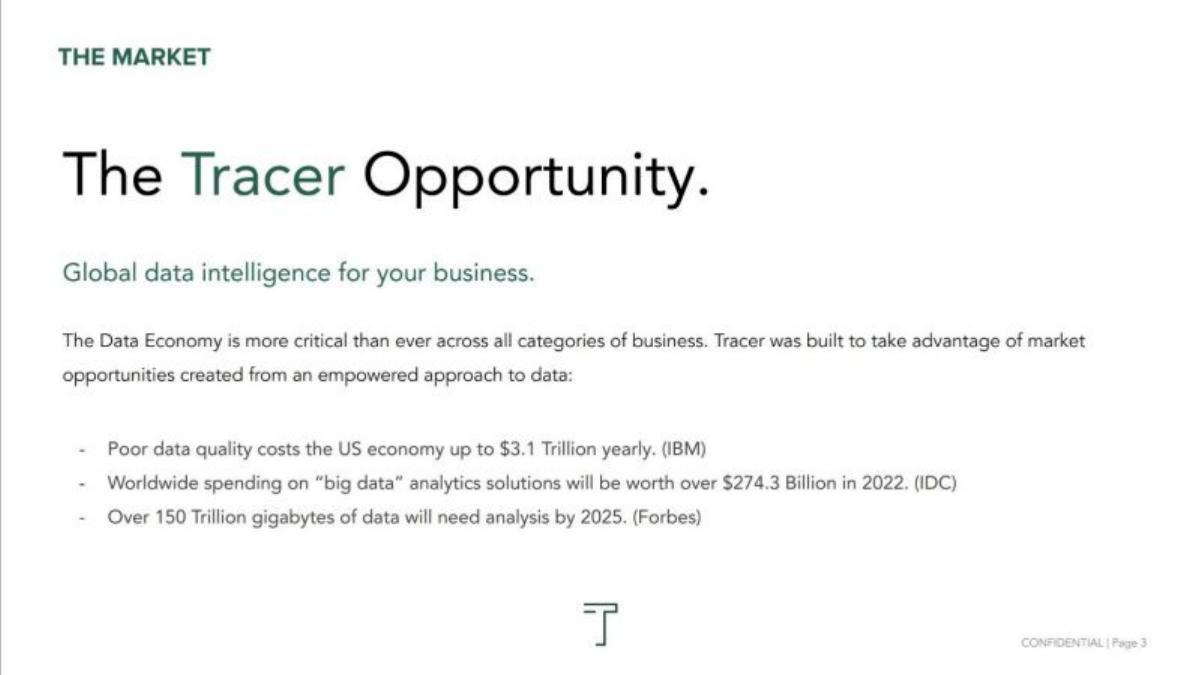
Our analysis: Every figure is sourced, which helps. But they describe the whole data economy; none says how much of it Tracer's buyers spend on a tool like this.
Evidence and limitation: Three figures, each with a named source.
What a founder can adapt: Add the part of the $274.3B spent by the teams Tracer sells to.
Supporting analysis
What the deck claims: "Global data intelligence for your business." "Poor data quality costs the US economy up to $3.1 Trillion yearly. (IBM)"; "Worldwide spending on 'big data' analytics solutions will be worth over $274.3 Billion in 2022. (IDC)"; "Over 150 Trillion gigabytes of data will need analysis by 2025. (Forbes)".
Presentation choice: Sources make figures credible; they still need to describe your market.
When it does not fit: Economy-wide costs in place of a market size.
Creative testing for ads. Slide titled "Market Sizing".
Marpipe deck, slide 4. Exact stored slide matched to this analysis.
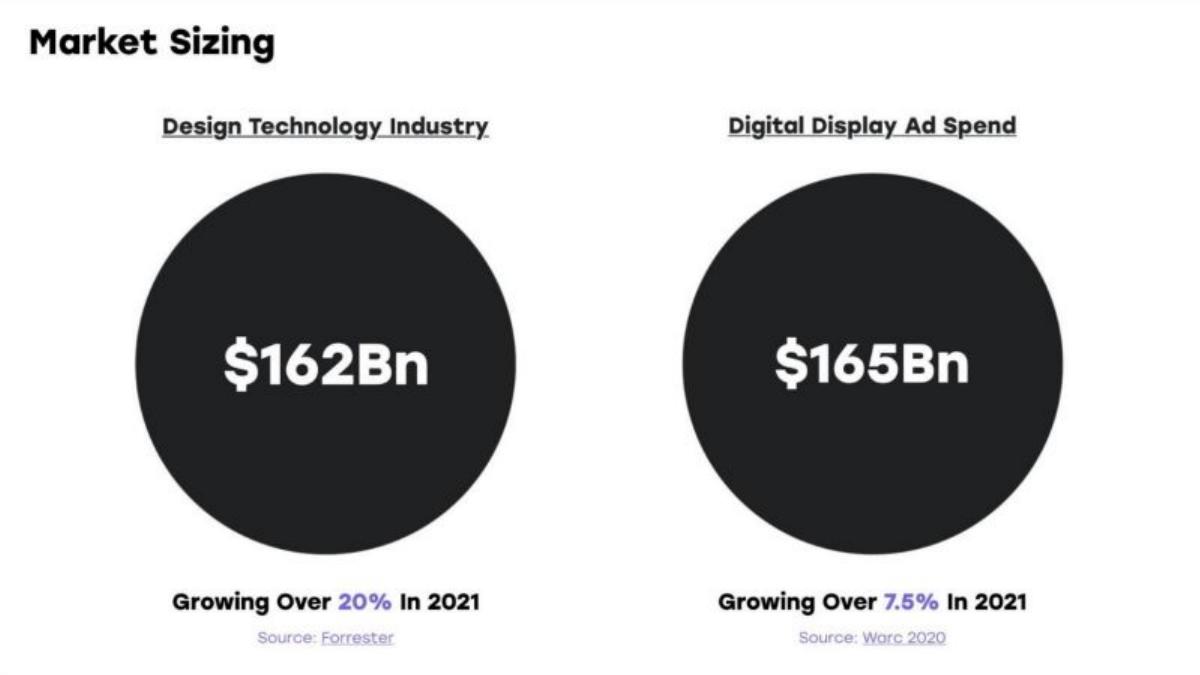
Our analysis: The sources and growth rates are clear. Both figures are for whole industries that Marpipe sits between, not the amount spent on creative testing, and the slide doesn't say how the two relate.
Evidence and limitation: Two sourced industry sizes with growth rates.
What a founder can adapt: Add how much advertisers spend testing creative and how many advertisers do it.
Supporting analysis
What the deck claims: "Design Technology Industry: $162Bn, Growing Over 20% In 2021" (Source: Forrester). "Digital Display Ad Spend: $165Bn, Growing Over 7.5% In 2021" (Source: Warc 2020).
Presentation choice: Two adjacent industries can frame a market, but the tool's own share still needs a number.
When it does not fit: Adding up adjacent industries as if they were your market.
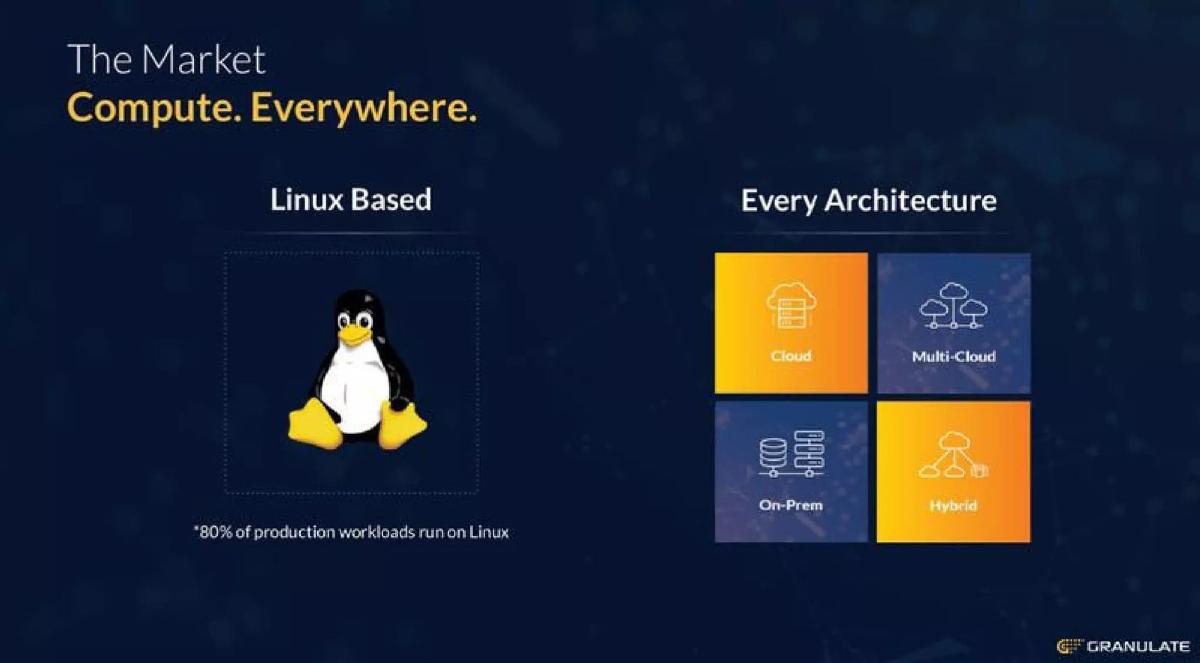
Infrastructure performance optimization. Slide titled "The Market: Compute. Everywhere."
Granulate deck, slide 4. Exact stored slide matched to this analysis.
Our analysis: The slide says the product works almost everywhere, which is a reach argument, not a market size. There is no count of servers or spend on compute.
Evidence and limitation: One share with no source and four deployment types.
What a founder can adapt: Add compute spend or server count and the share Granulate could optimize.
Supporting analysis
What the deck claims: "Linux Based" with "*80% of production workloads run on Linux"; "Every Architecture": "Cloud", "Multi-Cloud", "On-Prem", "Hybrid".
Presentation choice: Investors need a number to judge size; a share of workloads doesn't give one.
When it does not fit: Compatibility claims on the market slide.
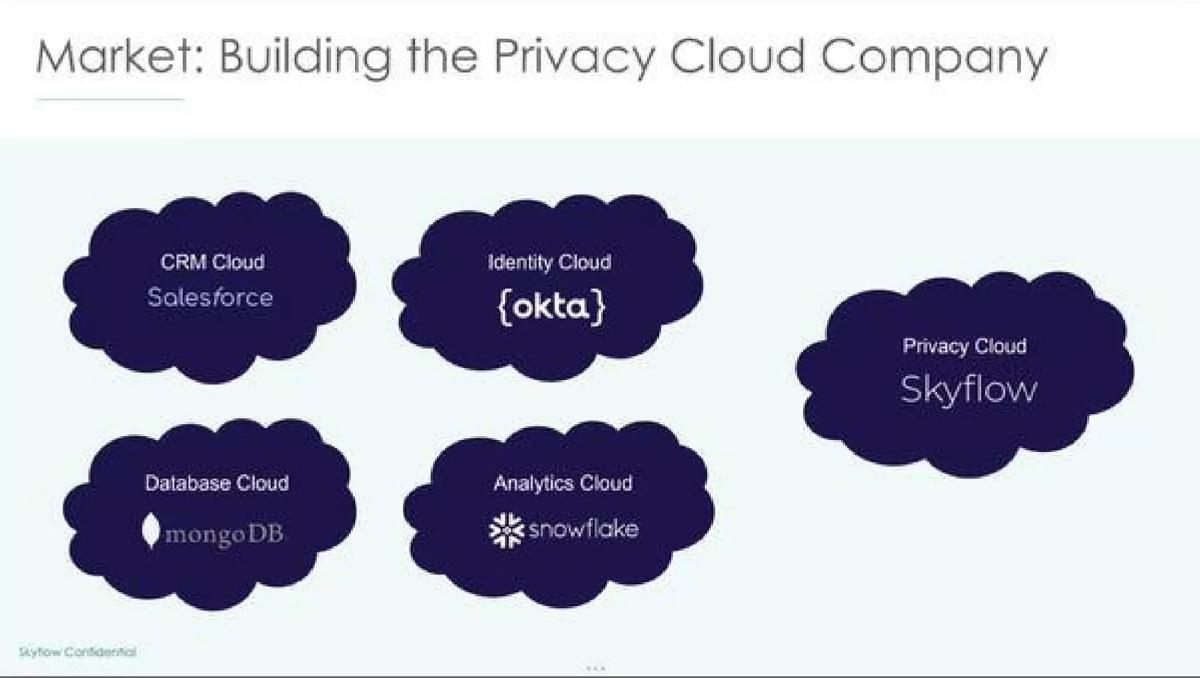
Data privacy vault. Slide titled "Market: Building the Privacy Cloud Company".
Skyflow deck, slide 6. Exact stored slide matched to this analysis.
Our analysis: The analogy suggests the category could be as large as those companies' categories, but the slide leaves the investor to supply the numbers.
Evidence and limitation: An analogy to four companies; no figures.
What a founder can adapt: Add privacy or data-security spend and the number of companies that store sensitive data.
Supporting analysis
What the deck claims: Clouds labelled "CRM Cloud: Salesforce", "Identity Cloud: okta", "Database Cloud: mongoDB", "Analytics Cloud: snowflake", and "Privacy Cloud: Skyflow".
Presentation choice: An analogy is a claim about size; it needs the size.
When it does not fit: Logos in place of a market figure.
Whether an investor can see who buys, how many there are and how the figure was narrowed.
Example
Business
Figure
Source
Narrowed to buyers
TelemetryDeck
App analytics
$26.9B → $500M → $50M
Statista (TAM); own estimate
Yes, labelled
Apifier
Web scraping
250M websites; 15k with API
Not stated
Websites, not buyers
Tracer
Data intelligence
$3.1T; $274.3B
IBM, IDC, Forbes
No
Marpipe
Creative testing
$162Bn; $165Bn
Forrester, Warc
No (adjacent industries)
Granulate
Compute optimization
80% of workloads on Linux
Not stated
No
Skyflow
Data privacy
None
Not applicable
No
Key Takeaways
Start from a sourced total for the developer segment.
Narrow to the teams or systems you can reach, and say how.
Count the buyers, not just the dollars.
Size your own market, not an adjacent industry.
An analogy to other companies needs a number beside it.
Build your developer tools market slide
Go from a sourced total to the teams you can sell to, with a count and a price.
Total. What is the sourced size of the developer segment you serve?
Buyers. Which teams or companies would buy, and how many are there?
Price. What would each pay per year?
Reach. Which of them can you reach first, and why?
Source. Where does each figure come from?
Copyable framework: Headline: [number] [teams] pay [price] a year for [job]: [serviceable market]. We start with [first group], worth [first-year market]. Total segment [figure] ([source]).
After: [Number] companies store sensitive customer data; at [price] a year that's [market] ([source]).
What improved: Our illustrative rewrite; the bracketed details are placeholders, not Skyflow's facts. It adds the number the analogy implies.
What this guide adds
The general market slide guide covers any company, and our TAM-SAM-SOM guide covers the three-circle format. Developer tools add a specific trap: quoting the size of the whole software, data or cloud market when the tool serves one kind of team. Investors look for a count of those teams.
Our library's developer tools tag covers app analytics, web data extraction, data intelligence, creative testing, infrastructure optimization and data privacy. We note each company's business in the examples.
How we read each slide
We quote the text on the stored slide images. We have not checked any market figure or source cited on a slide.
Common mistakes
Whole-industry figures. Size the part your tool serves.
No buyer count. Say how many teams would pay.
Unexplained narrowing. Label who is in each figure.
Compatibility as market. Where the tool runs isn't how big the market is.
Analogy without numbers. Give the size the comparison implies.
Diagnostic checklist
A sourced total for the segment.
A count of buyers.
A price per buyer.
How each figure was narrowed.
Sources.
Frequently asked questions
What should a developer tools market slide show?
A sourced total narrowed to the teams you can sell to. TelemetryDeck goes from $26.9B for developer services to $500M for apps without their own analytics team.
Can I use the size of the whole data or cloud market?
As context only. Tracer and Marpipe cite sourced industry figures but don't say how much their buyers spend on their kind of tool.
Is comparing my company to other cloud companies enough?
No. Skyflow's slide places it next to Salesforce and Snowflake but gives no market figure.
How we chose these examples
Corpus: published pitch deck teardowns on StartupFundraising.com. Founder-uploaded private decks are excluded.
Selection (2026-09-27): we searched extracted slide text in decks tagged developer tools for slides that begin with "market" or "opportunity". Eight slides matched; we reviewed those with stored images and not used elsewhere.
Kept six. Left out: Plumbr p3 (already used in the SaaS market slide guide) and Naraway p5 (a startup services platform whose market figure is total startup investment, not a developer market). Only six suitable slides remained, so the guide has six. Apifier's, Granulate's, Tracer's and Skyflow's decks appear in other guides with different slides. No uploads were requested.
Review: stored slide text and images were checked on 2026-09-27 and matched to company, deck and slide number (editorial model review). No person has yet completed an editorial review of this page.
Claims are as shown on the slides; we have not verified them. We make no claim that any slide caused a fundraising outcome.