Fashion Market Size Slides: 6 Real Pitch Deck Examples
How fashion and apparel startups size their market in a pitch deck: headline industry totals, nested circles, growth charts and niche figures.
Fashion Market Size Slide: Show the Slice You Can Actually Win
Fashion is one of the largest consumer markets in the world, which is exactly why a fashion market slide is easy to get wrong. Any founder can find a number in the hundreds of billions for clothing, footwear or online fashion, and almost every deck does. Investors already know clothing is big. What they want to see is how big the part of the market this company can reach really is, where the figure comes from, and why it is growing. This guide compares six real market slides from five fashion, apparel and fashion-technology decks. They range from a single industry growth chart to nested circles and a slide that drills from the whole US clothing market down to secondhand clothes sold online.
TL;DR
Start from the shoppers or businesses you can actually reach, give each number a source and a year, and show how the total narrows down to your slice. Poshmark is the strongest example here: one slide narrows from the $200B US clothing market to $27B online and $2B of clothing sold on eBay, with growth rates, and a second slide adds facts about secondhand sales and 80,000 independent boutiques. Moteefe pairs nested circles (£35bn, £25bn, £15bn) with the number of merchants in each of its three customer groups. Probe Fashion shows online fashion growing from $418B to $713B and names Shopify as the source, but never says what share of that a styling app could win. Emperia leads with an $800bn metaverse figure that is not a fashion market at all. Lazy Creatures gives a useful $2.5B loungewear number, but its charts still carry the word "Sample" across them.
Fashion market slides from real pitch decks
Each example shows the exact stored slide above its analysis and links to the full teardown. Slides that narrow the market to the company's own customers come first; weaker ones follow for contrast. Figures are as shown on the slides; comments are ours.
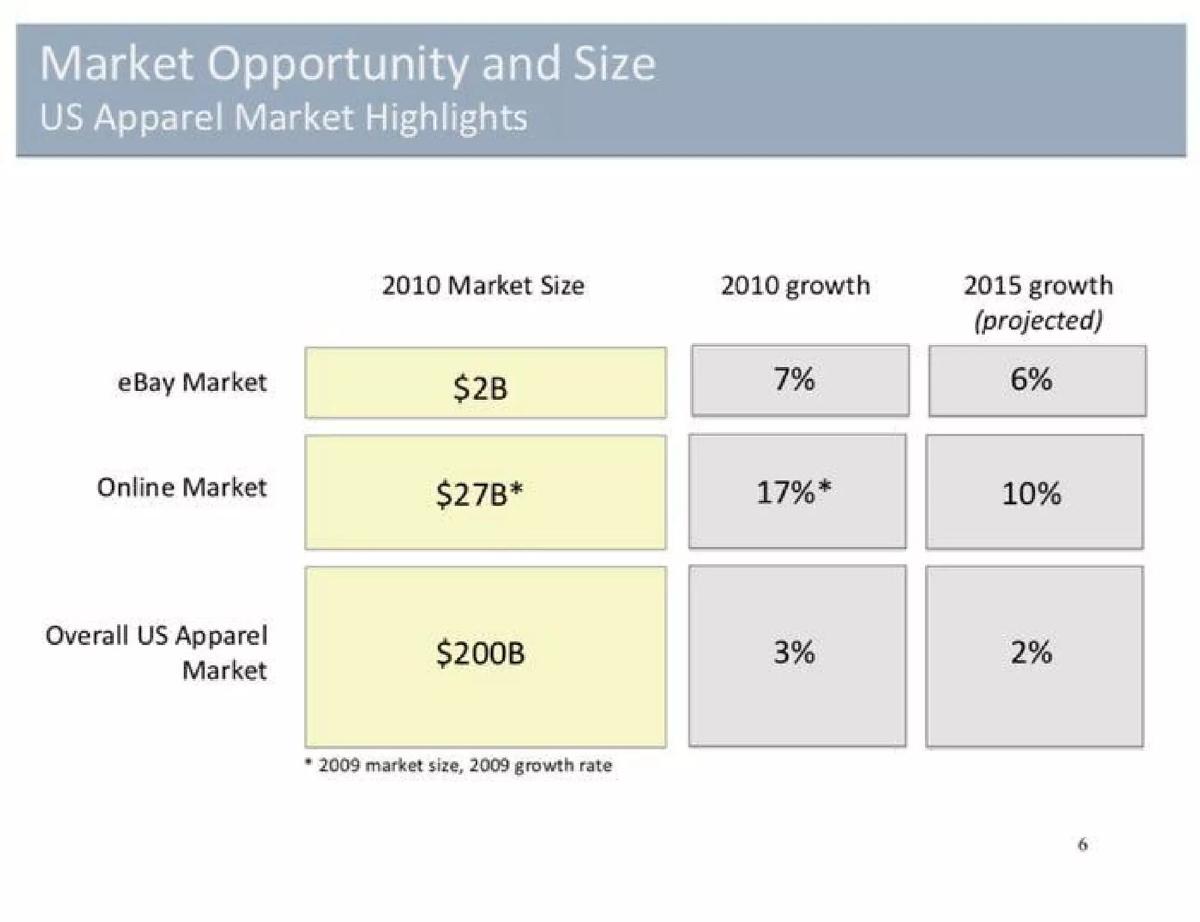
Poshmark market slide — slide 6
Early deck from the secondhand fashion marketplace. Slide titled "Market Opportunity and Size: US Apparel Market Highlights", a three-row table.
Poshmark deck, slide 6. Exact stored slide matched to this analysis.
Our analysis: It narrows from all US clothing to online clothing to clothing sold on one marketplace, and shows that the online part grows far faster than the whole.
Evidence and limitation: Claimed; no source named. The footnote is honest about the online figure being a year older than the others. Poshmark later listed on the stock market in 2021 and was bought by Naver in 2023, according to Wikipedia, checked on 2026-10-01.
What a founder can adapt: Keep the three-step table, add the source and year under each row, and add a fourth row for the part you expect to win, such as secondhand women's clothing sold on phones.
Supporting analysis
What the deck claims: Columns: "2010 Market Size", "2010 growth", "2015 growth (projected)". eBay market: $2B, 7%, 6%. Online market: $27B, 17%, 10%. Overall US apparel market: $200B, 3%, 2%. Footnote: "2009 market size, 2009 growth rate" for the online row.
Presentation choice: The step-down tells investors exactly which part of a huge market Poshmark is attacking, and the growth columns explain why the timing is good.
When it does not fit: Mixing years in one table without a note; Poshmark flags it, but many decks do not.
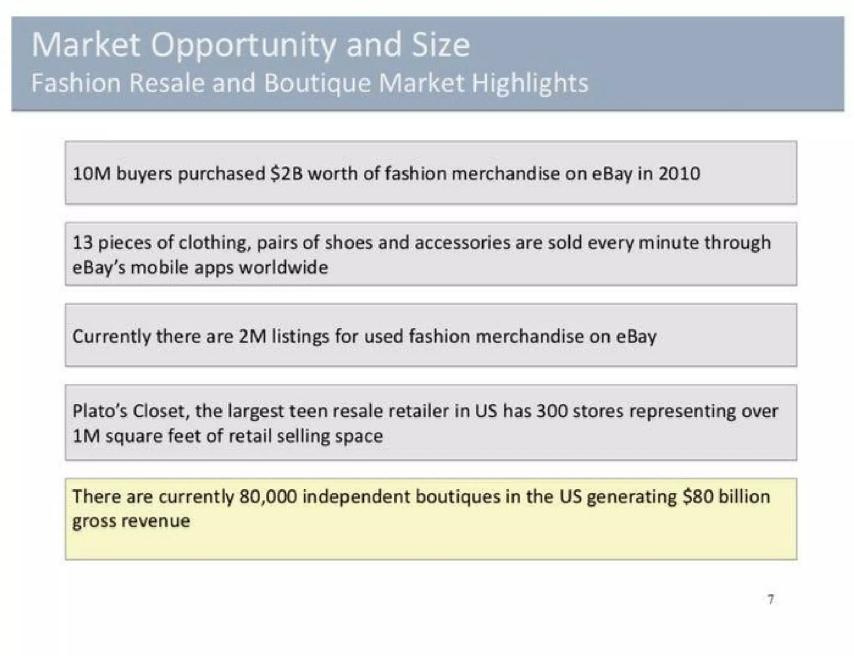
The next slide in the same deck: "Market Opportunity and Size: Fashion Resale and Boutique Market Highlights", five boxed facts.
Poshmark deck, slide 7. Exact stored slide matched to this analysis.
Our analysis: It backs the market size with counts of buyers, listings, stores and boutiques, and highlights the boutique figure as a second group Poshmark could serve.
Evidence and limitation: Claimed; no sources named. The facts are specific enough that a reader could look them up, which is better than a bare total.
What a founder can adapt: Use counts of the people or businesses you would serve, with a source for each, and say which group you will reach first.
Supporting analysis
What the deck claims: "10M buyers purchased $2B worth of fashion merchandise on eBay in 2010." "13 pieces of clothing, pairs of shoes and accessories are sold every minute through eBay's mobile apps worldwide." "Currently there are 2M listings for used fashion merchandise on eBay." "Plato's Closet, the largest teen resale retailer in US has 300 stores representing over 1M square feet of retail selling space." "There are currently 80,000 independent boutiques in the US generating $80 billion gross revenue" (highlighted).
Presentation choice: Counts of buyers and sellers make a market feel real in a way a single dollar figure cannot, and they show investors that people already buy secondhand fashion online and on phones.
When it does not fit: Five unrelated facts with no conclusion; add one line saying what they add up to for your company.
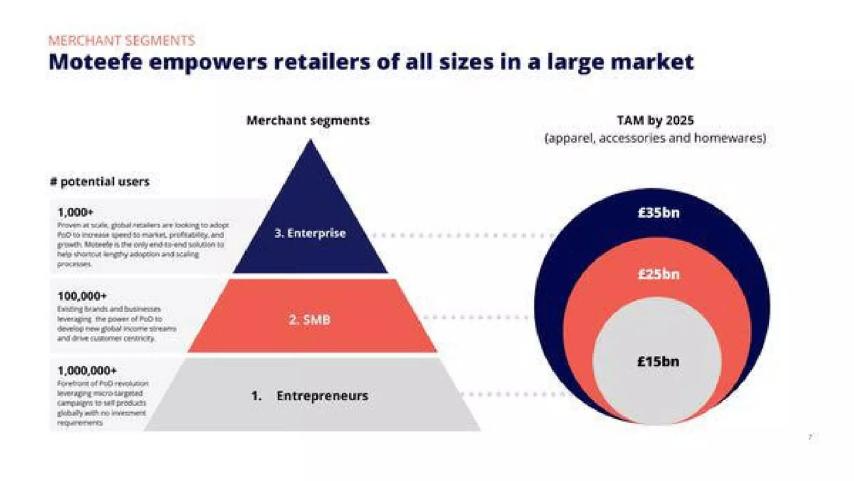
Print-on-demand platform for merchants. Slide labelled "Merchant Segments" and titled "Moteefe empowers retailers of all sizes in a large market".
Moteefe deck, slide 8. Exact stored slide matched to this analysis.
Our analysis: It sizes the market by the businesses that would buy from Moteefe, split into three groups, and pairs that with a money figure for the product categories it prints.
Evidence and limitation: Claimed; no sources for the merchant counts or the market figures. The circles are not labelled, so the reader cannot tell what the £25bn and £15bn rings include.
What a founder can adapt: Label each circle (for example, all print-on-demand spending, spending in your countries, spending you can reach in three years), and add an average spend per merchant so the counts and the money figure connect.
Supporting analysis
What the deck claims: A pyramid of merchant segments with "# potential users": "1. Entrepreneurs" 1,000,000+; "2. SMB" 100,000+; "3. Enterprise" 1,000+, described as global retailers "looking to adopt PoD to increase speed to market, profitability, and growth. Moteefe is the only end-to-end solution". Beside it, nested circles headed "TAM by 2025 (apparel, accessories and homewares)": £35bn, £25bn and £15bn.
Presentation choice: Counting potential customers by type is the right instinct for a company that sells to businesses; it shows who Moteefe serves and roughly how many of each there are.
When it does not fit: Unlabelled rings and "the only end-to-end solution" without evidence.
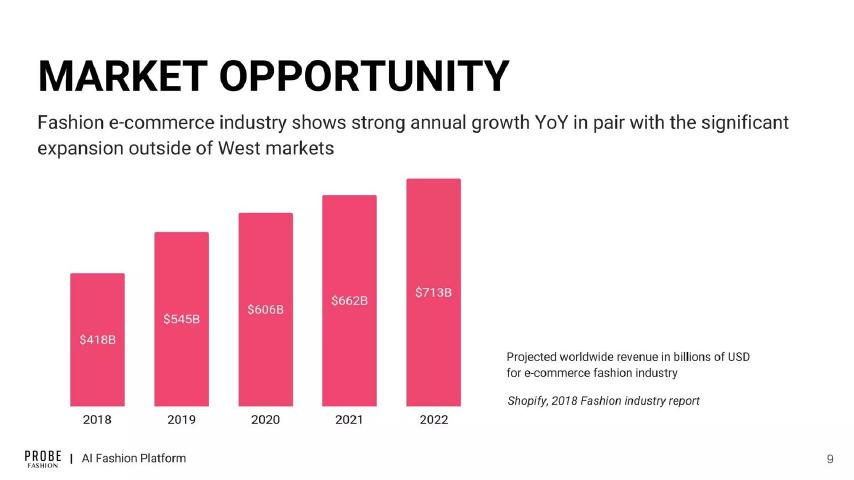
AI styling and shopping app. Slide titled "Market Opportunity" with a five-bar chart.
Probe Fashion deck, slide 9. Exact stored slide matched to this analysis.
Our analysis: A clean, sourced chart of worldwide online fashion sales, with a note that growth is coming from outside Western markets.
Evidence and limitation: Source named on the slide; we did not check the figures against the report. The 2019 to 2022 figures were forecasts when the report was written.
What a founder can adapt: Keep the sourced chart, then add one more step: how many shoppers in your launch countries use styling or shopping apps, and what share of their spending you expect to influence or earn.
Supporting analysis
What the deck claims: "Fashion e-commerce industry shows strong annual growth YoY in pair with the significant expansion outside of West markets." Bars for 2018 to 2022: $418B, $545B, $606B, $662B, $713B. Caption: "Projected worldwide revenue in billions of USD for e-commerce fashion industry." Source: "Shopify, 2018 Fashion industry report."
Presentation choice: Naming the source and year puts it ahead of most fashion market slides. It also shows that the market is growing, which supports the timing of the company.
When it does not fit: Stopping at a worldwide total that no single app could reach; it leaves the reader to guess the company's real market.
Women's loungewear brand. Slide titled "Market Data", a fact sheet beside three bar charts and a US map.
Lazy Creatures deck, slide 6. Exact stored slide matched to this analysis.
Our analysis: It moves from all women's clothing to the loungewear niche and names its customer and top states, which is the right structure for a small brand.
Evidence and limitation: Claimed; no sources named. The "Sample" marks suggest the charts were copied from a research report preview and not replaced with real data.
What a founder can adapt: Keep the fact sheet, replace the charts with one real chart of loungewear sales over time, and add the source and year under each figure.
Supporting analysis
What the deck claims: Industry: "Women's apparel - loungewear". Market size: "Global / US women's apparel $539B / $110B"; "China / US women's apparel commerce $51B (2012) / $52B (2014)"; "Women's loungewear market $2.5B". "Biggest domestic markets: California, Texas, Illinois, New York, Pennsylvania." "Customer segment: Tech-savvy millenials, 18 - 33." The charts and map have the word "Sample" printed across them.
Presentation choice: Shown as a warning: the structure is sound, and $2.5B for loungewear is the kind of niche figure investors want, but the placeholder charts undermine every number on the page.
When it does not fit: Sending a deck with charts marked "Sample", or with figures from different years and countries placed side by side without explanation.
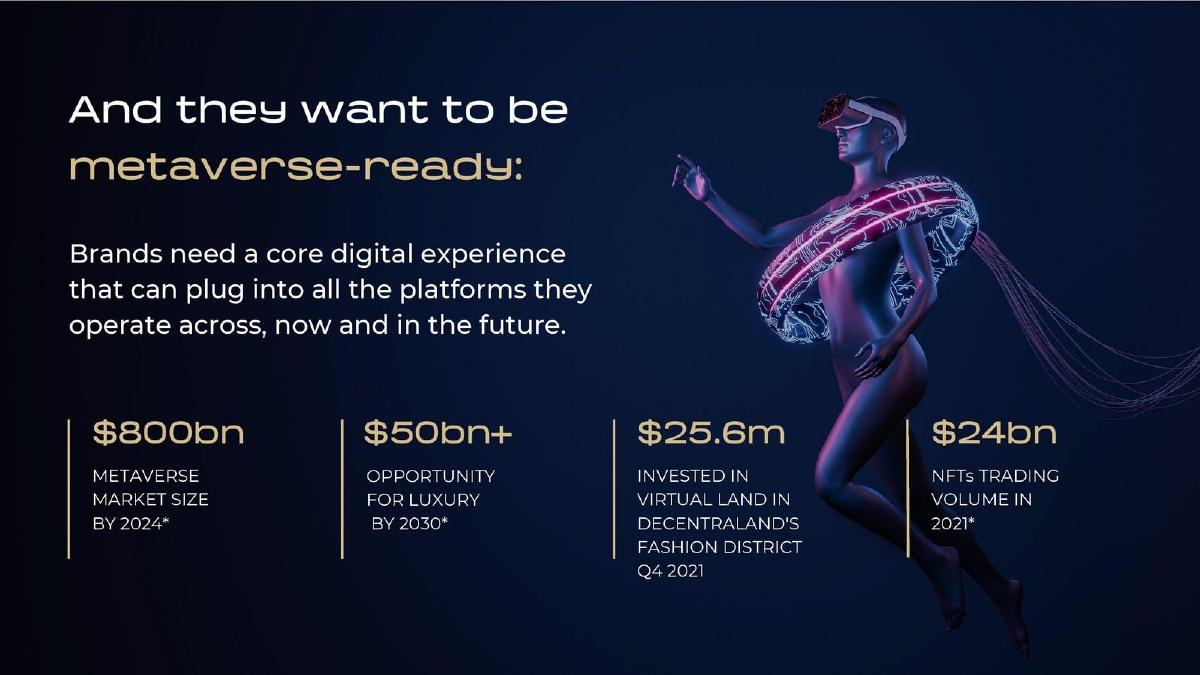
Virtual-store platform for fashion and luxury brands. Slide titled "And they want to be metaverse-ready", four figures over a stock image.
Emperia deck, slide 4. Exact stored slide matched to this analysis.
Our analysis: It sets the scene for Emperia's product with large trend figures, one of which ($50bn+ for luxury) is close to its real market.
Evidence and limitation: Claimed; the asterisks point to sources that do not appear on the slide. The figures describe the metaverse and NFTs in general, not spending by brands on virtual stores.
What a founder can adapt: Lead with the luxury figure and its source, then show how many luxury and fashion brands could buy a virtual store and what they spend on online stores today.
Supporting analysis
What the deck claims: "Brands need a core digital experience that can plug into all the platforms they operate across, now and in the future." "$800bn metaverse market size by 2024*"; "$50bn+ opportunity for luxury by 2030*"; "$25.6m invested in virtual land in Decentraland's fashion district Q4 2021*"; "$24bn NFTs trading volume in 2021*".
Presentation choice: Shown as the weakest: three of the four figures measure a broad trend rather than what fashion brands would pay Emperia, and none is sourced on the slide. The luxury figure is the only one an investor can connect to the business.
When it does not fit: Using trend totals, such as NFT trading volume, as if they were your market; investors will discount the whole slide.
Whether each slide narrows the market to the company's customers, names a source, and counts the customers it could serve.
Example
Narrows to own slice
Source on slide
Counts customers
Poshmark (US apparel)
Yes (three steps)
Partly (dates one figure)
No
Poshmark (resale)
Partly (boutiques highlighted)
No
Yes (buyers, listings, boutiques)
Moteefe
Partly (unlabelled rings)
No
Yes (merchants by group)
Probe Fashion
No (worldwide total)
Yes (Shopify 2018)
No
Lazy Creatures
Yes (loungewear niche)
No (charts marked Sample)
No
Emperia
No (trend figures)
No (asterisks only)
No
Key Takeaways
A huge industry total proves little; show the slice you can reach.
Every figure needs a source and a year on the slide.
Narrow in steps: whole market, channel, niche, your customers.
Counting customers (shops, merchants, shoppers) makes a total believable.
Remove placeholder charts and stock images before sending.
Build your fashion market slide
Start from the people or businesses who would pay you, then work outward to the total.
Buyer. Who pays you: shoppers, brands, shops or another business?
Path. Which splits lead to your slice: product, channel, country, customer type?
Count. How many of your buyers exist in the places you sell, and what does each spend a year?
Source. Where does each figure come from, and in what year was it published?
Growth. Which growth rate applies to your slice, not to fashion as a whole?
Copyable framework: The [category] market in [countries] is worth [amount] ([source, year]). [Number] of our buyers spend about [amount] a year on it, a [amount] market we can reach, growing [rate] a year ([source]).
Illustrative example 1 — written by us
Before: Women's apparel is a $539B market. Loungewear is $2.5B. Charts marked Sample.
After: US loungewear sales were about $2.5B last year (research firm, year), growing about 8% a year. About 12M women aged 18 to 33 buy loungewear online; at an average of $90 a year, that is a market of about $1B we can reach online.
What improved: Our illustrative rewrite; all figures are invented for the example. It drops the charts marked Sample, counts the shoppers and connects them to a money figure with a source.
What this guide adds
The general market slide guides cover any kind of business, including top-down and bottom-up sizing and the TAM, SAM and SOM framework. Fashion brings its own problems. The headline numbers are so big that they stop meaning anything: whole-industry figures for clothing run to hundreds of billions or more, and almost no startup will touch more than a tiny part of them. Fashion also splits in many directions at once: by product (women's clothing, loungewear, luxury), by channel (shops, online, secondhand) and by customer (shoppers, brands, retailers). A credible fashion market slide picks one path through those splits and follows it down to the company's customers.
The fashion problem, solution and competition guides cover other slides from similar decks. Here we look only at how each deck sizes its market: which figures it uses, where they come from, how it narrows them, and what a reader could check.
How we read each slide
We quote the text on the stored slide images, read at full size. We have not checked the market figures against the original research reports, and several are more than ten years old. "Claimed" means the company states a figure on the slide without a source. Where a source is named on the slide, we say so, but naming a source is not the same as the figure being right or still current.
These decks span roughly 2011 to 2022. Market figures date quickly, especially in online retail, where the pandemic changed growth rates sharply. Readers should judge each slide against the year it was made, and founders should never copy an old figure into a new deck.
Four ways fashion decks size a market
The headline total (Emperia, Probe Fashion) uses one or more very large figures for an industry or trend. It is quick to make and looks impressive, but it says nothing about how much of the market the company can win, and investors tend to skip past it.
The step-down (Poshmark) starts with a large total and narrows it, for example from all clothing to online clothing to one marketplace. Each step shows the reader how the company got from the big number to the one that matters, and each step can be checked.
The nested circles (Moteefe) show three figures inside each other, usually labelled TAM, SAM and SOM or simply as three amounts. They only help when the slide explains what each ring includes. Moteefe's labels are thin, but it adds a count of merchants in each of its customer groups, which does some of that work.
The niche fact sheet (Lazy Creatures) lists figures for a small category alongside the larger market around it. It can be the most honest format, because it shows the founder knows exactly which shoppers they serve, but only if the figures are sourced and the charts are real.
Who is the customer: shoppers or businesses?
Some fashion startups sell to shoppers, some sell to other businesses, and some do both. That choice changes which market number matters. Lazy Creatures sells loungewear to young women, so the size of the loungewear market and the number of shoppers it can reach are what count. Moteefe sells a print-on-demand service to brands and retailers, so the right measure is how many merchants could use it and how much they would spend, which is why its slide counts merchants. Emperia sells virtual stores to brands, yet its slide quotes what shoppers and investors spend in the metaverse, not what brands spend on virtual stores.
Before choosing a figure, write down who pays you. Then size the market in terms of that buyer: shoppers and their spending if you sell to shoppers, businesses and their budgets if you sell to businesses. Mixing the two is one of the most common errors on fashion-technology slides.
Questions investors ask about a fashion market slide
How much of this can you actually reach? A $700B online fashion figure means little to a styling app unless the slide shows how many shoppers in its launch countries use such apps and what they might pay.
Where does each number come from, and when? Probe Fashion names Shopify's 2018 report; Poshmark marks its online figure as a 2009 number. Most of the other figures on these slides have no source at all.
Is the growth real and relevant? Growth rates for clothing as a whole are often low; growth in a channel such as resale or online can be much higher. Say which growth applies to you.
Are the charts real? Lazy Creatures' charts are stamped "Sample". A reader who notices that will doubt every other figure on the page.
Mistakes fashion market slides make most often
The most common gap across these six slides is the missing link between the big number and the company. Only Poshmark narrows its market step by step, and only Moteefe counts potential customers. The others leave the reader with a large total and no idea how much of it the company expects to win.
The second gap is sourcing. Only Probe Fashion names a source on the slide, and Poshmark at least dates one figure. A single footnote with the publisher and year under each figure would make most of these slides much easier to trust, without changing their design.
The third gap is relevance. Emperia's $800bn metaverse figure and $24bn NFT trading volume describe a trend, not the spending of fashion brands on virtual stores. A smaller number that matches what the company sells is more persuasive than a bigger one that does not.
Common mistakes
Stopping at the industry total. Probe Fashion and Emperia never show the slice they could win.
Trend figures as a market. Metaverse size and NFT volume are not what brands pay Emperia.
No sources. Only one of the six slides names a source on the slide itself.
Placeholder charts. Lazy Creatures' charts are stamped "Sample".
Unlabelled rings. Moteefe's circles do not say what each figure includes.
Mixed years. Figures from different years need a note, as Poshmark gives.
Diagnostic checklist
Says who pays you and sizes the market in those terms.
Narrows from the total to your slice in clear steps.
Counts the shoppers or businesses you can reach.
Gives a source and year for every figure.
Uses the growth rate of your slice, not fashion overall.
Labels every ring or bar.
Contains no placeholder charts or unrelated trend figures.
Frequently asked questions
What market size should a fashion startup show?
The part of the market its buyers actually spend money in, with the steps from the industry total to that slice. Poshmark narrows from $200B US clothing to $27B online to $2B on eBay.
Is a big industry figure enough for a fashion market slide?
No. Probe Fashion's sourced $418B to $713B chart shows growth, but not how much a styling app could win. Add a step that counts your reachable shoppers.
How should a fashion-technology company that sells to brands size its market?
Count the brands or shops that could buy and what they spend. Moteefe counts merchants in three groups; Emperia instead quotes metaverse and NFT totals, which do not measure what brands pay.
Can a small niche figure work on a market slide?
Yes, if it is sourced and the charts are real. Lazy Creatures' $2.5B loungewear figure is the right kind of number, but its charts marked "Sample" undermine it.
How we chose these examples
Corpus: published pitch deck teardowns on StartupFundraising.com. Founder-uploaded private decks are excluded.
Selection (2026-10-01): we searched extracted slide text across the full corpus for market size, TAM, SAM, SOM and market opportunity wording near fashion, apparel and clothing. About 25 slides matched. Kept six market slides from five fashion, apparel and fashion-technology decks that no other guide uses.
Not used: Liberare p11 (used in the beachhead market draft), slides from music, gaming, marketplace and storefront decks that matched on wording only, and slides that mention clothing only in passing.
Status checks (2026-10-01): Wikipedia for Poshmark's listing and acquisition. No market figure on these slides was checked against its original report.
Review: stored slide text and images were checked on 2026-10-01 against company, deck and slide number (editorial model review). No person has yet completed an editorial review of this page. We make no claim that any slide caused a fundraising outcome.