Gaming Market Size Slides: 7 Real Startup Examples
How games and gaming-tools startups size their market: games played × fee, payers × spend, or industry revenue by platform.
Gaming Market Slide: Players, Spend and Your Share
Global games revenue is one of the easiest big numbers to quote, and almost every gaming deck quotes it. Investors have seen it many times. What they look for is the step from the whole industry to the players, games or studios a startup can reach, and what each is worth. The slides below range from a full bottom-up calculation to a list of acquisitions.
TL;DR
Count the activity you earn from (games played, paying players or studios served), multiply by what you earn per unit, and show a first-year figure next to the headline. Stakester is the clearest example: 2.4bn addressable games a month, a 1% share worth $285m a year, and a bottom-up first-year figure of 200k games and $2m. Industry revenue by platform (SuperScale, Legends Studios) is useful context but doesn't show what the startup could earn.
Gaming market slides from real pitch decks
Each example shows the slide above its analysis and links to the full teardown. Slides that build from a paying unit come first. Claims are as shown on the slides; comments and calculations are ours.
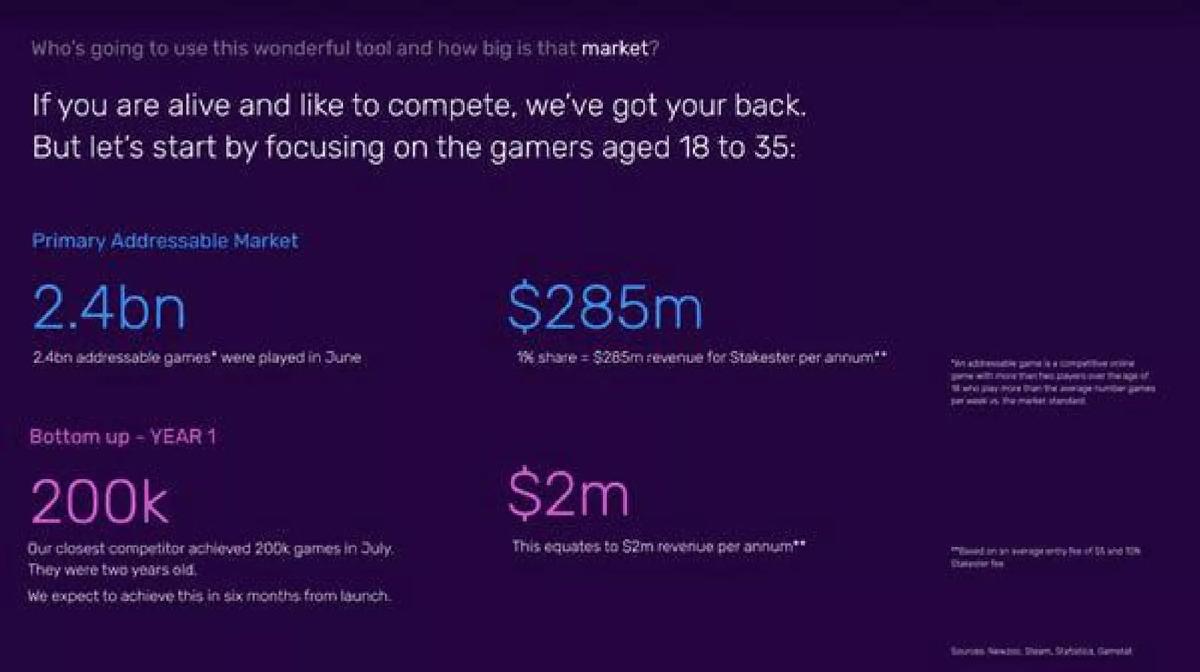
Stakester market slide — slide 6
Platform for playing competitive online games for stakes.
Stakester deck, slide 6. Exact stored slide matched to this analysis.
Our analysis: Games × fee, top-down share plus a bottom-up first year.
Evidence and limitation: It defines the unit (a competitive game by an 18-35 player), gives a share, and adds a bottom-up first year anchored on a competitor. Our calculation: 2.4bn × 12 months × 1% = 288M games a year. At a $5 entry and 10% fee that is $0.50 per entry, so $285m only works if about two entries are charged per game (288M × $1 ≈ $288m). The slide doesn't say that. The same $1 a game fits the year-one figure: 200k games a month × 12 ≈ $2.4m.
What a founder can adapt: "[N] games/month × 12 × [share]% × $[fee per game] = $[X]. Year 1: [M] games × $[fee] = $[Y]."
Supporting analysis
What the deck claims: "Who's going to use this wonderful tool and how big is that market?" "Let's start by focusing on the gamers aged 18 to 35." "Primary Addressable Market: 2.4bn addressable games* were played in June." "$285m: 1% share = $285m revenue for Stakester per annum**." "Bottom up - Year 1: 200k. Our closest competitor achieved 200k games in July. They were two years old. We expect to achieve this in six months from launch." "$2m: This equates to $2m revenue per annum**." Footnotes define an addressable game and state "an average entry fee of $5 and 10% Stakester fee."
Presentation choice: Investors get both the ceiling and a near-term, checkable number.
When it does not fit: Leaving the per-game revenue implicit.
Ingyre deck, slide 3. Exact stored slide matched to this analysis.
Our analysis: Payers × spend by region, with sources.
Evidence and limitation: It separates gamers from payers and gives spend per payer by region, with sources. Our checks: the six regional revenues add up to $21.82B, matching the $21.7B headline; North America's 66M payers × $6.21 × 12 months ≈ $4.9B, matching its revenue. It is an industry view; the slide doesn't say which regions or share the company targets.
What a founder can adapt: "[Region]: [N] payers × $[spend]/month × 12 = $[X]; we target [region] at [share]%."
Supporting analysis
What the deck claims: "Mobile gaming market is already huge and still growing." "Mobile games are expected to bring $21.7Bn in revenues in 2014, up from $17.5Bn in 2013." "By 2017, mobile gaming market size will reach $35.4Bn, representing 19.1% CAGR for 2013-2017." Map by region, e.g. North America: "$4,900MM revenue; 152MM gamers, 66MM payers; $6.21 average spend per payer"; Asia Pacific: "$12,200MM revenue; 740MM gamers, 243MM payers; $4.17 average spend per payer." Note: per month per paying mobile gamer. Source: AppLift data for 1H14; Newzoo Global Games Market Report, June 2014.
Presentation choice: The payer split is the figure that matters in free-to-play.
When it does not fit: Stopping at the industry total.
Growth and optimisation services for existing games.
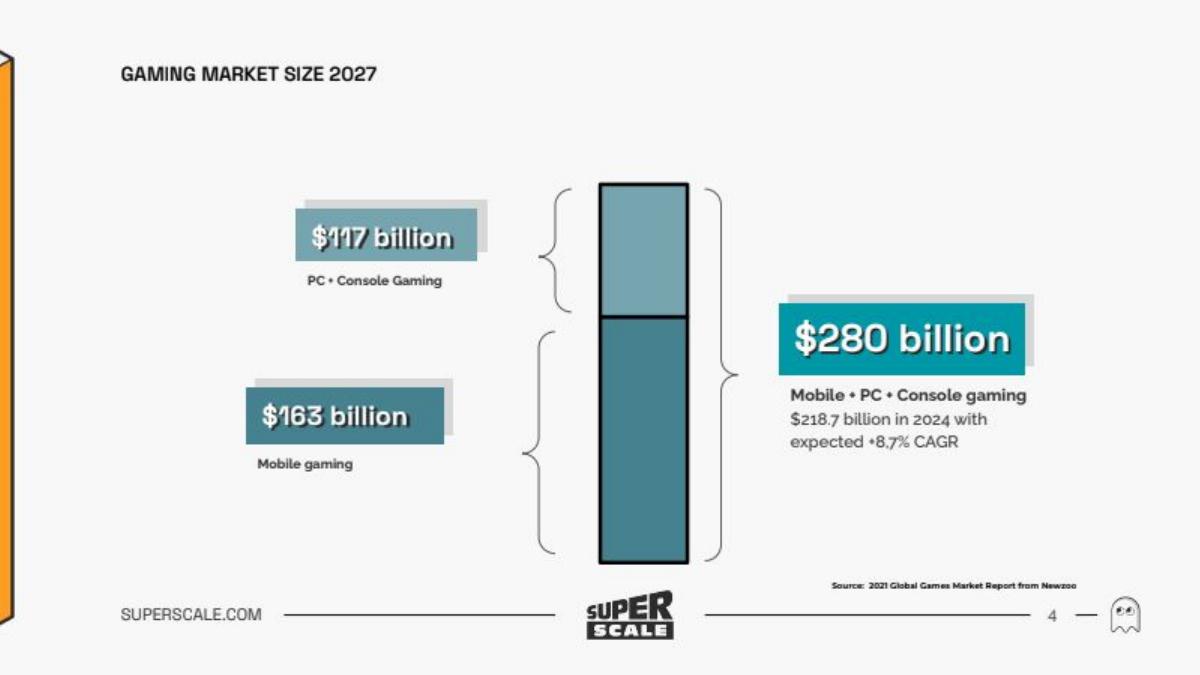
SuperScale deck, slide 4. Exact stored slide matched to this analysis.
Our analysis: Sourced industry total split by platform.
Evidence and limitation: A sourced platform split. Our checks: $117B + $163B = $280B; $218.7B grown at 8.7% for three years ≈ $281B, consistent. It is the industry total, not SuperScale's market; its later slides narrow it to an optimisation fee (analysed in our AI market guide).
What a founder can adapt: "[Platform] $[X] ([source, year]) → [segment you serve] $[Y] → [fee]% = $[Z]."
Supporting analysis
What the deck claims: "Gaming market size 2027." "$117 billion PC + Console Gaming." "$163 billion Mobile gaming." "$280 billion Mobile + PC + Console gaming. $218.7 billion in 2024 with expected +8,7% CAGR." Source: 2021 Global Games Market Report from Newzoo.
Presentation choice: A clean starting point for a narrowing sequence.
When it does not fit: Ending the market story at the industry total.
Games studio combining streamed PC/MMO play with mobile games.
New Legends Studios deck, slide 4. Exact stored slide matched to this analysis.
Our analysis: Two platform segments that frame the product.
Evidence and limitation: It names the two segments its product sits between and gives each a size. Our sum: $24B + $29B = $53B of the $86.1B total. The market is the two segments' revenue; the slide doesn't show how much of either a streaming-friendly mobile game could earn, or give sources.
What a founder can adapt: "[Segment A] $[X] + [segment B] $[Y] ([source]); our wedge: [N] players × $[spend] = $[Z]."
Supporting analysis
What the deck claims: "Market Size Opportunity." "PC/MMO Games $24 Billion 2016"; "Mobile Games $29 Billion 2016"; "Game Industry: $86.1 Billion 2016." Bullets: "Sharing & watching gameplay videos is huge phenomena - more spectators than cable TV networks"; "Mobile Games is biggest growing sector in the game industry (CAGR: Tablet +47.6%, Phones: +18.8%)"; "Making fun-to-watch mobile games taps into the huge opportunity to bridge the two sectors."
Presentation choice: Pointing to the segments it bridges explains the product thesis.
When it does not fit: Two segment totals presented as reachable revenue.
SolChicks deck, slide 5. Exact stored slide matched to this analysis.
Our analysis: Comparable titles and a new-player argument, unquantified.
Evidence and limitation: It sizes by comparable games' audiences and argues P2E brings in new players. The figures are hard to rely on: the revenue labels have no units or period, League of Legends is shown with less revenue than Diablo despite 60 times the users, and the note calls LoL's 180m users DAU while the table says MAU. "Magnitudes bigger" is not quantified.
What a founder can adapt: "[Genre] players [N] ([source]); P2E conversion [x]% × $[spend] = $[X]."
Supporting analysis
What the deck claims: "The LoL, Dota, and Diablo franchises are a proven entertainment model that have built a following over 200M people, despite not having P2E." Diablo "Revenue: 300M, MAU: 3M"; League of Legends "Revenue: 50M, MAU: 180M"; Dota "Revenue: 1M, MAU: 11M." "We believe that replicating this proven method ... with an additional P2E element will result in an addressable market magnitudes bigger than the traditional gaming markets." "Categorisation of Axie game users (estimated)": 30% played some form of game before, 70% never played a game before. "Note that Axie still has a 1% penetration of users vs LoL's 180m DAU users."
Presentation choice: Comparables can show demand for a genre.
When it does not fit: Unitless revenue and inconsistent user labels.
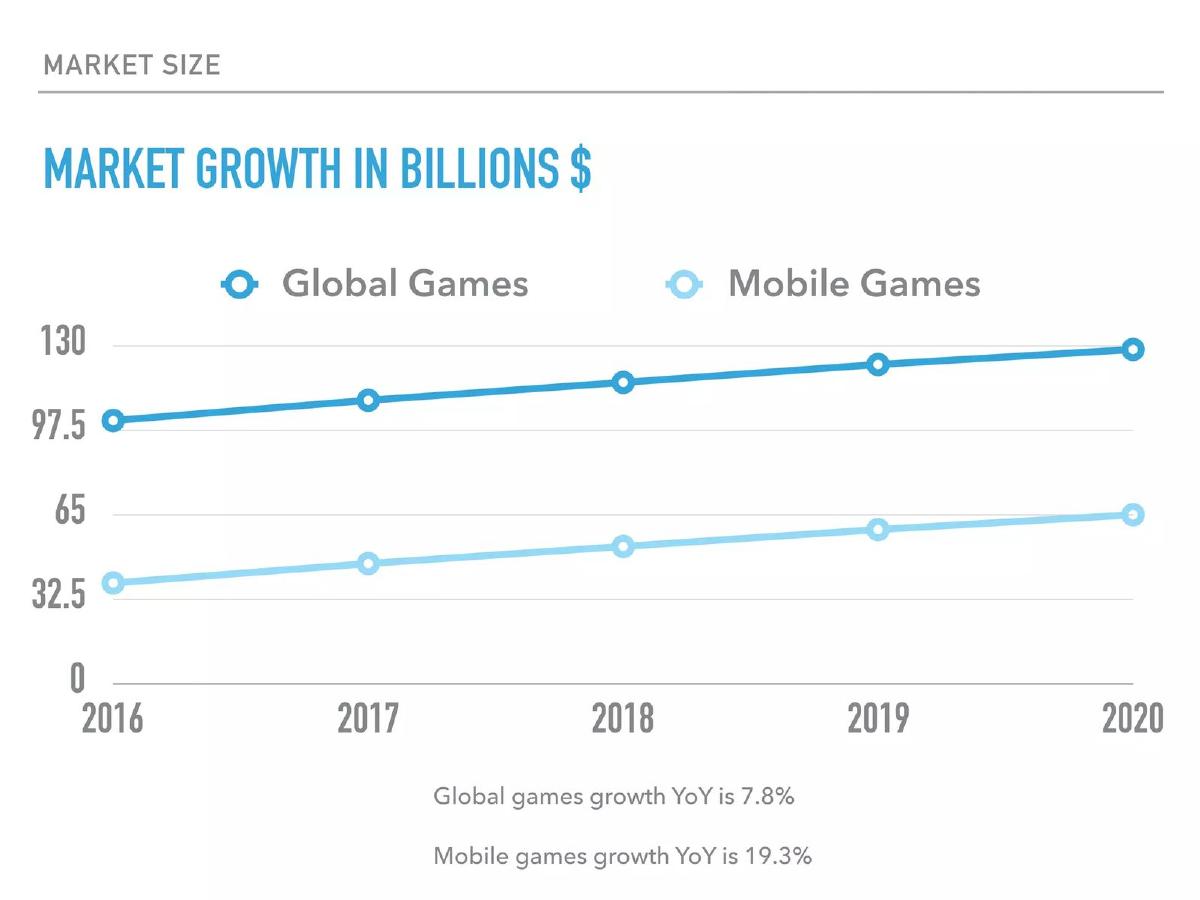
Conquerors of the Realm deck, slide 4. Exact stored slide matched to this analysis.
Our analysis: Unlabelled growth chart.
Evidence and limitation: Weaker example. A growth chart with no data labels, no source and no link to the game. The mobile line on the chart rises far more slowly than the 19.3% a year stated beneath it, so the chart and the text don't agree (our reading of the axis).
What a founder can adapt: "Mobile [genre] $[X] ([source, year]); [N] players × $[ARPPU] × [payer]% = $[Y]."
Supporting analysis
What the deck claims: "Market size: market growth in billions $." Line chart of global games and mobile games, 2016-2020, on a 0-130 axis. "Global games growth YoY is 7.8%." "Mobile games growth YoY is 19.3%."
Presentation choice: Growth rates alone don't size a game's market.
When it does not fit: A chart without values or source.
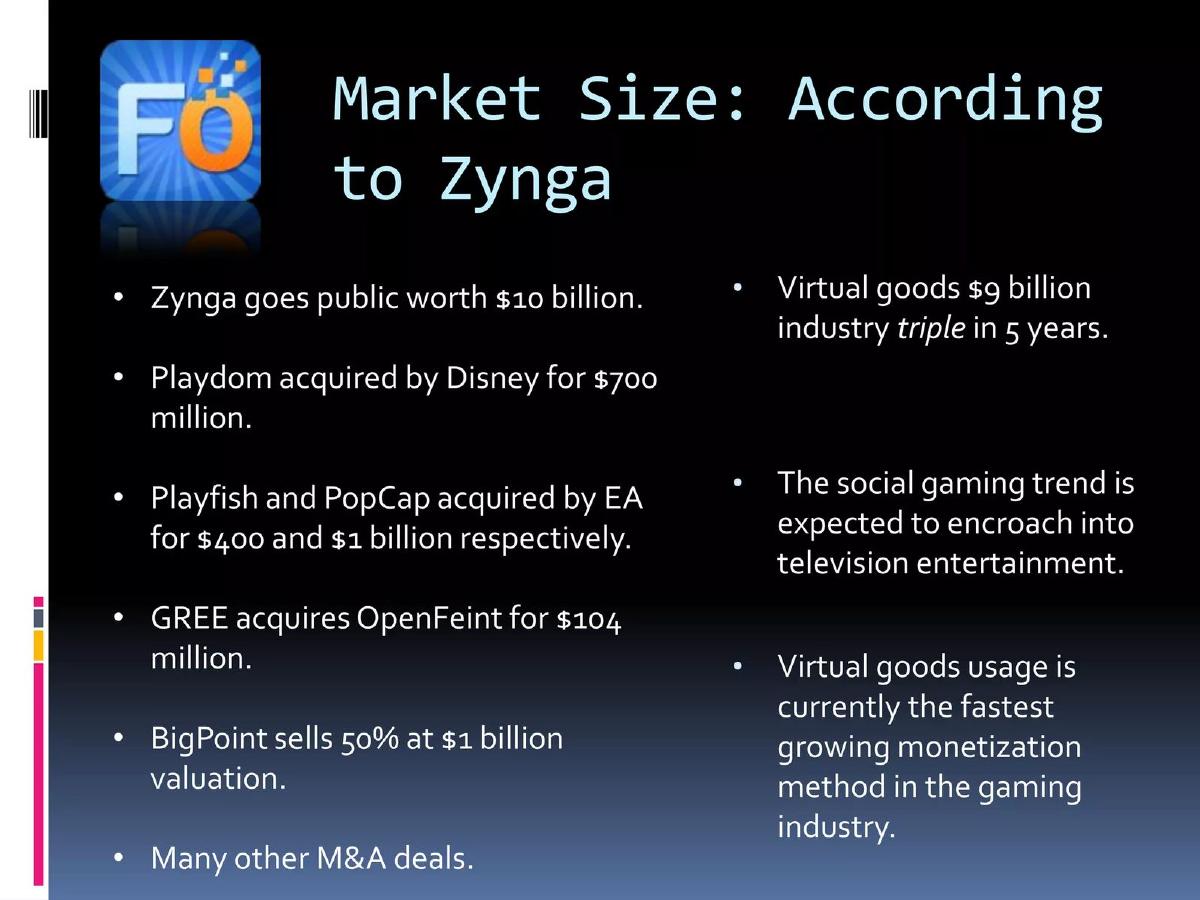
Fayceoff deck, slide 2. Exact stored slide matched to this analysis.
Our analysis: Deals and valuations in place of a market.
Evidence and limitation: Weaker example. Company valuations and acquisitions show investor appetite for social games, not a market size. The one market figure, $9 billion in virtual goods, has no source, year or link to what Fayceoff would sell.
What a founder can adapt: "Social game virtual goods $[X] ([source, year]); [N] players × [payer]% × $[spend] = $[Y]."
Supporting analysis
What the deck claims: "Market Size: According to Zynga." "Zynga goes public worth $10 billion." "Playdom acquired by Disney for $700 million." "Playfish and PopCap acquired by EA for $400 and $1 billion respectively." "GREE acquires OpenFeint for $104 million." "BigPoint sells 50% at $1 billion valuation." "Virtual goods $9 billion industry triple in 5 years." "The social gaming trend is expected to encroach into television entertainment."
Presentation choice: Investors can't size a market from other companies' exits.
When it does not fit: Acquisition prices as market size.
Which kind of gaming market slide answers which question.
Approach
Example
Answers
Leaves open
Games × fee, top-down + bottom-up
Stakester
Ceiling and year one
Per-game revenue
Payers × spend by region
Ingyre
Who pays, how much
Own target
Sourced platform split
SuperScale
Industry context
Own segment (later slides)
Two segments framing the product
New Legends Studios
Product thesis
Reachable revenue
Comparable titles
SolChicks
Genre demand
Consistent figures
Unlabelled growth chart
Conquerors of the Realm
Growth direction
Values, source
Deals and valuations
Fayceoff
Investor appetite
Market size
Key Takeaways
Pick the unit you earn from: games, payers or studios.
State your fee or spend per unit.
Add a bottom-up first-year figure.
Use the platform segment you actually serve.
Acquisitions and hit games are not a market size.
Write your gaming market slide
Answer these before you design the slide.
Unit. What do you earn from: games played, paying players, or studios?
Segment. Which platform, genre and region do you serve?
Value. What do you earn per unit: fee, spend per payer, or contract?
Year one. What bottom-up figure can you reach in the first year, and based on what?
Source. Where does each figure come from, and what year?
Copyable framework: [N] [units] in [segment] ([source, year]) × $[revenue per unit] = $[X]. Year 1: [M] × $[revenue] = $[Y].
Illustrative example 1 — written by us
Before: "Zynga goes public worth $10 billion. Playdom acquired by Disney for $700 million."
After: "Social game players [N] ([source, year]); [payer]% pay $[spend]/month = $[X]; year 1: [M] payers = $[Y]."
What improved: Our illustrative rewrite of Fayceoff's slide; bracketed text is a placeholder, not company fact.
What's different about gaming market sizing
Most players pay nothing, and revenue comes from a minority of payers, from fees on each match, or from studios buying tools. Industry revenue mixes mobile, PC and console, and free and paid. A useful slide names the platform and the paying unit, and shows what share of players pay and how much.
What investors check
Which platform and region is counted. Whether the unit is players, payers or games. Whether your fee or spend per unit is stated and matches the total. Whether the headline is industry revenue or your own. Whether sources and years are shown.
How we read each slide
We quote the text on the slide images and mark our own arithmetic as ours. We have not checked any market figure or source. Page numbers are pages in the original deck file. All seven images were already stored and were checked pixel-for-pixel against fresh renders of the decks.
Common mistakes
Industry total as your market. Narrow to your segment and fee.
Players instead of payers. Show the share that pays.
Exits as market size. Valuations aren't demand.
Figures that disagree. Check units and labels.
Diagnostic checklist
Paying unit defined.
Platform and region stated.
Revenue per unit shown.
Bottom-up first year.
Sources and years cited.
Frequently asked questions
How should a gaming startup size its market?
Count the unit you earn from and multiply by revenue per unit, then add a first-year figure. Stakester shows 2.4bn addressable games a month, a 1% share worth $285m, and $2m in year one.
Is global games revenue a good market size?
Only as context. SuperScale's $280B is a sourced industry total; investors then want the segment and fee you earn from.
How we chose these examples
Corpus: published pitch deck teardowns on StartupFundraising.com. Founder-uploaded private decks are excluded.
Selection (2026-09-26): we searched teardown slide text for market-size wording together with gaming, gamers, video game, esports or players, reviewed eight candidate slides from the deck files, and kept seven.
Excluded: Mapic WeArena (the slide covers VR and theme parks as well as games, and the game figure is too small to read). SuperScale's page 6 appears in the AI market guide; here we show page 4. Sports betting and casino decks are left out.
Page numbers are pages in the original deck files. All seven images were already stored and were checked pixel-for-pixel against fresh renders on 2026-09-26.
Market figures and sources are quoted from the slides and not independently verified. Calculations (sums, per-unit checks, implied fees) are ours and marked as such.
Review: slide images were checked on 2026-09-26 and matched to company, deck and page (editorial model review). No person has yet completed an editorial review of this page. We make no claim that any slide caused a fundraising outcome.