Showing a Price Premium in a Pitch Deck: Reference Price
How to show investors that customers pay you more than the alternative: name the reference price, show it holds as volume grows.
Your Price Premium in a Pitch Deck: Show What You Charge More Than, and Why Customers Pay It
Many founders claim pricing power with one line: "we command a premium." Investors want to know three things that line doesn't say. More than what? Is it holding as you sell more? And what does the customer get that makes the extra money worth paying? Two real decks answer them in complementary ways. Canndescent plots its average selling price against every competing brand's, using third-party sales data, in two different years, which shows a premium surviving growth. Aveda ties an 11% premium to a measured result: a rig move in 4 days instead of 11, which shows why a customer pays it. This guide shows how to build a premium claim an investor can check.
TL;DR
To show a price premium, state it as a percentage over a named reference price (a competitor's price, the market average, or the commodity the customer would otherwise buy), give the source and period of both prices, and show it has held while your volume grew. Then show why the customer pays it: a measured benefit worth more than the extra price, such as time saved or a lower total cost. One slide can do this with one chart or table plus a footnote. Without a reference and a source, "premium pricing" reads as an opinion.
Two real ways to show a price premium
Each slide was read from its original deck page. Readings of charts by eye and our arithmetic are labelled; company figures are reported as printed and not verified.
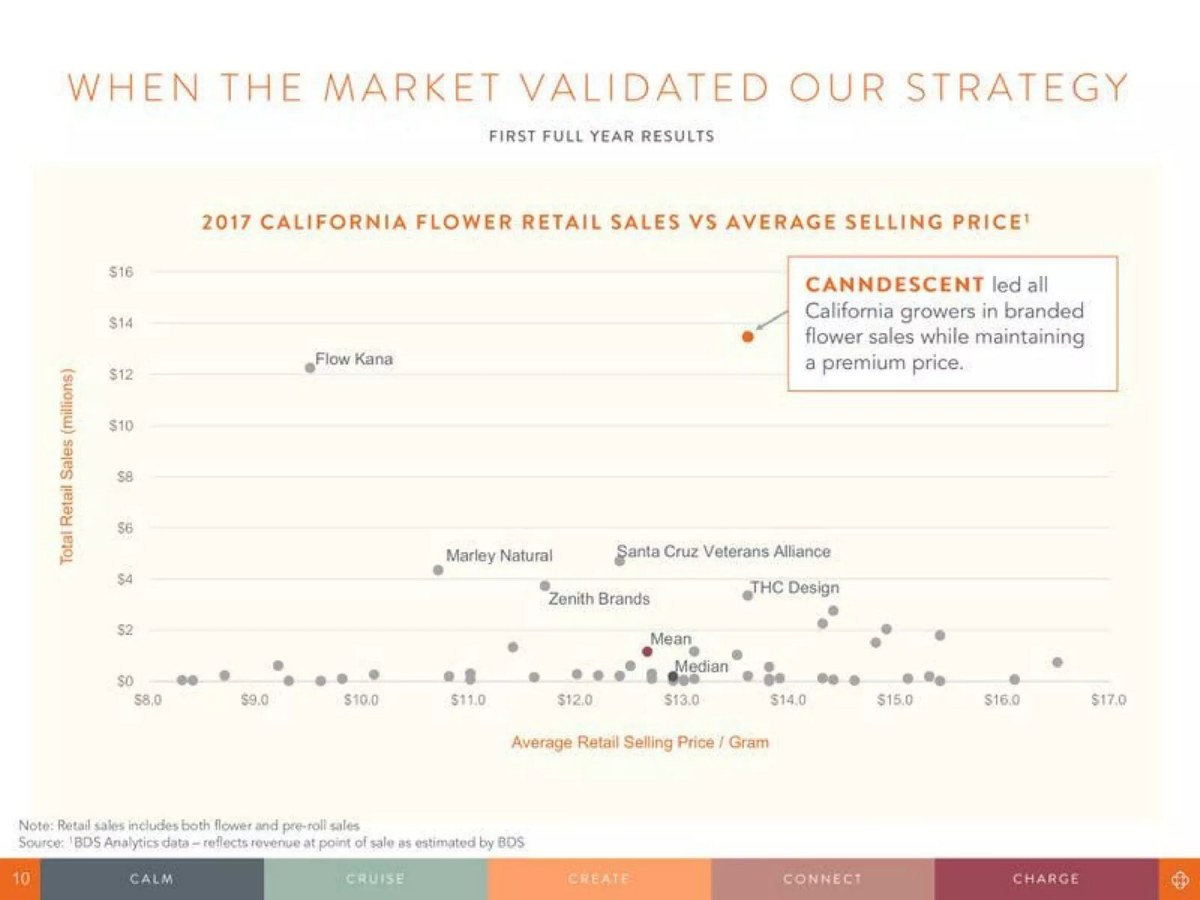
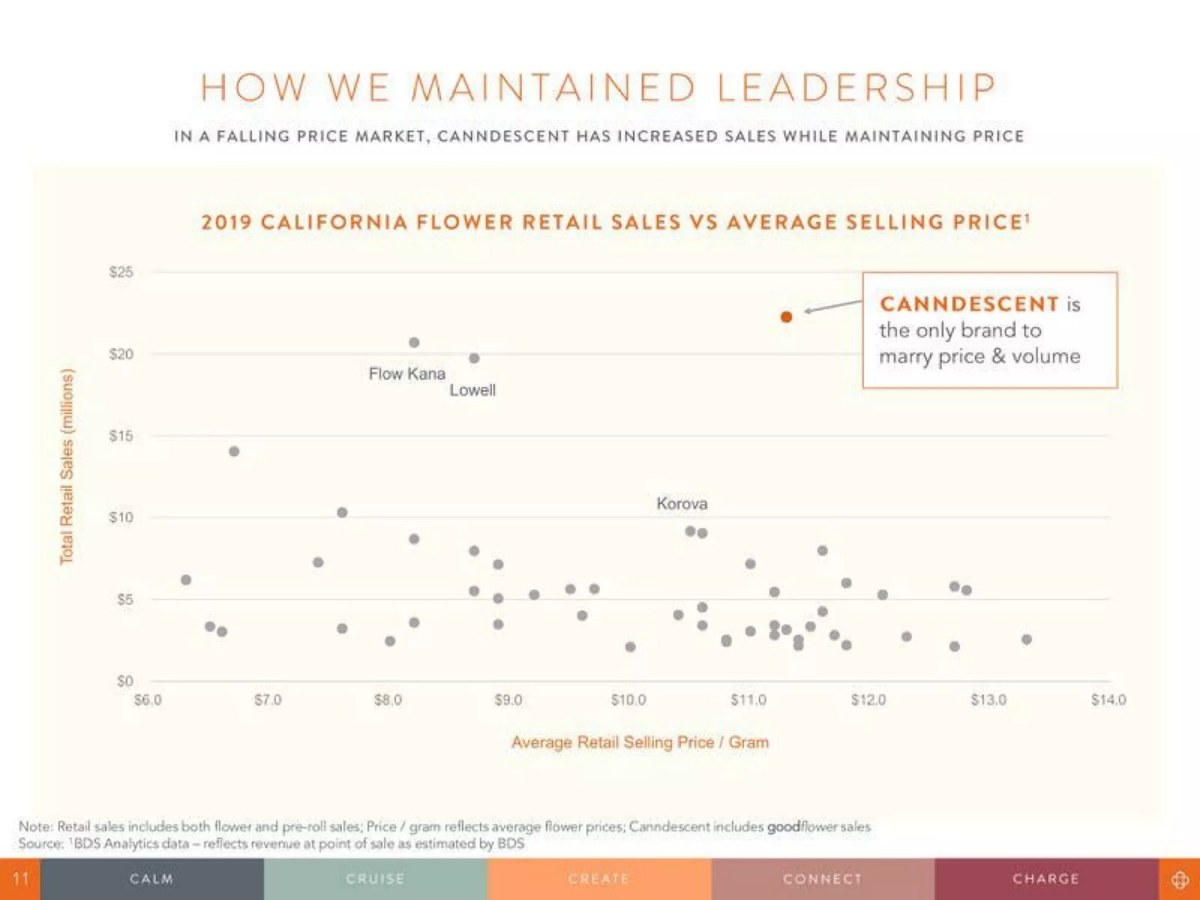
Canndescent pricing slide — slides 10–11
California cannabis flower brand; pages 10 and 11 of its deck, "When the market validated our strategy" (first full year) and "How we maintained leadership".
Canndescent deck, slide 10. Exact stored slide matched to this analysis.Canndescent deck, slide 11. Exact stored slide matched to this analysis.
Our analysis: The stronger proof of the two: an independent data source, every competitor plotted, and the same view repeated two years apart so a reader can see the premium survive growth. Its gaps: values must be read by eye, the 2019 chart drops the mean and median, and "maintaining price" hides a fall in its own dollar price.
Evidence and limitation: Our reading by eye: 2017 about $13.70/gram and $13.5M; mean brand about $12.70 and $1.2M. 2019 about $11.40/gram and $22M; Flow Kana and Lowell at about $8.20–$8.70 and $20–$21M. So Canndescent's price premium over the mean was roughly 8% in 2017; in 2019 no mean is marked. Its own price fell about 17% between the two charts. Prices are retail selling prices estimated by a third party, not Canndescent's wholesale price.
What a founder can adapt: Label your own point and the market average with values, keep the same reference in each period, and state the change: "our price −[x]% vs market average −[y]%".
Supporting analysis
What the deck claims: Page 10: "2017 California flower retail sales vs average selling price", a scatter of brands by "Average Retail Selling Price / Gram" ($8–$17) and "Total Retail Sales (millions)" ($0–$16), with a mean and median marked; callout: "Canndescent led all California growers in branded flower sales while maintaining a premium price." Page 11: the same chart for 2019 ($6–$14; $0–$25), subtitle "In a falling price market, Canndescent has increased sales while maintaining price", callout "Canndescent is the only brand to marry price & volume". Source on both: "BDS Analytics data — reflects revenue at point of sale as estimated by BDS".
Presentation choice: It shows a premium against the whole market, from third-party data, holding over two periods while volume grows.
When it does not fit: Don't say "maintained price" when you mean "kept a premium position" in a falling market.
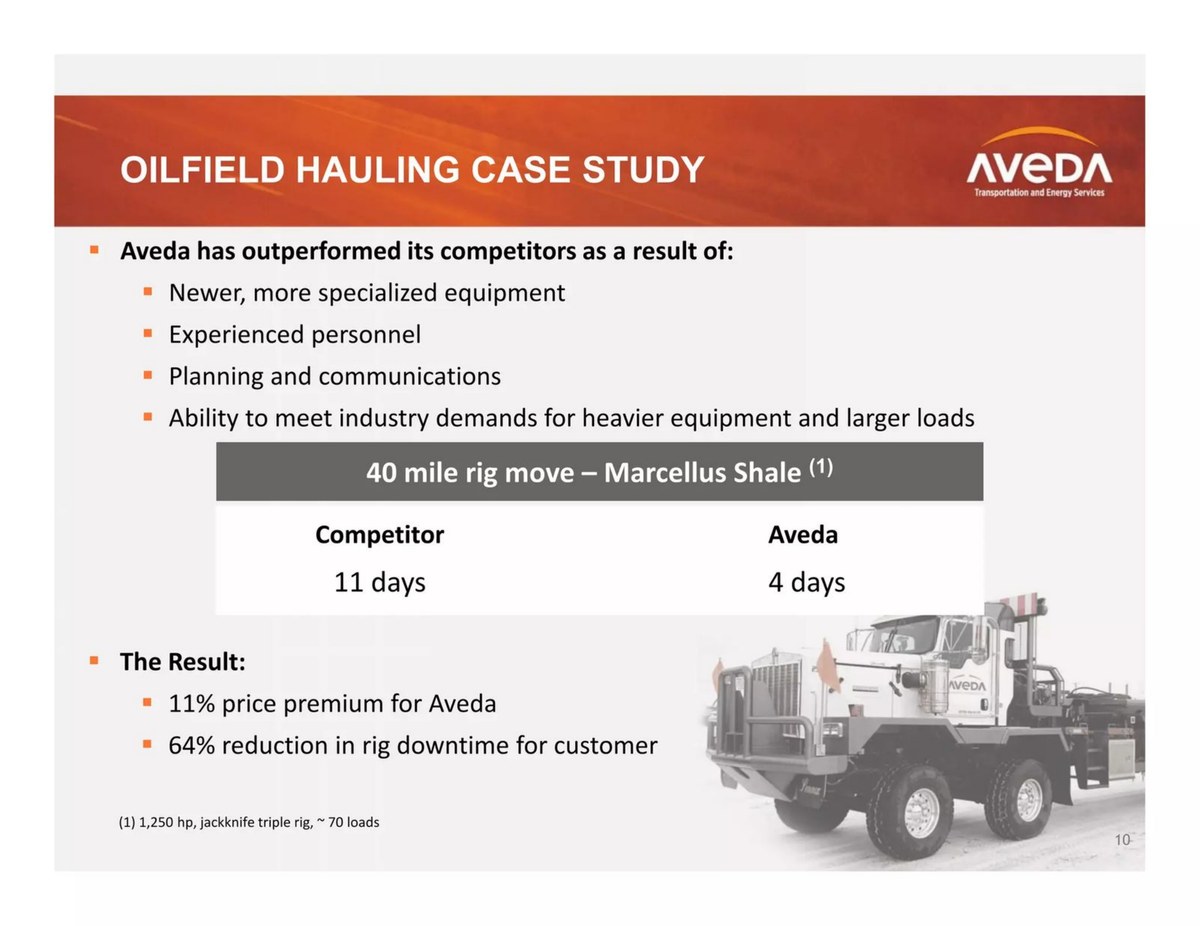
Oilfield transport and rig-moving company; page 10 of its deck, "Oilfield hauling case study".
Aveda deck, slide 10. Exact stored slide matched to this analysis.
Our analysis: The clearest link between price and benefit: a customer paying 11% more for a move finished in about a third of the time is easy to understand. As evidence of pricing power across the business, it is a single case, so it should sit beside a broader figure.
Evidence and limitation: Our arithmetic: 4 days instead of 11 is 64% less time ((11 − 4) ÷ 11 = 0.64), matching the downtime figure. The job is defined precisely in the footnote. The premium is for one job; the slide doesn't say whether it applies across Aveda's work, or what the competitor's price was.
What a founder can adapt: Keep the job-level comparison, then add the premium across all jobs in a period: "average realised premium [x]% across [n] moves, [period]".
Supporting analysis
What the deck claims: "Aveda has outperformed its competitors as a result of: newer, more specialized equipment; experienced personnel; planning and communications; ability to meet industry demands for heavier equipment and larger loads." Table: "40 mile rig move — Marcellus Shale": Competitor 11 days, Aveda 4 days. "The Result: 11% price premium for Aveda; 64% reduction in rig downtime for customer." Footnote: "1,250 hp, jackknife triple rig, ~70 loads".
Presentation choice: It shows a premium explained by a measured, customer-visible result.
When it does not fit: Don't let one case study stand for company-wide pricing.
Reference, proof, durability and reason on each page.
Slide
Premium
Reference
Source
Holds over time
Why customers pay
Canndescent p10–11
About 8% over mean (2017, by eye)
All brands, mean/median
BDS point-of-sale data
Yes, 2017 vs 2019
Not stated on slide
Aveda p10
11%
Direct competitor
Own case study
One job
4 days vs 11; 64% less downtime
Key Takeaways
A premium is a percentage over a named reference price.
Source both prices and give the period.
Show the premium holding as volume grows; a premium on tiny volume proves little.
Tie it to a benefit the customer can measure.
If the customer still saves money overall, show the split.
Your margin, forecast and market sizing should use the premium price you show.
Build your price premium slide
Answer each prompt with a number and a source.
Reference. What does the customer compare you with: a named competitor, the market average, comparable products or a commodity?
Realised price. What do customers actually pay after discounts, and over what period? Use that, not list price.
Source. Where does the reference price come from: third-party data, public price lists, customer invoices? Name it.
Durability. Has the premium held as volume grew, or as competitors changed price? Show two periods or cohorts.
Reason. What measured benefit justifies the premium, and is it worth more than the extra price?
Consistency. Do your gross margin, forecast and market size use the same price?
Copyable framework: Realised price $[a] vs [reference] $[b] ([source], [period]) = [x]% premium, across [n] customers. Held from [period 1] to [period 2] while volume grew [y]%. Customers pay it because [benefit], worth $[c] per [unit] against $[a − b] extra.
Illustrative example 1 — written by us
Before: The Result: 11% price premium for Aveda; 64% reduction in rig downtime for customer.
After: Average realised premium [x]% over [named competitors] across [n] rig moves, [period]; on a 40-mile Marcellus move, 4 days vs 11, 64% less rig downtime for the customer.
What improved: Built from Aveda's page 10. The company-wide premium, competitor set, move count and period are placeholders the slide does not give.
Illustrative example 2 — written by us
Before: In a falling price market, Canndescent has increased sales while maintaining price.
After: 2017–2019: our average price −[x]% vs market average −[y]%, while our sales rose from $[a]M to $[b]M (BDS Analytics).
What improved: Built from Canndescent's pages 10–11. Exact percentages and sales figures are placeholders; our by-eye readings are approximate.
Why investors care about a price premium
A higher price than the alternative means more gross profit on every sale, and it suggests customers value something they can't get elsewhere. Pricing is also one of the strongest levers on profit: a McKinsey analysis by Marn and Rosiello, published in Harvard Business Review, calculated that for an average company in its analysis, a 1% price improvement with no loss of volume raised operating profit by 11.1%. That is why a credible premium is worth a slide, and why investors test the claim.
The test is simple. Is the premium real (customers actually pay it, not just the list price)? Is it durable (does it survive as you sell more, and as competitors cut prices)? And is it earned (is there a reason customers pay it that will still be true next year)? Each of the two examples below answers some of these questions well and leaves others open.
Every premium is relative to something, and the choice changes the figure. Four common references: the direct competitor's price for the same job (Aveda's "Competitor"), the market average across all sellers (Canndescent's mean and median brand), comparable products nearby (other furnished rentals in the same area, for example), or the commodity the customer would otherwise buy (a standard grade of the same material).
Pick the one your customer actually compares you with. If a buyer chooses between you and a commodity, the commodity price is the honest reference, even if it makes the premium look larger. Then name it on the slide. "A 40% premium over market comps" becomes checkable once it says which comparable products, which rate (per unit, per month, per night) and which period.
Compare like with like. A premium over list price when customers actually pay discounted prices overstates it. A comparison with a product that differs in size, grade, service level or what is included needs a note saying what differs.
Show that it holds as you sell more
A premium on a few hundred sales tells an investor little; a premium that survives growth tells them a lot. Canndescent's two slides make this case by repeating the same chart two years apart. In 2017 its dot sits at about $13.70 per gram and $13.5M of retail sales, above every competitor on sales. In 2019 it sits at about $11.40 and $22M while most of the market's dots have moved left, and the headline says it "increased sales while maintaining price."
Reading the two charts together also shows a limit of the claim. By eye, Canndescent's own average price fell from about $13.70 to about $11.40, roughly 17%, and the x-axis range moved from $8–$17 to $6–$14. "Maintaining price" therefore means keeping its position near the top of a falling market, not holding the same dollar price. That is still a strong result, but the slide would be more convincing if it said so in numbers: our price fell X% while the market average fell Y%.
If you only have one period, show the premium against volume within it, for example by customer cohort or by quarter, so the reader can see it isn't confined to your first, most enthusiastic customers.
Connect the premium to what the customer gains
The most persuasive premium slides explain why customers pay more. Aveda's case study is a compact model: a defined job (a 40-mile move of a 1,250 hp triple rig, about 70 loads), the competitor's result (11 days) against Aveda's (4 days), and then "11% price premium for Aveda" and "64% reduction in rig downtime for customer." A reader can see that the customer paid about a tenth more for a job finished in about a third of the time.
Some products cost the customer more per unit but less in total, because they last longer, need less of something else or cut waste. That is the strongest form of the argument, and it needs a split. Show the customer's total cost both ways for the same job, and where the extra price goes. For example (our illustration): a coating sells for $60 a litre against $45 for the standard product, a 33% premium, but covers twice the area, so the customer pays $30 instead of $45 per square metre coated. On the slide, show the per-litre and per-square-metre prices side by side and state the coverage figures and where they come from.
When you show that kind of split, state the unit that makes the comparison fair and the assumption that links the two units. If the per-unit premium is measured from invoices but the total saving depends on a usage rate from your own trials, say so, give the number of trials, and expect investors to ask about it first.
Calculate the realised premium from your own invoices
List prices are what you publish; realised prices are what customers pay after discounts, rebates, free months, bundled services and promotions. Investors care about the second. To calculate it, take revenue for a product over a period and divide it by the units sold in the same period, then do the same for the reference if you can get it. If you sell through retailers, use the price you receive, not the shelf price, and say which you show.
Then check the spread. An average premium of 15% might come from most customers paying 15%, or from a few large customers paying 30% while the rest pay list or less. Show the range or the median beside the average, and say whether your largest customers pay more or less than the others. A premium that only small customers pay tends to shrink as you sell to bigger ones, and investors know it.
Finally, watch the mix. If your average price rises because you sold more of your expensive product, that is a mix change, not a premium on the same product. Compare like for like: the same product, or the same size of job, in each period.
If your premium is new or small
A young company may have a premium on only a few dozen sales, or a premium of a few percent. Both are still worth showing if the slide is honest about it. Give the count ("across our first 40 orders"), the period and the range, and say what you will measure next. A small premium that holds as you grow can be more convincing than a large one on a handful of early, enthusiastic customers.
If you have no premium yet but plan to charge one, don't present a planned price as a result. Put the planned price in the forecast, label it as planned, and show the evidence that customers will pay it: pilot customers who accepted it, a signed order at that price, or a test where some prospects saw the higher price. Keep that evidence separate from today's actual prices on the slide.
A worked example (hypothetical)
Take an invented company selling software-managed refrigerated storage to grocers. Competitors charge $40 per pallet per month; it charges $46. Premium: (46 − 40) ÷ 40 = 15%.
Proof it is real: over the last four quarters, 38 customers paid an average realised price of $45.20 after discounts, a 13% premium; on the slide, use 13%, not the 15% list figure. Proof it holds: pallets under management grew from 4,000 to 11,000 over the same period while the realised price stayed between $44.80 and $45.60.
Why customers pay: spoilage on stored produce fell from 3.0% to 1.2% of stock value at the 12 customers who shared data. For a pallet holding $2,000 of produce, that is $36 a month less spoilage against $5.20 of extra price. All figures in this example are invented for illustration.
Make the rest of the deck agree
If your premium price is on the pricing slide, the same price should drive your gross margin, your revenue forecast and any bottom-up market size. A premium that disappears in the financial model (because the forecast uses a lower market price) or one that appears only in the forecast (because today's sales are discounted) will be noticed.
Investors will also ask what happens if a competitor cuts its price. Canndescent's 2019 slide is partly an answer: in a market where prices fell, it kept its relative position and grew sales. If you have evidence like that, use it; if you don't, say what would protect the premium (switching costs, a measured benefit, a brand customers ask for by name) and be ready to discuss the scenario where it narrows.
Common mistakes
No reference. Say what you are more expensive than.
List price, not realised. Use what customers pay after discounts.
One case as proof. Pair a case study with a premium across all sales.
Unlike products. Note what differs between your product and the reference.
"Maintained price" in a falling market. Give both your change and the market's.
Premium missing from the model. Use the same price in margin and forecast.
Diagnostic checklist
The premium is a percentage over a named reference price.
Both prices have a source and a period.
The figure is a realised price, not list.
The premium is shown in at least two periods or cohorts.
A measured customer benefit explains it.
If the customer saves overall, the split is shown with its basis.
Margin, forecast and market size use the same price.
Frequently asked questions
How do you calculate a price premium?
Your price minus the reference price, divided by the reference price. At $46 against a $40 reference, the premium is 15%. Use realised prices for both where you can.
Should I show a premium if I'm also claiming to save customers money?
Yes, if both are true. A higher price per unit can still mean lower total cost, for example when a product lasts longer or less of it is needed. Show the unit for each and the assumption that links them.
What counts as evidence of pricing power?
A premium that holds as you grow and as competitors change prices, ideally measured by a third party or from your invoices. A single case study or a list-price comparison is weaker.
Where should the price premium go in the deck?
Usually on the pricing or business model slide, or in a case study if it is tied to one customer result. Wherever it sits, make the financial slides use the same price.
How we chose these examples
Discovery (2026-10-04, run 83): searched the deck collection for average selling price, price premium and pricing power, after earlier runs found actual-vs-plan and backlog topics covered. Closest content read: the live pricing slide guide, the unpublished price-comparison draft (cost less than the alternative), the live deal-size guide. None teaches how to show and support a realised price premium.
Rendered and read at full size from the original deck files: Canndescent 10 and 11, Aveda Energy 10, and Circ 7. Circ 7 was set aside because its 25% and 200% premiums describe the recycled-fibre market, not Circ's own prices. Both used decks are published teardowns. The images were prepared at 1200px wide and uploaded through the standing slide-image workflow. Repair (2026-10-07, v2): two examples, and every figure taken from them, were removed because their decks are held under the whole-deck source rule; every page of the Canndescent and Aveda decks was reviewed visually, its top and bottom edges were read by text recognition at double size, and small corner labels were magnified; neither carries a confidentiality or distribution notice (Canndescent page 4 and Aveda page 2 are securities and forward-looking-statement disclaimers, not distribution restrictions). The coating example and the worked example are invented.
Chart readings are by eye and described as such. Ratios are our arithmetic from printed values. Company figures are reported as printed and not verified. This guide explains presentation, not pricing, legal or investment advice. Slide readings and analysis are an AI editorial model review, not human-checked.