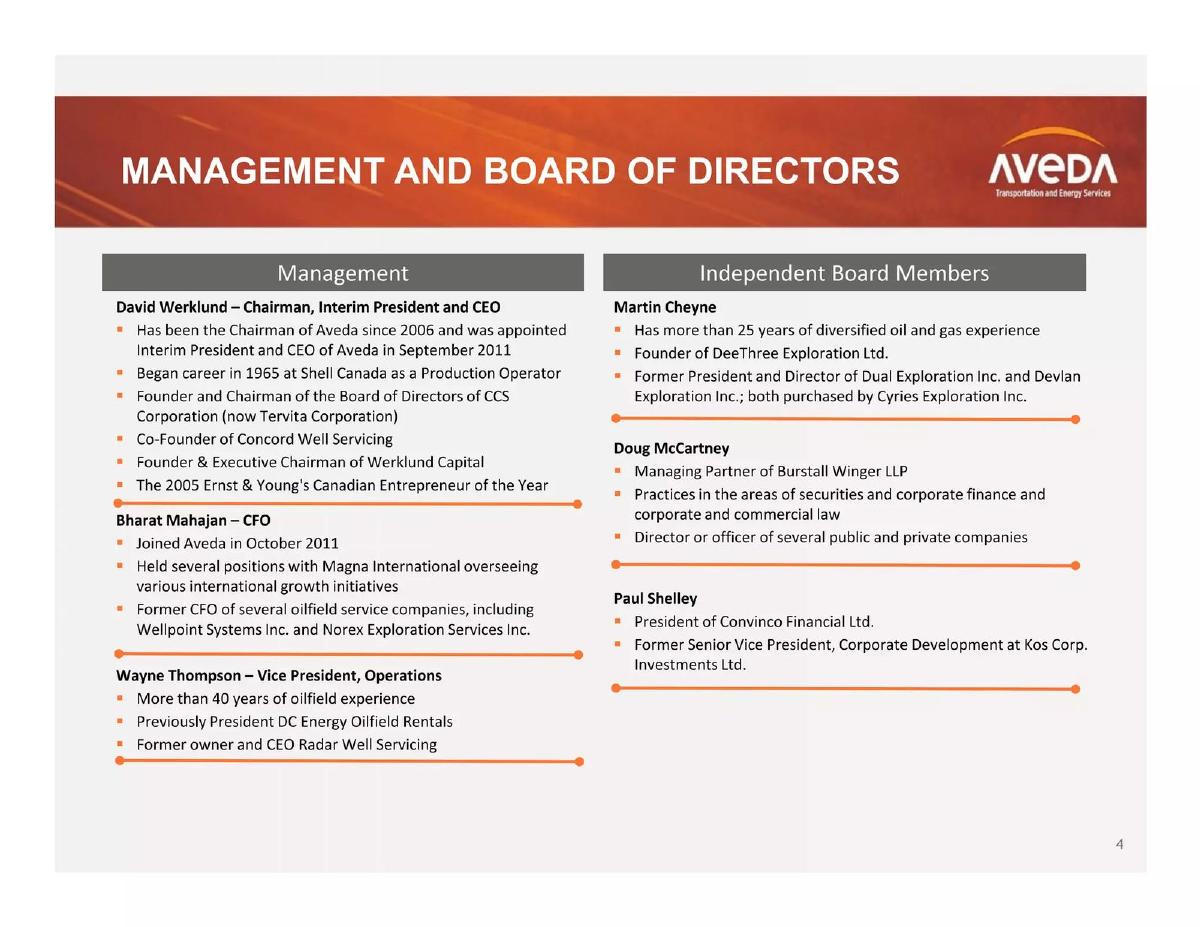
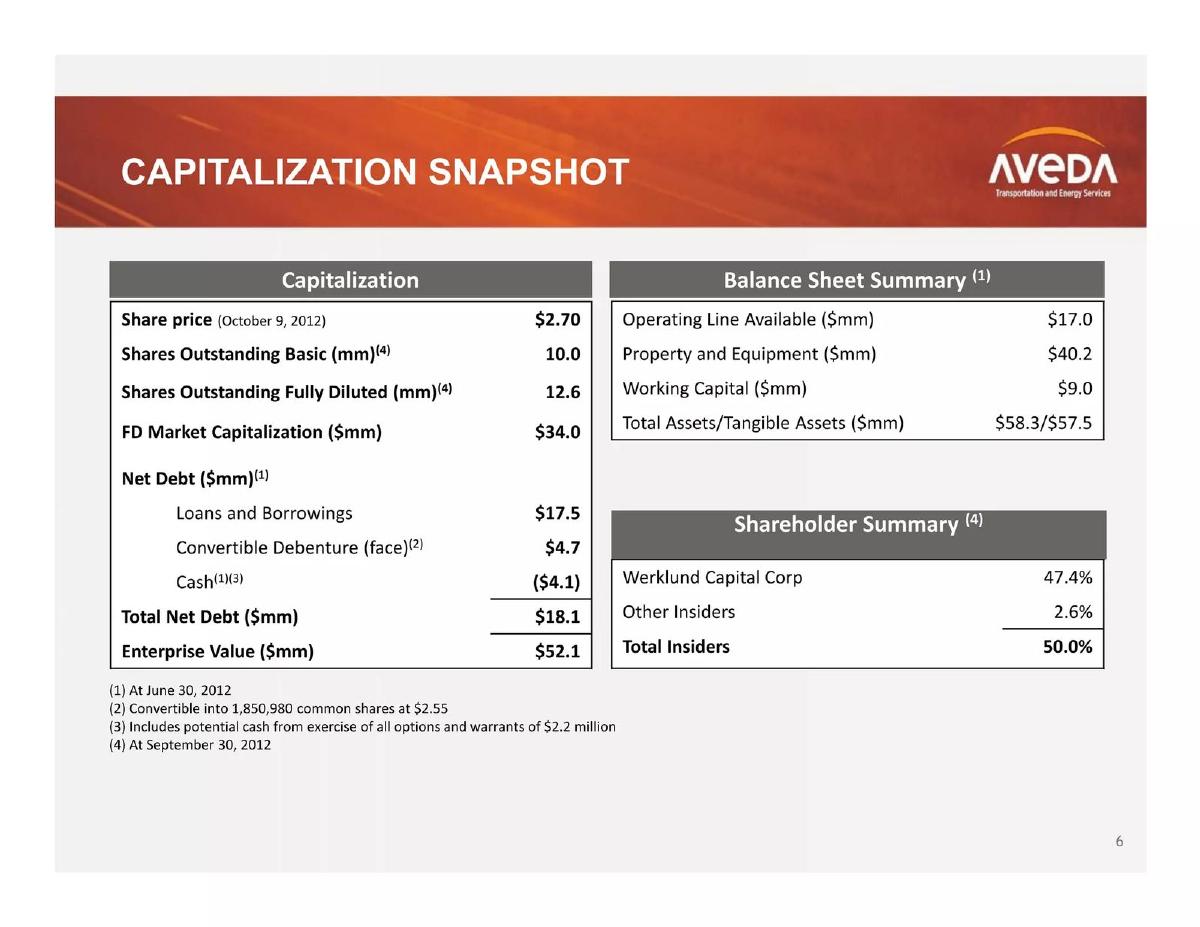
Aveda Energy’s October 2012 presentation serves as a strategic roadmap for an oilfield services company transitioning through a recapitalization phase. The deck focuses heavily on the 'Management Track Record,' specifically highlighting David Werklund’s success with CCS Corporation, which achieved a 2,490% total return over 15 years (Slide 5). The business model is split between high-utilization oilfield hauling and a growing rental division, supported by a fleet of 469 hauling units and 750 rental pieces (Slides 9, 11). Financially, the company demonstrated significant momentum with 81% reve…
Key takeaways
- The company was founded in 1994, went public in 2006, and underwent recapitalization in 2011 (Slide 3).
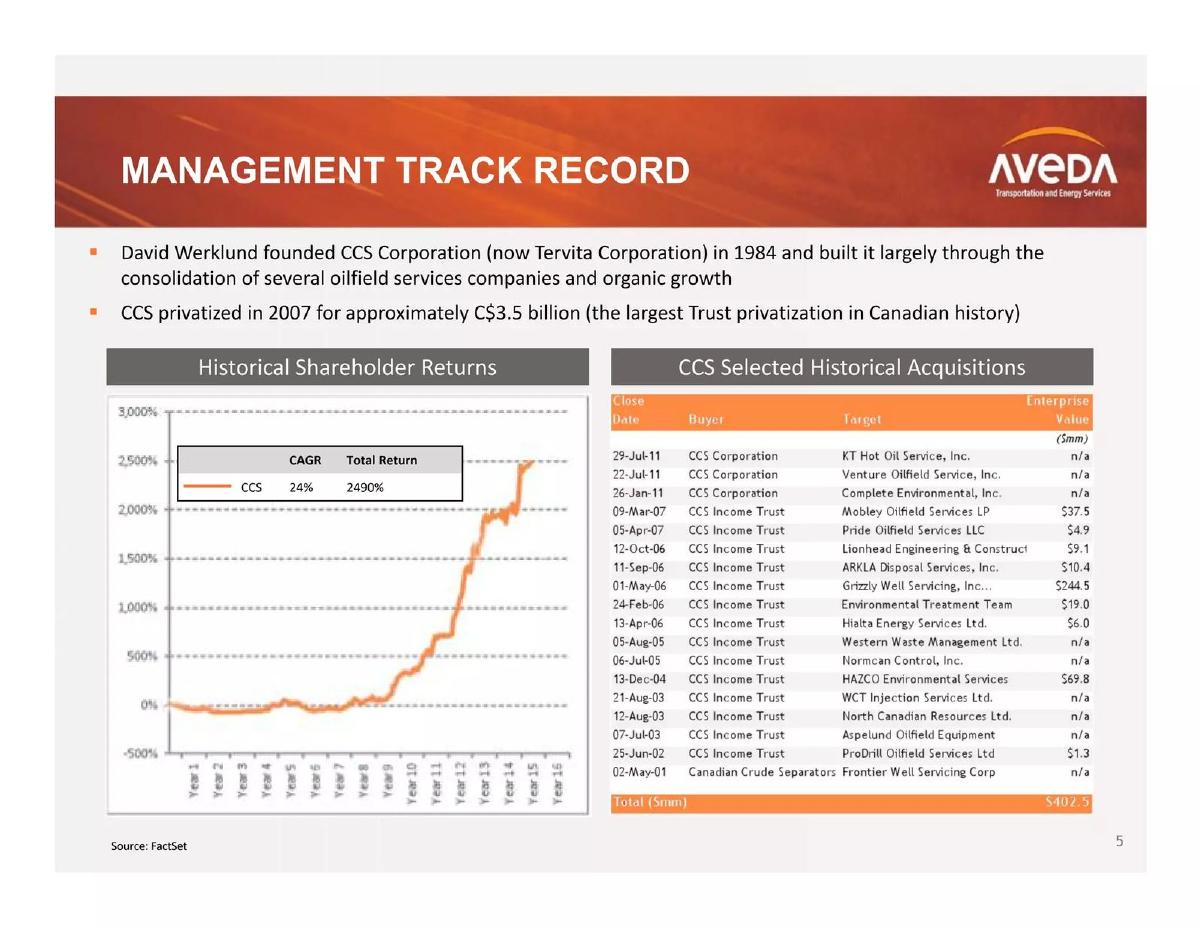
- Management credibility is anchored by David Werklund, who built CCS Corporation into a C$3.5 billion entity (Slide 5).
- The hauling market is quantified by 2,150 active rigs in North America, with each rig averaging 17 moves per year (Slide 7).
- Aveda operates a modern fleet including 142 power units and 238 employees, 143 of whom are operators (Slide 9).
- The rental division is a key growth lever, increasing its revenue contribution from 5% in 2011 to a pro-forma estimate of 10% (Slide 11).
- Revenue reached a peak of over $70 million in 2011, though the first six months of 2012 showed a slight cooling compared to that peak (Slide 13).
- Recent financing includes a $50 million line of credit and $15.7 million in debt and equity raised between Dec 2011 and June 2012 (Slide 15).
- The deck omits a specific 'Ask' or valuation for the current round, functioning more as a general investor update or roadshow presentation.
Executive Summary: The Industrial Roll-Up Play
Aveda Transportation and Energy Services (Aveda Energy) presents a deck that is less about 'disruption' and more about 'execution.' In the context of 2012, the North American shale boom was in full swing, and the demand for moving massive drilling rigs was at an all-time high. This deck is designed to convince investors that Aveda is the most professional, best-capitalized vehicle to consolidate a fragmented service market. By leaning heavily on the past success of its founder and the tangible nature of its fleet, the company positions itself as a low-risk, high-upside play on the continued strength of oil prices.
Slide 1: Title and Branding
The cover slide establishes the industrial nature of the business immediately. The imagery of a heavy-duty rig-moving truck on an open highway reinforces the 'Transportation and Energy Services' subtitle. The date, October 2012, places this at the peak of the US domestic energy resurgence.
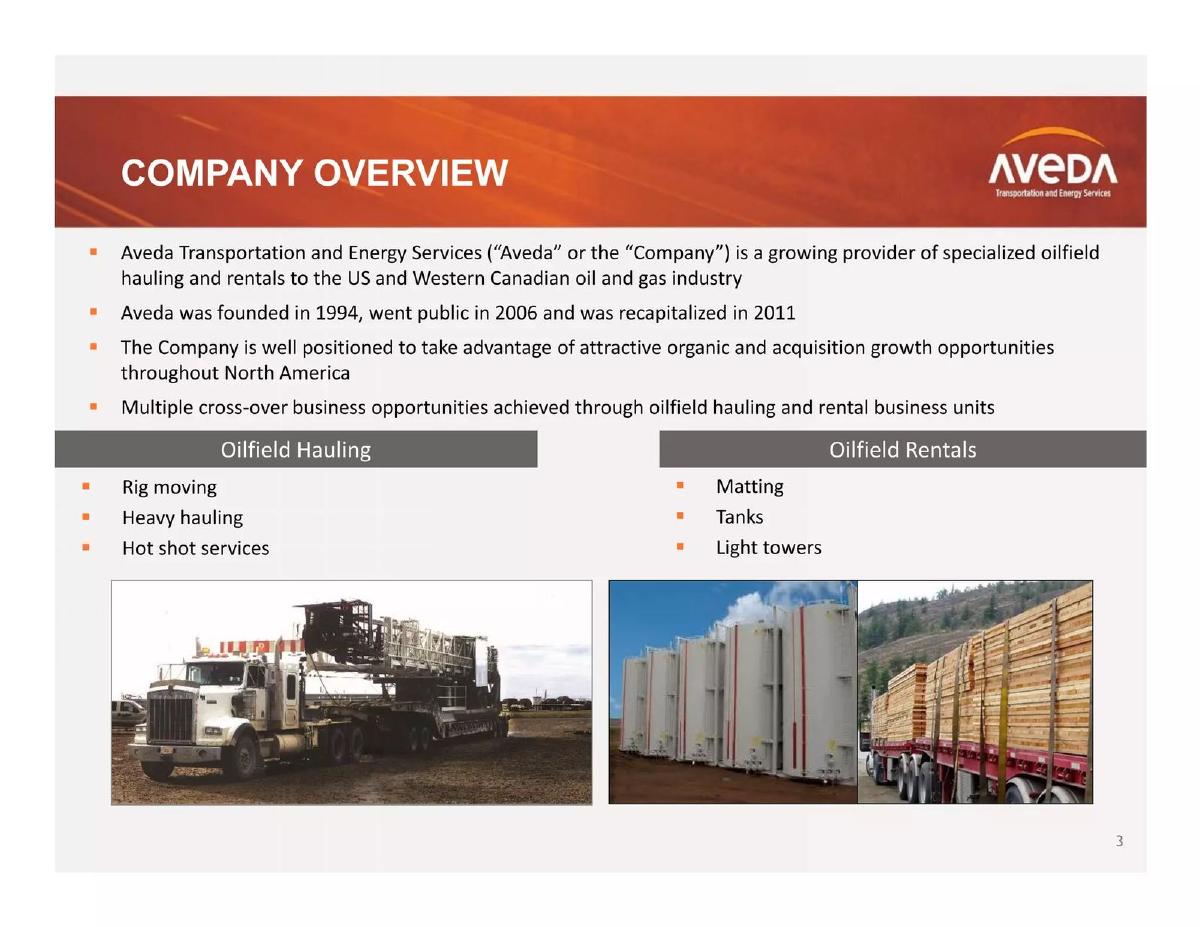
Slide 3: Company Overview
This slide provides the foundational facts. Aveda was founded in 1994, went public in 2006, and was recapitalized in 2011. It defines the two business units: Oilfield Hauling (Rig moving, Heavy hauling, Hot shot services) and Oilfield Rentals (Matting, Tanks, Light towers). The inclusion of photos for both units helps investors visualize the 'hard assets' the company owns. The slide explicitly mentions that the company is positioned for both organic and acquisition growth.
Slide 5: Management Track Record
This is arguably the most important slide in the deck for a mid-stage industrial company. It focuses on David Werklund , the founder of CCS Corporation. The slide highlights a 24% CAGR and a 2,490% total return over 15 years at his previous venture. A table lists 18 historical acquisitions totaling $402.5 million in enterprise value. This slide isn't just about Aveda; it is a 'trust us' signal to investors, proving that the leadership knows how to buy, integrate, and sell companies in this specific sector.
Slide 7: Oilfield Hauling Market
Aveda uses a map of North America to show the distribution of active rigs. They cite a North American Active Land Rig Count of 2,154 for 2012. The key metric provided is that each rig moves approximately 1.4 times per month or 17 times per year , resulting in an estimated 42,500 total moves available in the market. This quantifies the Total Addressable Market (TAM) in terms of service events rather than just dollars, which is a highly effective way to demonstrate demand for a logistics business.
Slide 9: Oilfield Hauling Overview
This slide details the operational capacity. The company reports a modern fleet of 469 pieces of equipment , including 142 power units. They employ 238 people, with 143 of them being operators. A bar chart shows the growth of the fleet from 2011 to 2012, highlighting the addition of trailers and winch tractors. Perhaps most importantly, it lists a 'Blue Chip Customer Base' including Cenovus, Encana, Shell, and ConocoPhillips , which serves as significant social proof.
Slide 11: Oilfield Rentals Overview
The rental division is presented as a high-margin complement to the hauling business. It contributed 5% of revenue in 2011, with a pro-forma estimate of 10% following new acquisitions. The fleet consists of 750 pieces of equipment , primarily rig mats and tanks. The slide also notes that they target acquisition multiples of 1.5x to 3.2x TTM EBITDA , which suggests a very disciplined and potentially lucrative acquisition strategy.
Slide 13: Financial Performance: Revenue
Revenue trends are shown from 2007 through the first half of 2012. The company saw a massive spike in 2011, reaching over $70 million . The first six months of 2012 generated roughly $35 million, with a small 'pro-forma' bump for recent acquisitions. A pie chart shows a perfect 50/50 revenue split between the U.S. and Canada , demonstrating successful geographic diversification.
Slide 15: Recent Achievements
This slide focuses on capitalization and expansion. Aveda secured $66 million in financing , including a $50 million line of credit. It also notes the opening of new branches in the Eagle Ford Shale and Permian Basin , the two most productive oil fields in the US at the time. Interestingly, it also mentions closing underperforming offices in Grand Prairie and Melita, which shows management's willingness to cut losses and optimize the footprint.
Slide 17: Investment Highlights
The deck concludes with a summary of the value proposition: a proven management team, solid industry fundamentals (strong oil prices), and significant growth opportunities through both organic expansion and acquisitions. It is a standard but effective wrap-up of the preceding data points.
What Aveda Energy Does Well
The deck is exceptionally strong at quantifying the opportunity . Instead of vague statements about 'big markets,' they provide the exact number of rigs and the frequency of moves required per rig. This allows an investor to build their own model based on Aveda's fleet size and market share. Furthermore, the focus on Management Track Record (Slide 5) is a masterclass in building credibility for a roll-up strategy. By showing the specific acquisitions and returns of the founder's previous company, they reduce the perceived risk of their future acquisition plans.
What is Missing from the Deck
The most glaring omission is a detailed breakdown of margins and EBITDA . While they mention acquisition multiples based on EBITDA, they do not show their own EBITDA margins or net income. For a capital-intensive business with $66 million in debt/credit, understanding the cash flow and debt-service coverage is critical. Additionally, there is no specific 'Ask' on the final slides. It is unclear if they are looking for a specific amount of equity investment, a new debt partner, or if this is simply a general update for existing public shareholders.
What Other Founders Should Copy
Founders in service-based or asset-heavy industries should copy Aveda's 'Blue Chip Customer Base' visualization (Slide 9 and 11). Grouping logos of recognizable, massive corporations provides immediate legitimacy that words cannot. Furthermore, the Market Quantification on Slide 7 is a great template; if your business relies on a specific activity (like moving a rig), find the data for how often that activity happens and map it geographically. This makes your growth plan look like a logical geographic expansion rather than a series of guesses.
Frequently asked questions
- What is Aveda Energy's primary business model?
- Aveda Energy operates as a specialized provider for the oil and gas industry in the US and Western Canada. Their business is bifurcated into Oilfield Hauling (rig moving, heavy hauling, and hot shot services) and Oilfield Rentals (matting, tanks, and light towers). They focus on high-utilization equipment and 'blue chip' customer relationships to drive recurring service revenue.
- How does the company justify its expansion strategy?
- The company relies on the 'Management Track Record' slide, which details the founder's history of consolidating oilfield services. By showing a list of 18 historical acquisitions made by the founder's previous company, CCS Corporation, Aveda signals to investors that they have the expertise to execute a similar roll-up strategy in the currently fragmented hauling and rental markets.
- What are the key market drivers mentioned in the deck?
- The deck identifies the active land rig count as the primary driver. As of 2012, there were 2,154 active rigs in North America. Aveda targets 'oil/liquid rich weighted basins' such as the Permian, Eagle Ford, and Bakken, noting that each rig requires approximately 1.4 moves per month, creating constant demand for hauling services.
- What does the financial data reveal about the company's health in 2012?
- The company was in a high-growth phase, reporting 81% revenue growth in 2011 compared to 2010. While 2011 was a standout year with over $70 million in revenue, the first half of 2012 generated roughly $35 million, suggesting a steady but perhaps less explosive trajectory. They also secured $66 million in total financing to support this scale.
- Who are Aveda's main competitors and customers?
- Slide 9 identifies primary competitors as TransForce, Mullen, Flint, and regional specialty haulers. Their customer base is impressive, featuring industry giants like Cenovus, Encana, Talisman, Shell, Apache, and ConocoPhillips. This 'blue chip' list is used to validate the company's service quality and reliability in a high-stakes industry.