Gaming Traction Slides: 6 Real Pitch Deck Examples
How game startups show traction: day 1 to day 30 retention with install cost and payer conversion, a launch-day spike, paying studio clients.
Gaming Traction Slides: Real Pitch Deck Examples
Six traction slides from gaming decks (a social slots game, a selfie voting game, an AI tool for game studios, two indie studios and an esports coaching platform), shown in full. Game investors ask one question first: do players come back and pay? Download and launch numbers show that people tried a game; retention by day and payer conversion show whether it can earn more than it costs to acquire players. The stronger slides give those rates; the weaker ones give downloads, awards or no numbers at all.
TL;DR
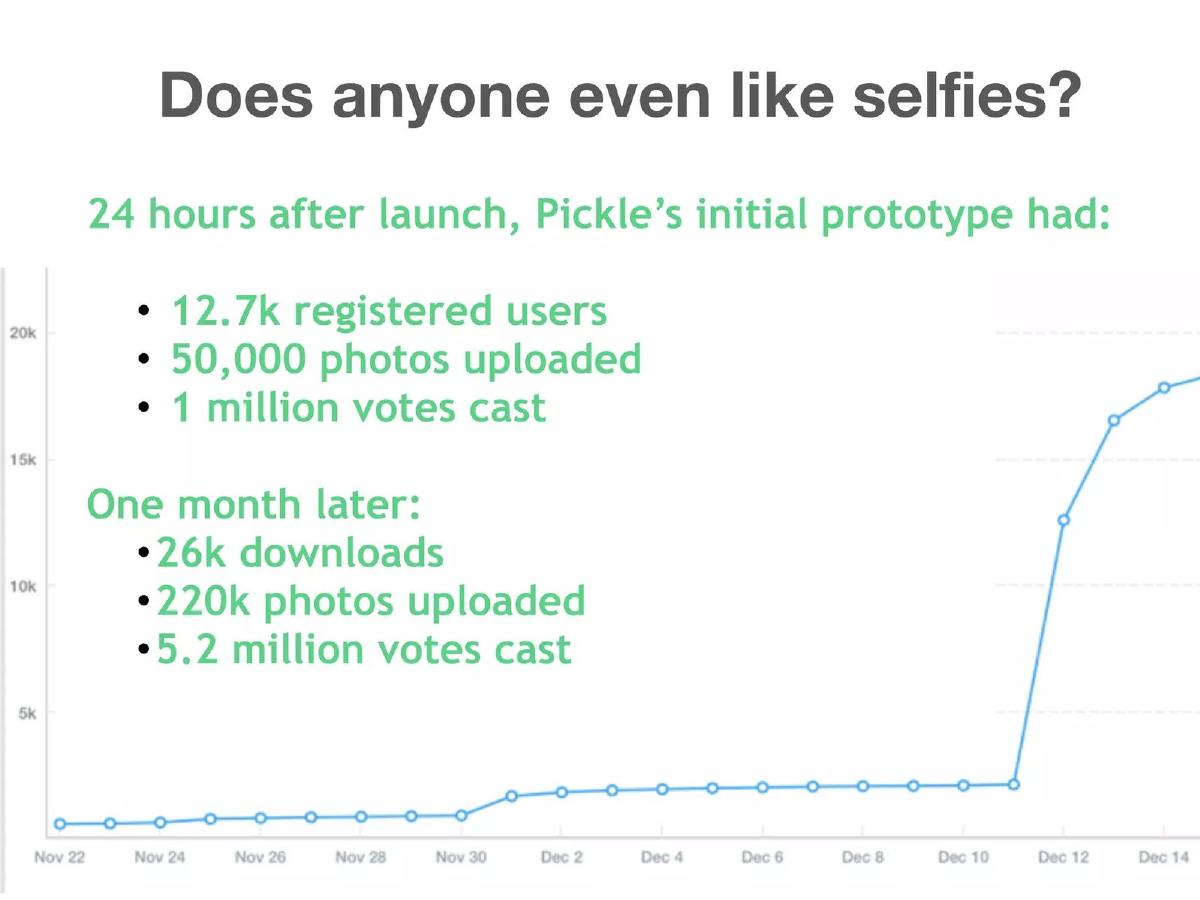
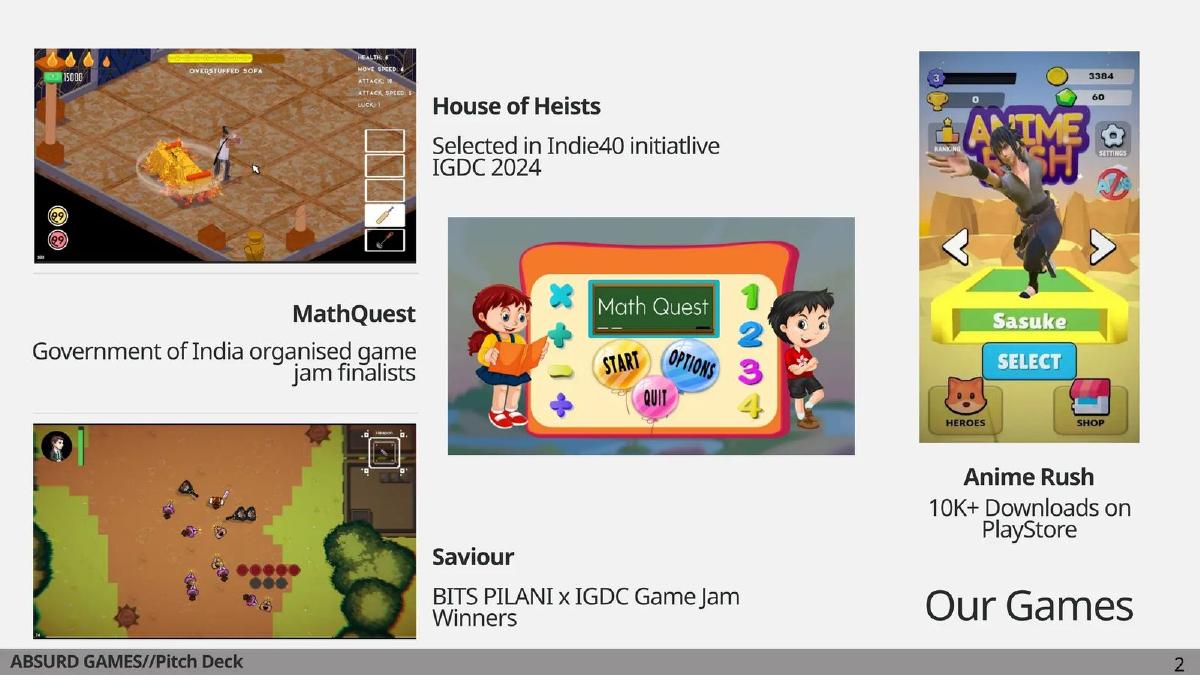
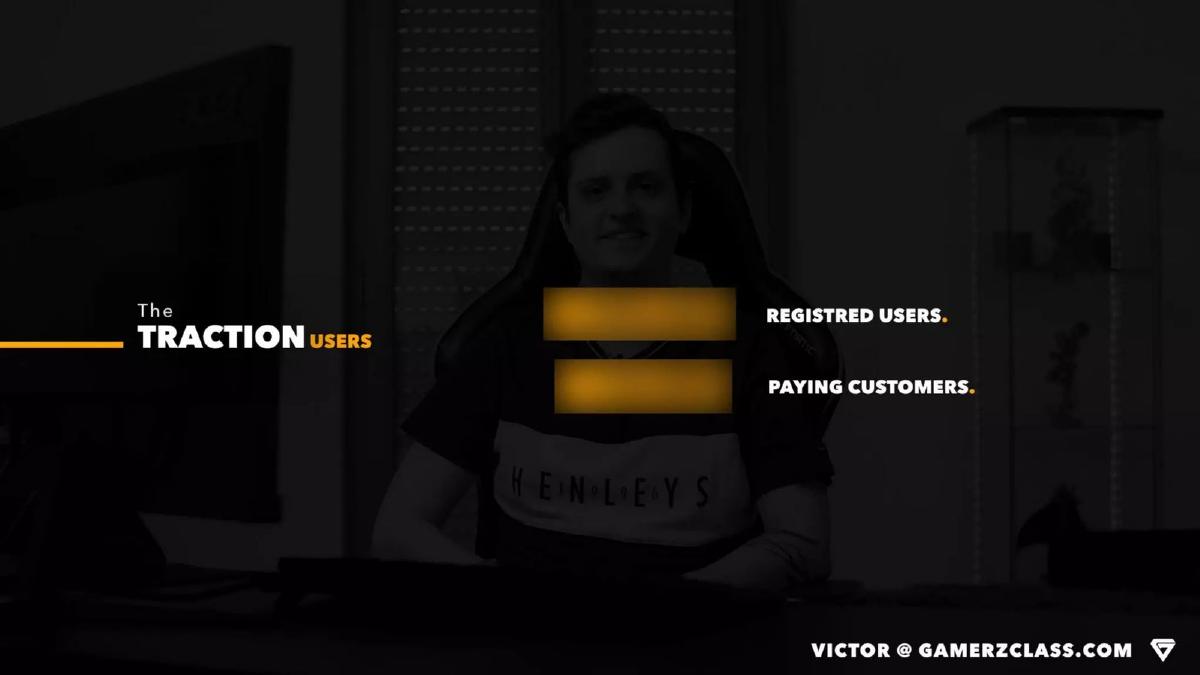
A gaming traction slide should show retention and monetization, not only downloads. TouchSpin lists install cost, organic share, day 1, 7, 14 and 30 retention and player-to-payer conversion. Pickle shows users, photos and votes 24 hours and one month after launch, with a daily chart, but no retention. Incymo counts 4 paying studio clients and names three. Absurd Games gives 10K+ downloads for one game and jam awards for others. Joyixir says a game outperformed competitors with no figure. GamerzClass hides both its user and paying-customer numbers, the weakest example here.
Gaming traction slides
Each example shows the exact stored slide above its analysis and links to the full teardown. Stronger examples first. Claims and figures are as shown on the slides; we have not verified them.
TouchSpin Gaming traction slide — slide 5
Stage not recorded. Social slots game ("Powerup Your Slots"). A tablet screenshot beside a checklist.
TouchSpin Gaming deck, slide 5. Exact stored slide matched to this analysis.
Our analysis: The most complete slide here: it gives the rates a game investor uses to judge whether players are worth what they cost. Without player numbers or revenue per payer, payback still cannot be worked out.
Evidence and limitation: Install cost, organic share, invite rate, a four-point retention curve and payer conversion; no player count, revenue or spend per payer, and no date range.
What a founder can adapt: Keep the curve and install cost, and add installs to date, revenue per paying player and the period measured.
Supporting analysis
What the deck claims: "Recent KPIs." "The fine tuning to date has been without any CRM activity." "Avg. targeted Facebook installation - $2.30." "40% of downloads are - Organic." "More than 25% of players - Invite Friends." "One Day Retention – 38%." "Seven Day Retention – 22.5%." "Fourteen Day Retention – 11.5%." "Thirty Day Retention – 6.5%." "Player to Payer Conversion – 1%."
Presentation choice: Retention by day and payer conversion show whether a game keeps and monetizes players, which downloads alone cannot.
When it does not fit: Rates with no base; say how many installs they come from.
Seed (recorded). Competitive selfie voting app. Text over a daily line chart, 22 November to 14 December.
Pickle deck, slide 3. Exact stored slide matched to this analysis.
Our analysis: Photos and votes per user show real engagement, and the two time points show growth. The chart has no label, and 12.7k registered users on day one sits oddly beside 26k downloads a month later.
Evidence and limitation: Users, uploads and votes at day one and one month, plus an unlabelled daily chart; no active users or retention.
What a founder can adapt: Label the chart, and add daily active users and day 7 retention for the month shown.
Supporting analysis
What the deck claims: "Does anyone even like selfies?" "24 hours after launch, Pickle's initial prototype had: 12.7k registered users, 50,000 photos uploaded, 1 million votes cast." "One month later: 26k downloads, 220k photos uploaded, 5.2 million votes cast." The chart has no title or axis label; it rises from under 1k to about 18k after 11 December.
Presentation choice: Actions per user (votes, uploads) are a better early signal than sign-ups because they show players doing the core loop.
When it does not fit: An unlabelled chart laid under the text; name what it counts.
Seed (recorded). AI tool sold to game studios. Two numbers and three client logos.
Incymo deck, slide 4. Exact stored slide matched to this analysis.
Our analysis: Named studio clients are real buyers, which is traction for a B2B gaming tool. Without revenue or deal size, four clients could mean pilots or paying contracts.
Evidence and limitation: Four clients, three named, and a pipeline figure; no revenue, contract size or year for "since September".
What a founder can adapt: Say whether the four clients pay, give monthly revenue and the year, and define "in the process".
Supporting analysis
What the deck claims: "Strong Traction From the Idea Stage since September." "Scalable validated product." "4 clients." "15+ more in the process." Logos: SayGames, Eidolon, AdQuantum.
Presentation choice: For tools sold to studios, paying clients matter more than player metrics; names let investors check.
When it does not fit: "Validated product" as a label with no figure behind it.
Stage not recorded. Indie game studio in India. Four game screenshots with one line each.
Absurd Games deck, slide 3. Exact stored slide matched to this analysis.
Our analysis: A portfolio slide more than a traction slide: only one line measures players. The awards show the team can ship games, not that players stay.
Evidence and limitation: One download total for one game and three selections or awards; no retention, revenue or dates for the downloads.
What a founder can adapt: Add day 1 and day 7 retention and monthly active players for Anime Rush, and move awards to the team slide.
Supporting analysis
What the deck claims: "Our Games." House of Heists: "Selected in Indie40 initiatlive IGDC 2024." MathQuest: "Government of India organised game jam finalists." Saviour: "BITS PILANI x IGDC Game Jam Winners." Anime Rush: "10K+ Downloads on PlayStore."
Presentation choice: Included to show the gap between recognition and player numbers; an early studio needs at least one retention figure.
When it does not fit: Letting jam awards stand in for player data.
Stage not recorded. Indie game studio in Iran. A two-game timeline, 2017 and 2019.
Joyixir deck, slide 6. Exact stored slide matched to this analysis.
Our analysis: "Outperformed all the competitors" is the only traction on the slide, and it gives no measure, date or source to check.
Evidence and limitation: One comparative claim with no figure or source; the second game has a description only.
What a founder can adapt: Replace the claim with downloads, rank or revenue for World of Words, with the store and date.
Supporting analysis
What the deck claims: "Project Timeline." "Our Experience." 2017, World of Words: "World of Words is a multilingual word game. It outperformed all the competitors in the Iranian market." 2019, 4Wheelers: "4Wheelers is an online a mobile game with original the core gameplay and art style. Players compete with different cars in online realtime races."
Presentation choice: Included for contrast: a claim of market leadership needs the number that supports it.
When it does not fit: Comparative claims with no measure.
Seed (recorded). Esports coaching platform. Two figures covered by blurred bars over a photo.
GamerzClass deck, slide 4. Exact stored slide matched to this analysis.
Our analysis: The weakest example here. The labels are the right two measures, users and paying customers, but the numbers are not visible in the version we hold.
Evidence and limitation: Two labels with hidden values; nothing an investor can read.
What a founder can adapt: Show the paying-customer count and conversion from registered users, or state that figures are shared on request.
Supporting analysis
What the deck claims: "The Traction users." "Registred users." "Paying customers." Both numbers are hidden by blurred bars in the stored image.
Presentation choice: Included to show that the right labels do not help without figures; if numbers must be withheld, say so.
When it does not fit: Blurred numbers with no explanation.
Whether each slide gives player counts, retention, monetization and a time axis.
Example
Business
Players or users
Retention
Monetization
Time axis
TouchSpin
Social slots game
No count
Day 1, 7, 14, 30
1% payer conversion, $2.30 install cost
No
Pickle
Selfie voting game
12.7k users, 26k downloads
No
No
Day one and one month
Incymo
Tool for studios
4 clients
No
Not stated
"Since September"
Absurd Games
Indie studio
10K+ downloads (one game)
No
No
No
Joyixir
Indie studio
No
No
No
2017 and 2019
GamerzClass
Esports coaching
Hidden
No
Hidden
No
Key Takeaways
Give day 1, day 7 and day 30 retention.
Pair install cost with payer conversion so investors can judge payback.
Show downloads over time, not a single total.
Treat awards and jam wins as support, not traction.
Build your gaming traction slide
Show that players return and pay, and what each costs to acquire.
Players. Installs and monthly active players, by month.
Retention. Day 1, day 7 and day 30 retention, with the install base measured.
Money. Payer conversion, revenue per paying player and install cost.
B2B. For tools sold to studios: paying clients by name and monthly revenue.
Copyable framework: [n] installs since [month], [n] monthly active players. Day 1 [x]%, day 7 [x]%, day 30 [x]%. [x]% of players pay, [amount] per payer; install cost [amount].
Illustrative example 1 — written by us
Before: World of Words outperformed all the competitors in the Iranian market.
After: World of Words: [n] downloads on [store] by [month year], ranked #[n] in [category]; day 7 retention [x]%.
What improved: Our illustrative rewrite; not Joyixir's wording. Bracketed parts are placeholders to fill with real facts. It replaces the claim with figures an investor can check.
What this guide adds
The library has gaming problem, solution, market, business model and product guides, but no gaming traction guide. This page covers what counts as traction for games: retention curves, install cost, conversion to paying players, and for studios selling to other studios, paying clients.
Sector labels come from the sector recorded for each published teardown (high confidence for Absurd Games, Joyixir and GamerzClass; medium for TouchSpin, Pickle and Incymo). None of these six slides appears in another guide.
Three ways gaming decks show traction
Retention and monetization (TouchSpin): how many players return after 1, 7, 14 and 30 days, and how many pay.
Launch and download counts (Pickle, Absurd Games): how many people tried the game, sometimes with a chart over time.
Clients, claims and hidden numbers (Incymo, Joyixir, GamerzClass): paying studios for a B2B tool, or claims that give an investor nothing to check.
Common mistakes
Downloads without retention. Add how many players return after 1, 7 and 30 days.
Rates without a base. State the number of installs the percentages come from.
Awards as traction. Jam wins and selections belong on the team slide.
Hidden or unmeasured claims. Give a figure, or say plainly that it is shared on request.
Diagnostic checklist
Installs and monthly active players over time.
Day 1, 7 and 30 retention.
Payer conversion and install cost.
Paying clients named, for B2B tools.
Frequently asked questions
How we chose these examples
Corpus: published pitch deck teardowns on StartupFundraising.com. Founder-uploaded private decks are excluded.
Selection (2026-09-27): we took teardowns whose recorded sector is gaming, with slide text about traction, downloads, installs, players, retention, revenue or users. We read the candidates and viewed seven slide images, left out market-size slides, slides already used in other guides, a second Pickle slide, a comparable game's downloads (Ingyre), public-company decks (Bragg, theScore) and a slide with no stored image (Playstudios), and kept six. GamerzClass is included as the weakest example for contrast.
Sector is the category recorded for each teardown (high confidence for Absurd Games, Joyixir and GamerzClass; medium for TouchSpin, Pickle and Incymo). Stages as recorded: Pickle, Incymo and GamerzClass, seed; TouchSpin, Absurd Games and Joyixir, not recorded.
Review: stored slide images were checked on 2026-09-27 and matched to company, deck and slide number, and quoted text was read from the images (editorial model review). No person has yet completed an editorial review of this page.
Claims and figures are as shown on the slides; we have not verified them. We make no claim that any slide caused a fundraising outcome.