Tokenomics Slide in a Pitch Deck: 11 Real Examples
How crypto founders show who gets their tokens, when insiders can sell, and what the sale raises.
How to Present Token Allocation and Vesting in a Pitch Deck
Eleven slides from eleven real crypto pitch decks show how founders explain who receives their tokens, when the team and early investors are allowed to sell, and how much the token sale is meant to raise. The strongest slides answer all three questions on one page. The weakest show a pie chart and nothing about timing, and three of the projects here are included as warnings.
TL;DR
A tokenomics slide should answer three questions: who gets what share of the tokens, when each group can sell, and what the sale raises at what price. SwissBorg gives the team's release schedule (10% every six months over four years, forfeited if a member leaves). GameState locks every insider allocation for two years with a daily unlock. Cometa states the seed deal in one line: $1M for 10% of tokens, a one-year lock and one year of vesting. Uptota shows the value of tokens on the market at launch ($4.29M) beside the value of the full supply ($45M). AGV Protocol and SolChicks show allocations with little or no timing, and JSEcoin's sale cap was far above what it raised. Figures are the projects' own claims; nothing here is investment advice.
Token allocation and vesting slides from real pitch decks
Each example shows the exact stored slide above its analysis and links to the full teardown. Stage and year are given only where the deck or public records state them. Figures are the projects' own claims, and none of this is investment advice.
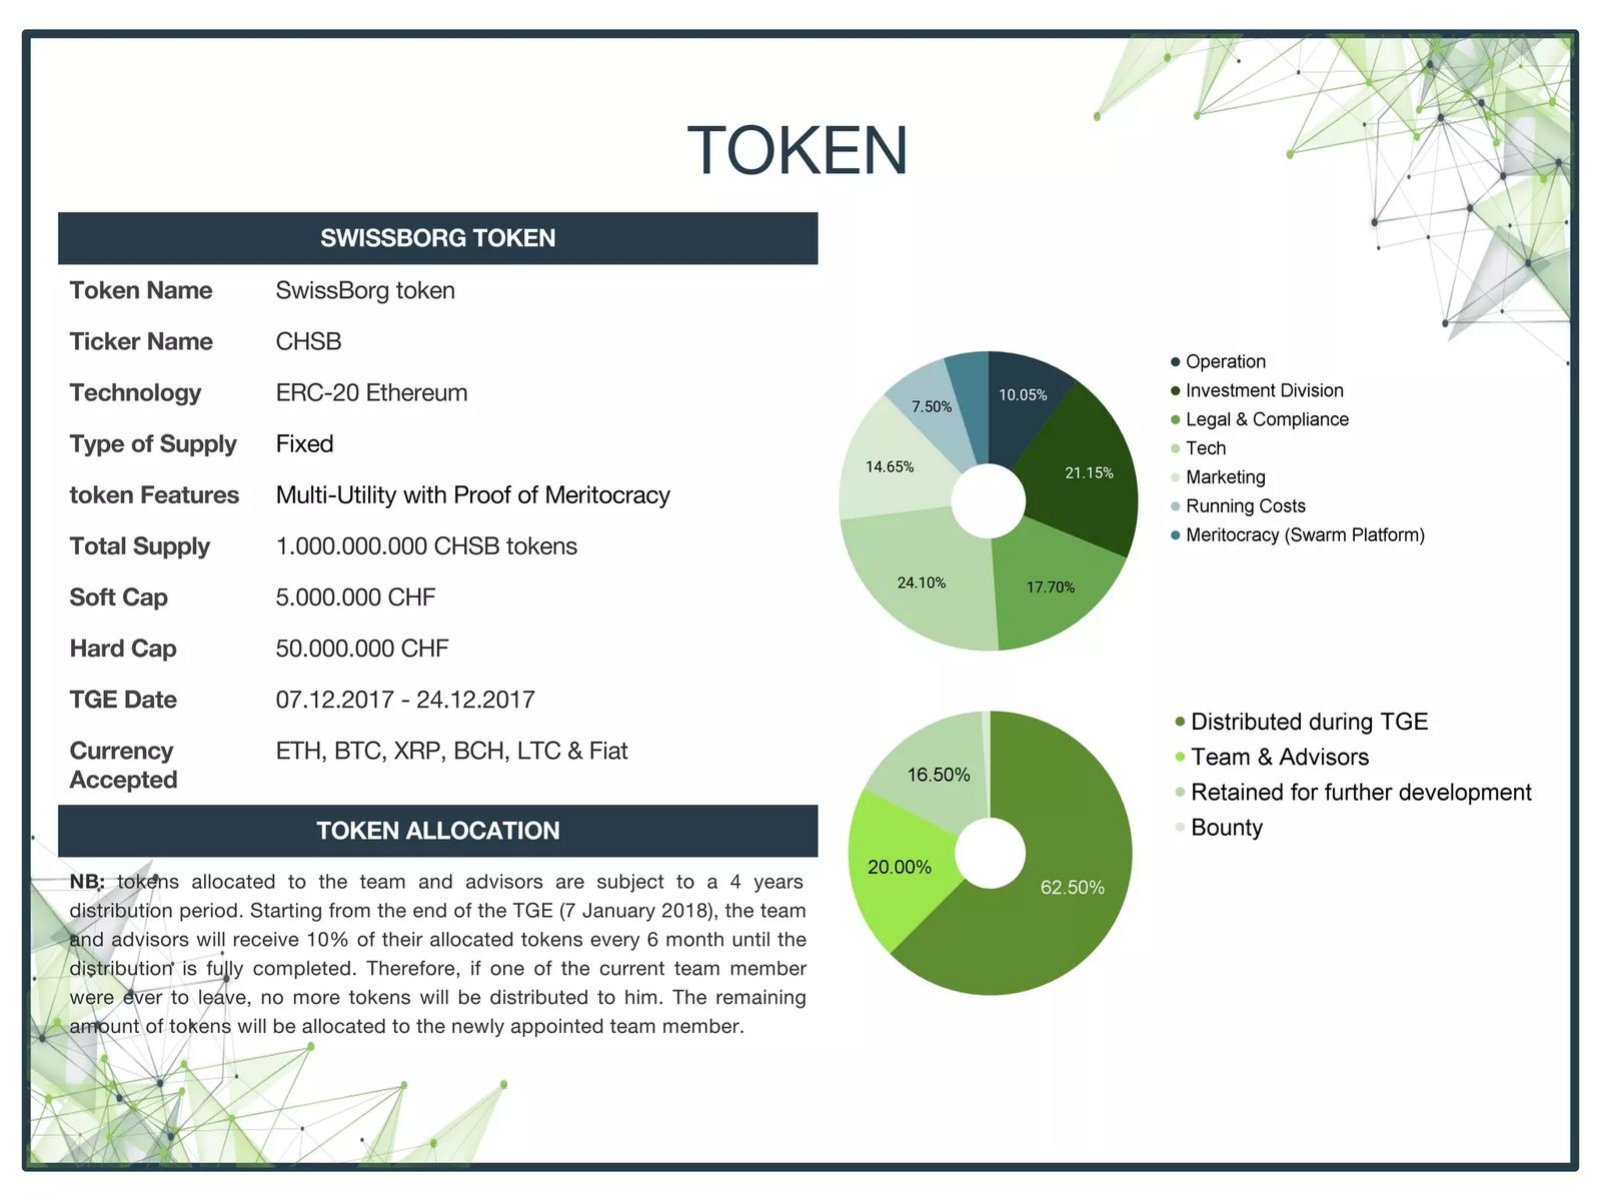
SwissBorg ask slide — slide 13
Crypto investing app, Switzerland; 2017 token sale. The CHSB token was swapped one-for-one for BORG in October 2023.
SwissBorg deck, slide 13. Exact stored slide matched to this analysis.
Our analysis: The only slide here with a forfeiture rule for the team.
Evidence and limitation: A schedule that leaves part of the allocation unexplained.
What a founder can adapt: Make the release steps add up to 100%: eight 10% steps give 80%.
Supporting analysis
What the deck claims: CHSB, fixed supply 1,000,000,000; soft cap CHF 5M, hard cap CHF 50M; sale 7-24 December 2017. Allocation: 62.5% distributed during the sale, 20% team and advisors, 16.5% retained for development, bounty about 1%. Team tokens distributed over 4 years from 7 January 2018, 10% every 6 months; a leaving member receives nothing further.
Presentation choice: The only slide here with a forfeiture rule for the team.
When it does not fit: A schedule that leaves part of the allocation unexplained.
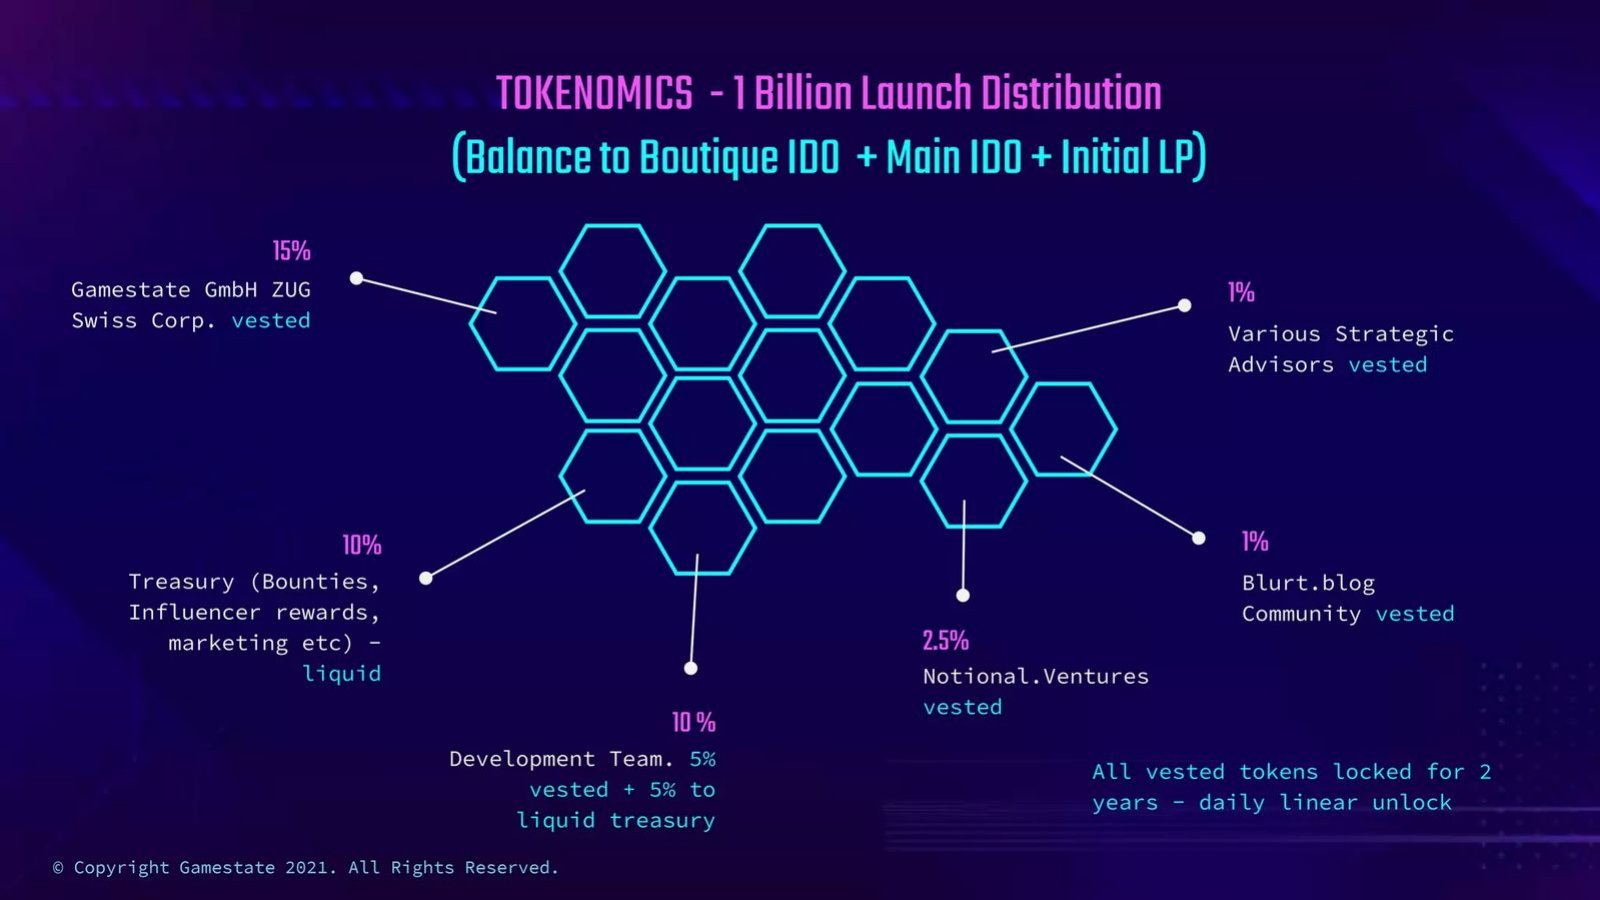
Gaming platform; STATE token launched December 2021 at $0.04.
GameState deck, slide 18. Exact stored slide matched to this analysis.
Our analysis: Each slice is marked locked or liquid, with one clear unlock rule.
Evidence and limitation: Leaving the 60.5% balance as one unlabelled line.
What a founder can adapt: Explain why half the team's share goes to the liquid treasury.
Supporting analysis
What the deck claims: 1 billion launch distribution: company 15% vested, development team 10% (5% vested, 5% to liquid treasury), treasury 10% liquid, a venture partner 2.5% vested, advisors 1% vested, a community 1% vested; balance to sales and liquidity. "All vested tokens locked for 2 years - daily linear unlock."
Presentation choice: Each slice is marked locked or liquid, with one clear unlock rule.
When it does not fit: Leaving the 60.5% balance as one unlabelled line.
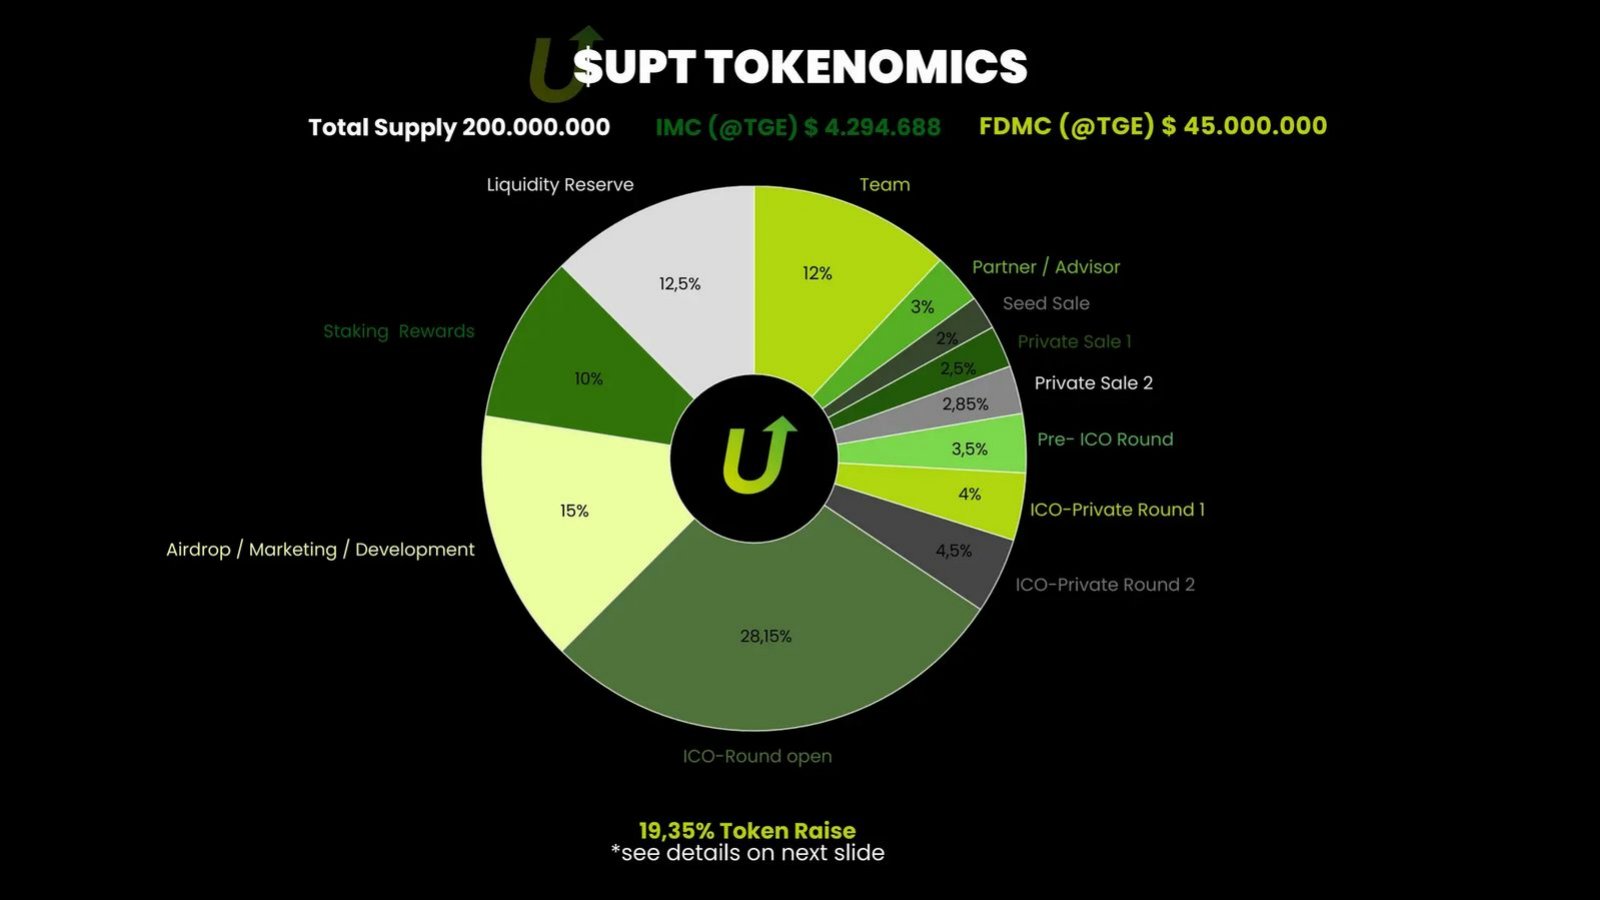
Crypto exchange and payments for Africa; token planned for 2024.
Uptota deck, slide 8. Exact stored slide matched to this analysis.
Our analysis: Shows the value tradable at launch beside the value of the full supply.
Evidence and limitation: Quoting only the larger fully diluted figure.
What a founder can adapt: Put the team's lock and vesting on this slide, not only the next.
Supporting analysis
What the deck claims: Total supply 200,000,000; market cap at launch $4,294,688; fully diluted market cap $45,000,000. Open sale 28.15%, airdrop/marketing/development 15%, liquidity reserve 12.5%, team 12%, staking 10%, six pre-launch rounds totalling "19,35% Token Raise".
Presentation choice: Shows the value tradable at launch beside the value of the full supply.
When it does not fit: Quoting only the larger fully diluted figure.
App for finding and buying token sales; sale planned for October 2018.
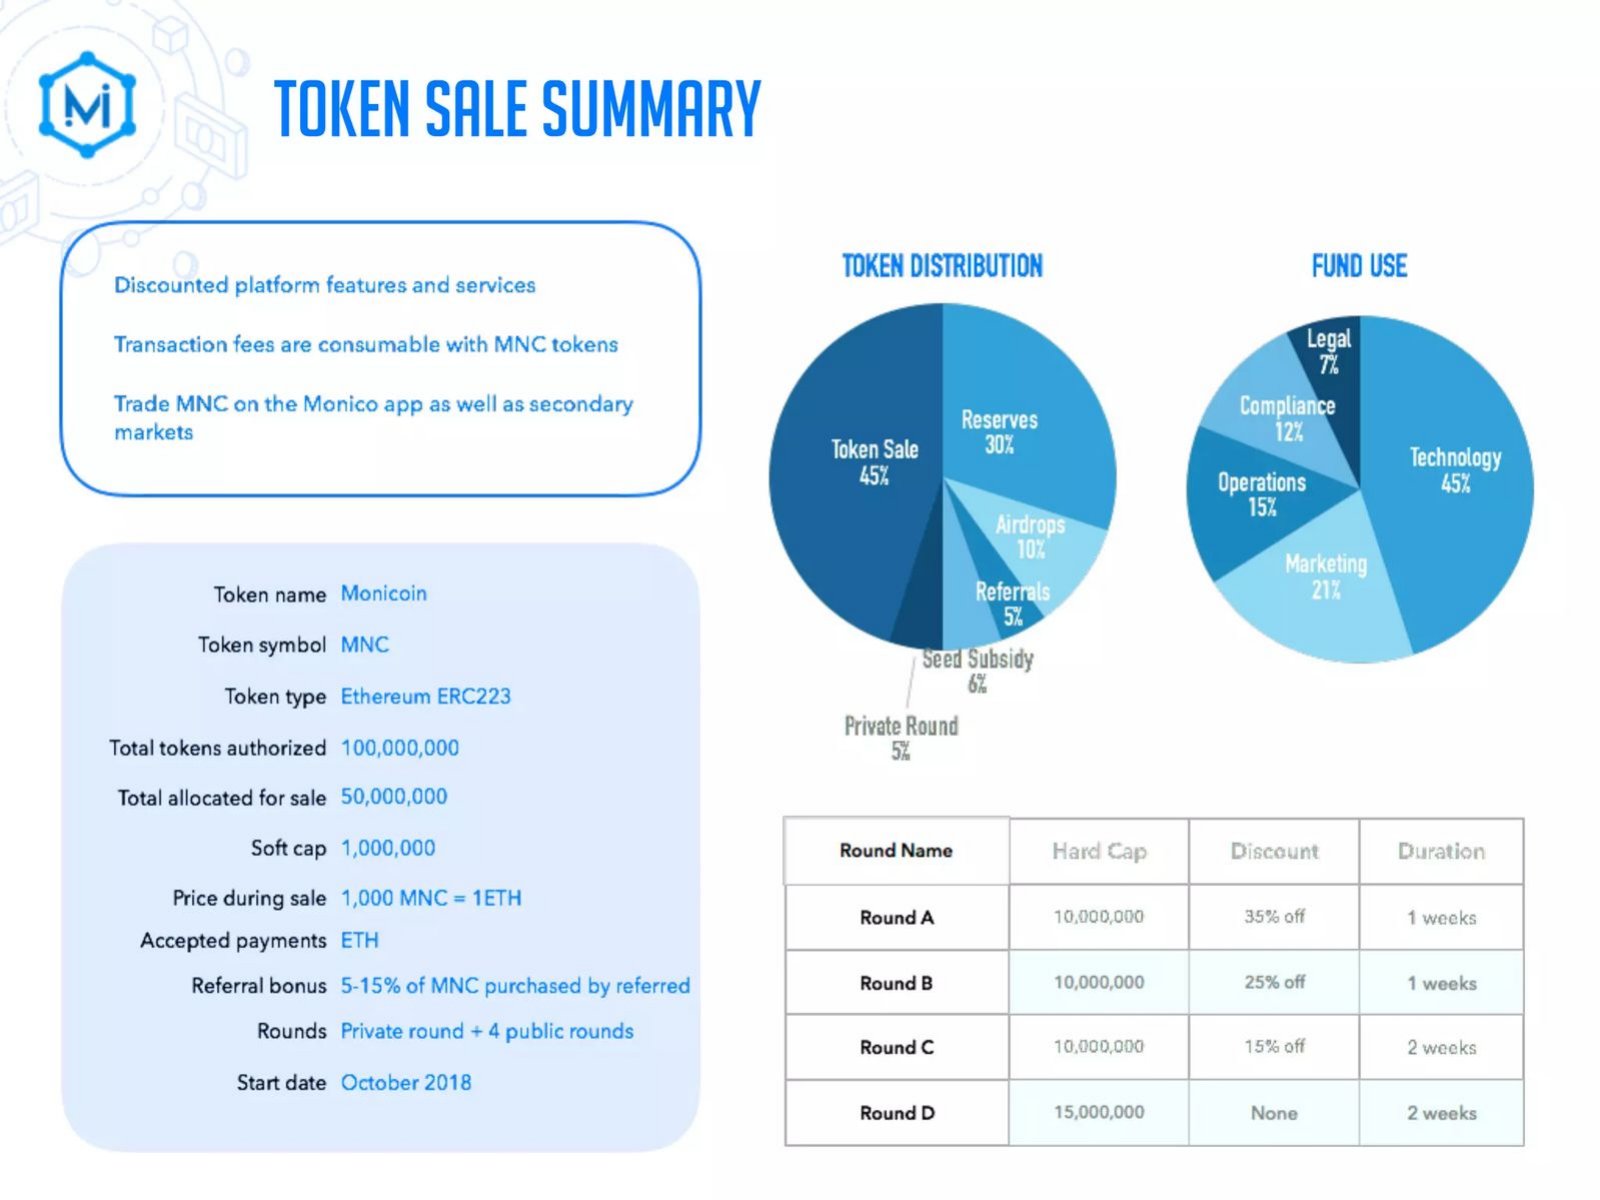
Monico deck, slide 15. Exact stored slide matched to this analysis.
Our analysis: A full round table plus separate token and fund-use charts.
Evidence and limitation: A 30% reserve with no lock.
What a founder can adapt: Add when reserves and the private round can be sold.
Supporting analysis
What the deck claims: 100,000,000 authorised, 50,000,000 for sale at 1,000 MNC per ETH; private round plus Rounds A-D at 35%, 25%, 15% and no discount, caps 10M/10M/10M/15M tokens. Distribution: sale 45%, reserves 30%, airdrops 10%, seed subsidy 6%, private round 5%, referrals 5%. Fund use: technology 45%, marketing 21%.
Presentation choice: A full round table plus separate token and fund-use charts.
Recycling project with a governance token; outcome not found.
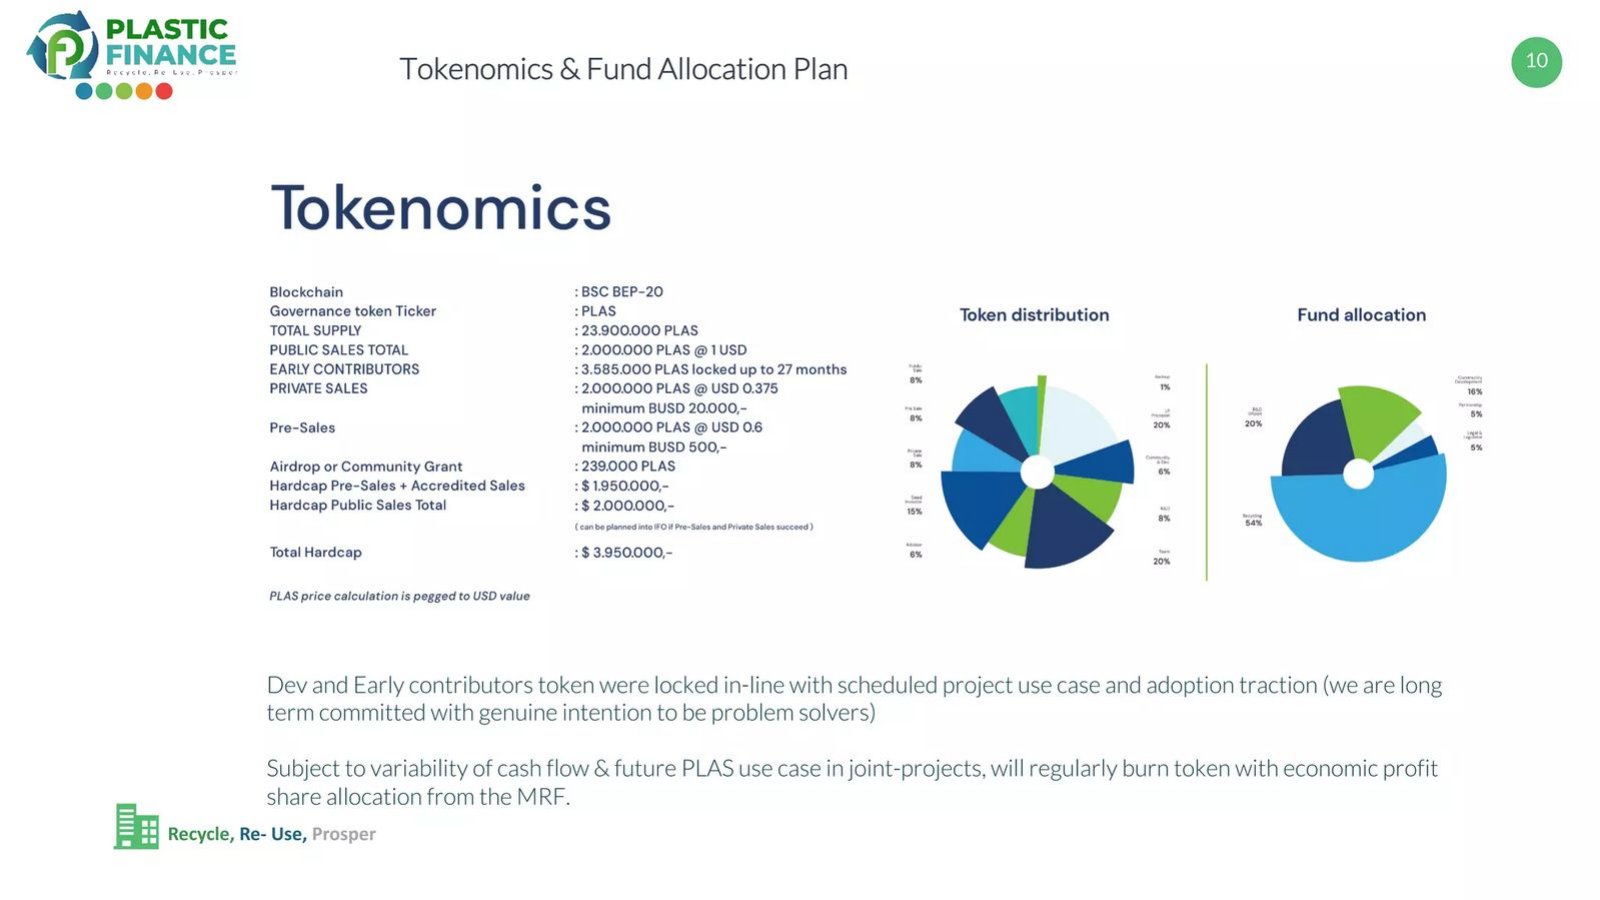
Plastic Finance deck, slide 10. Exact stored slide matched to this analysis.
Our analysis: Prices, quantities and caps multiply out correctly.
Evidence and limitation: Chart labels too small to read.
What a founder can adapt: Say when the early contributor release starts and how fast.
Supporting analysis
What the deck claims: Supply 23,900,000 PLAS; public 2,000,000 at $1; private 2,000,000 at $0.375; pre-sales 2,000,000 at $0.60; early contributors 3,585,000 "locked up to 27 months"; total hard cap $3,950,000.
Presentation choice: Prices, quantities and caps multiply out correctly.
When it does not fit: Chart labels too small to read.
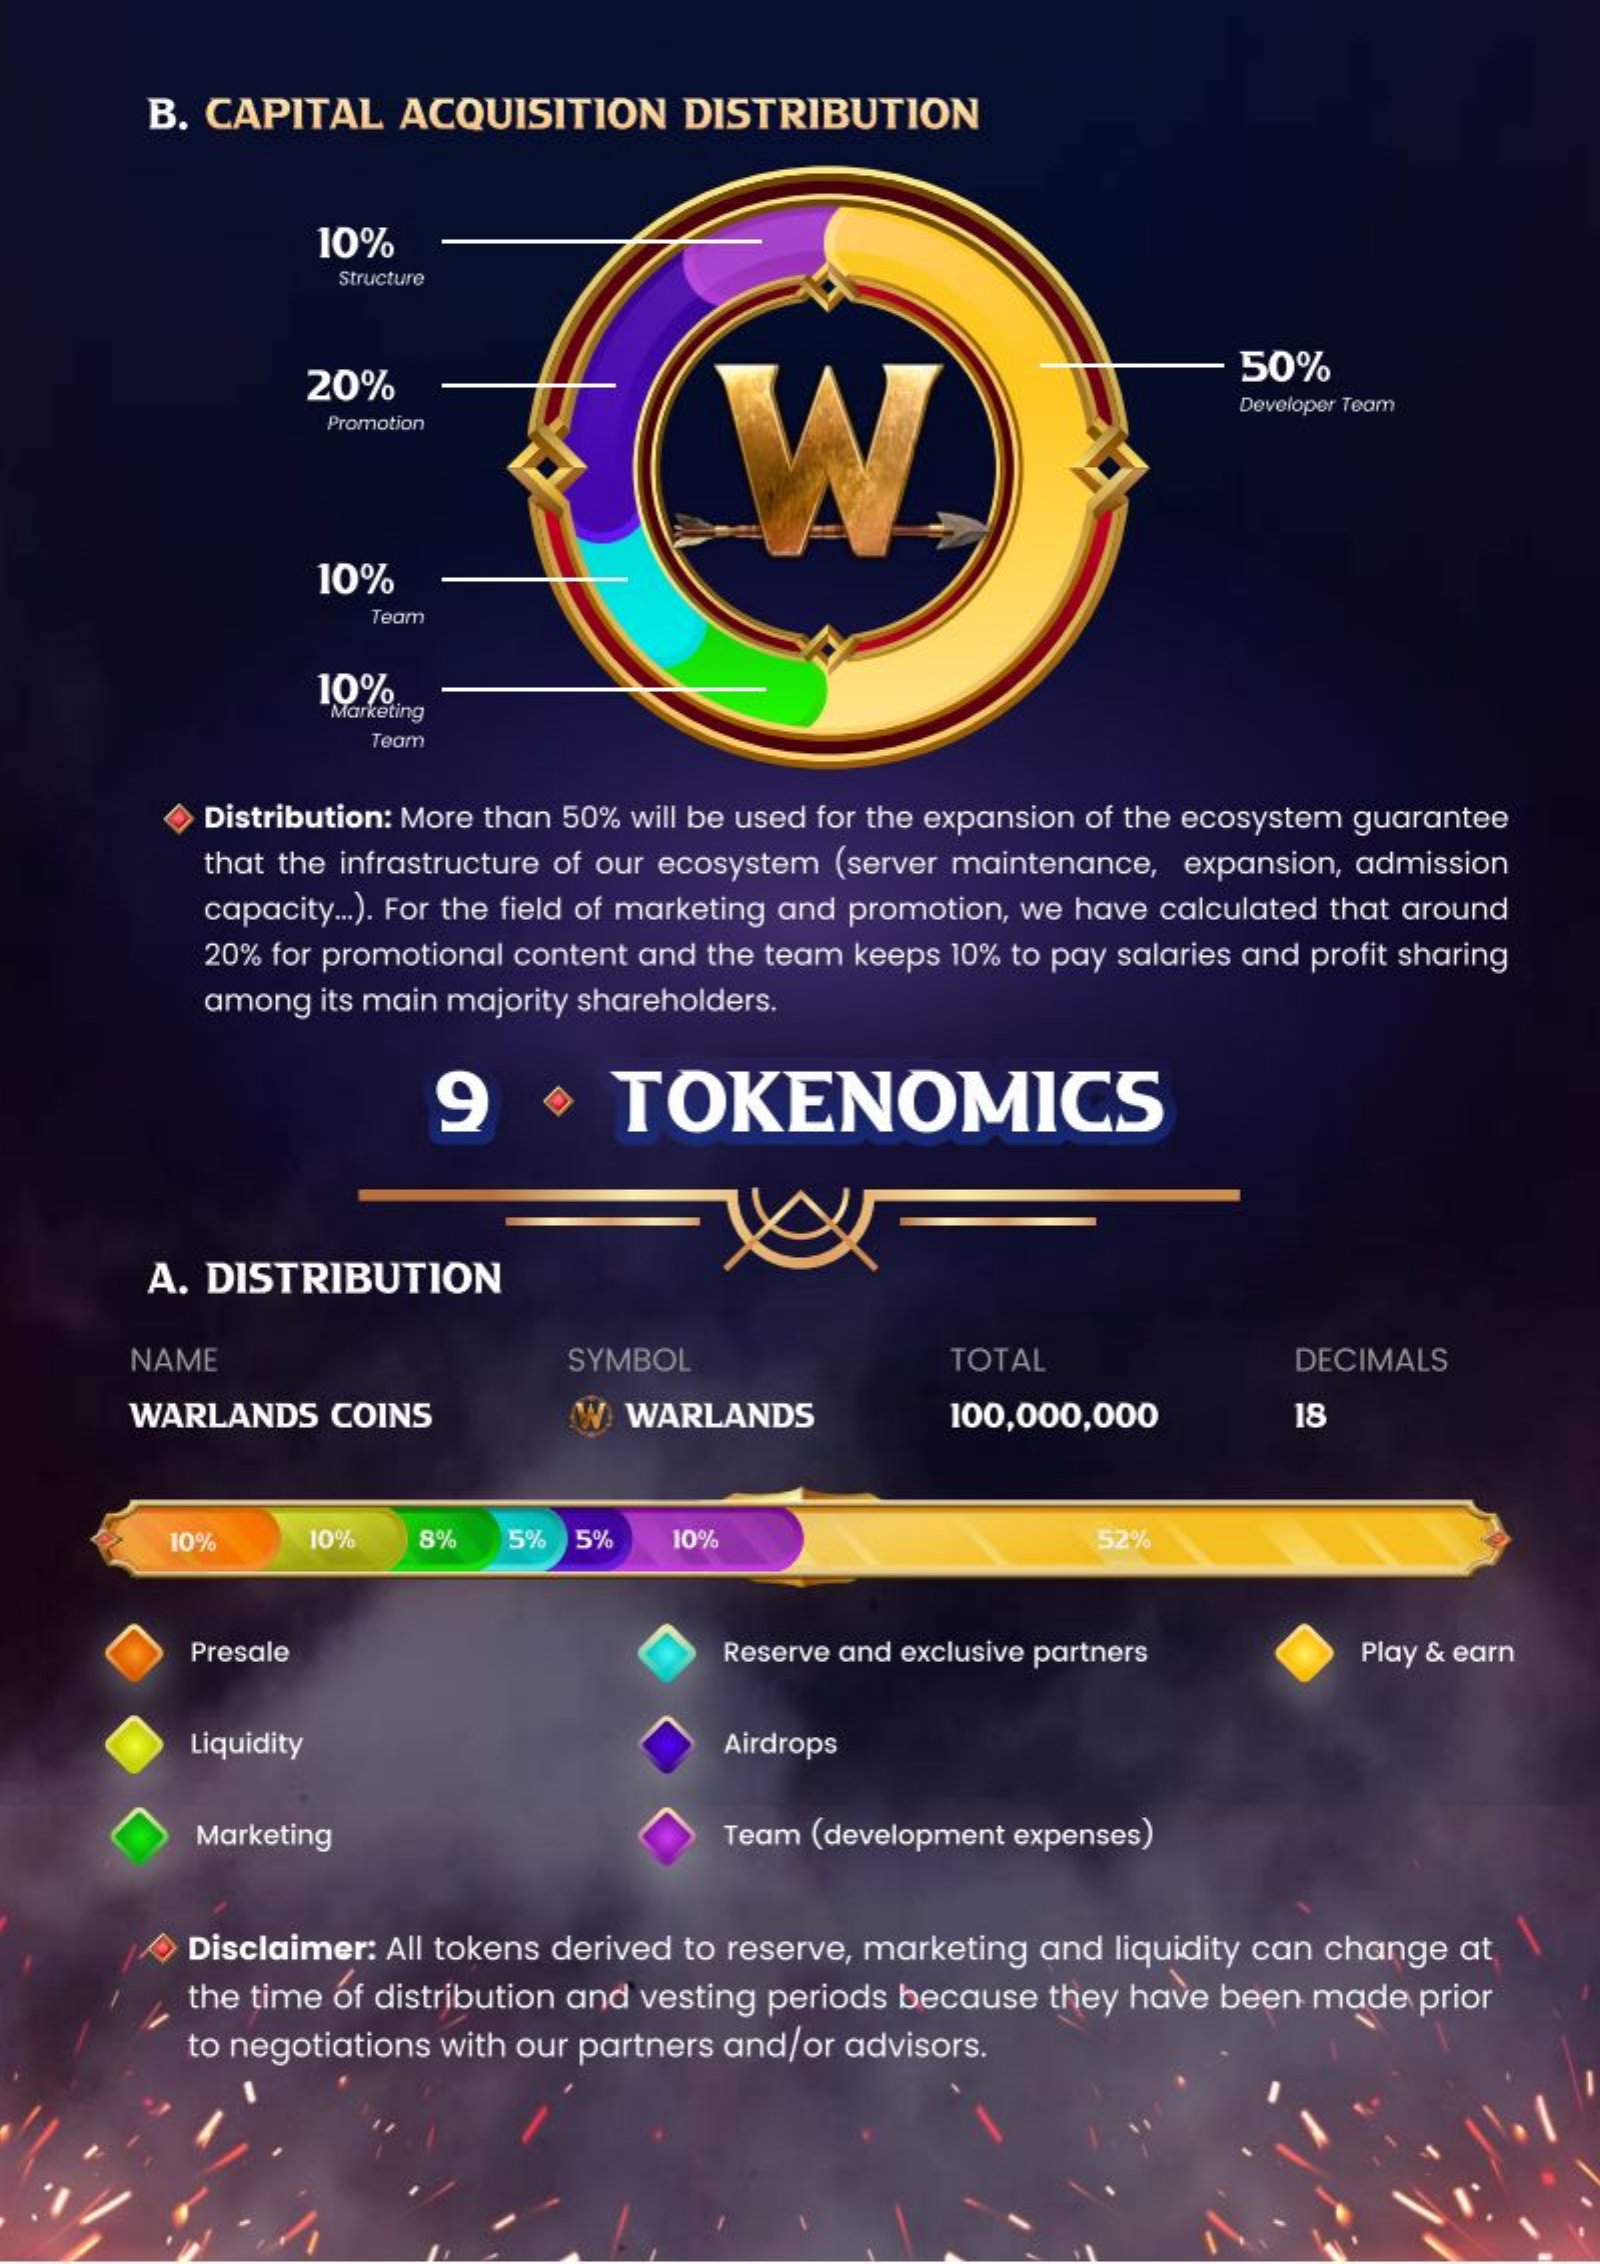
Warlands deck, slide 18. Exact stored slide matched to this analysis.
Our analysis: Two charts on one page are easy to confuse.
Evidence and limitation: Allocations described as subject to change.
What a founder can adapt: Separate the token split from the use of funds.
Supporting analysis
What the deck claims: Money raised: developer team 50%, promotion 20%, structure, team and marketing team 10% each. Tokens (100,000,000): play and earn 52%, presale 10%, liquidity 10%, team 10%, marketing 8%, reserve 5%, airdrops 5%. Disclaimer: reserve, marketing and liquidity allocations may change.
Presentation choice: Two charts on one page are easy to confuse.
When it does not fit: Allocations described as subject to change.
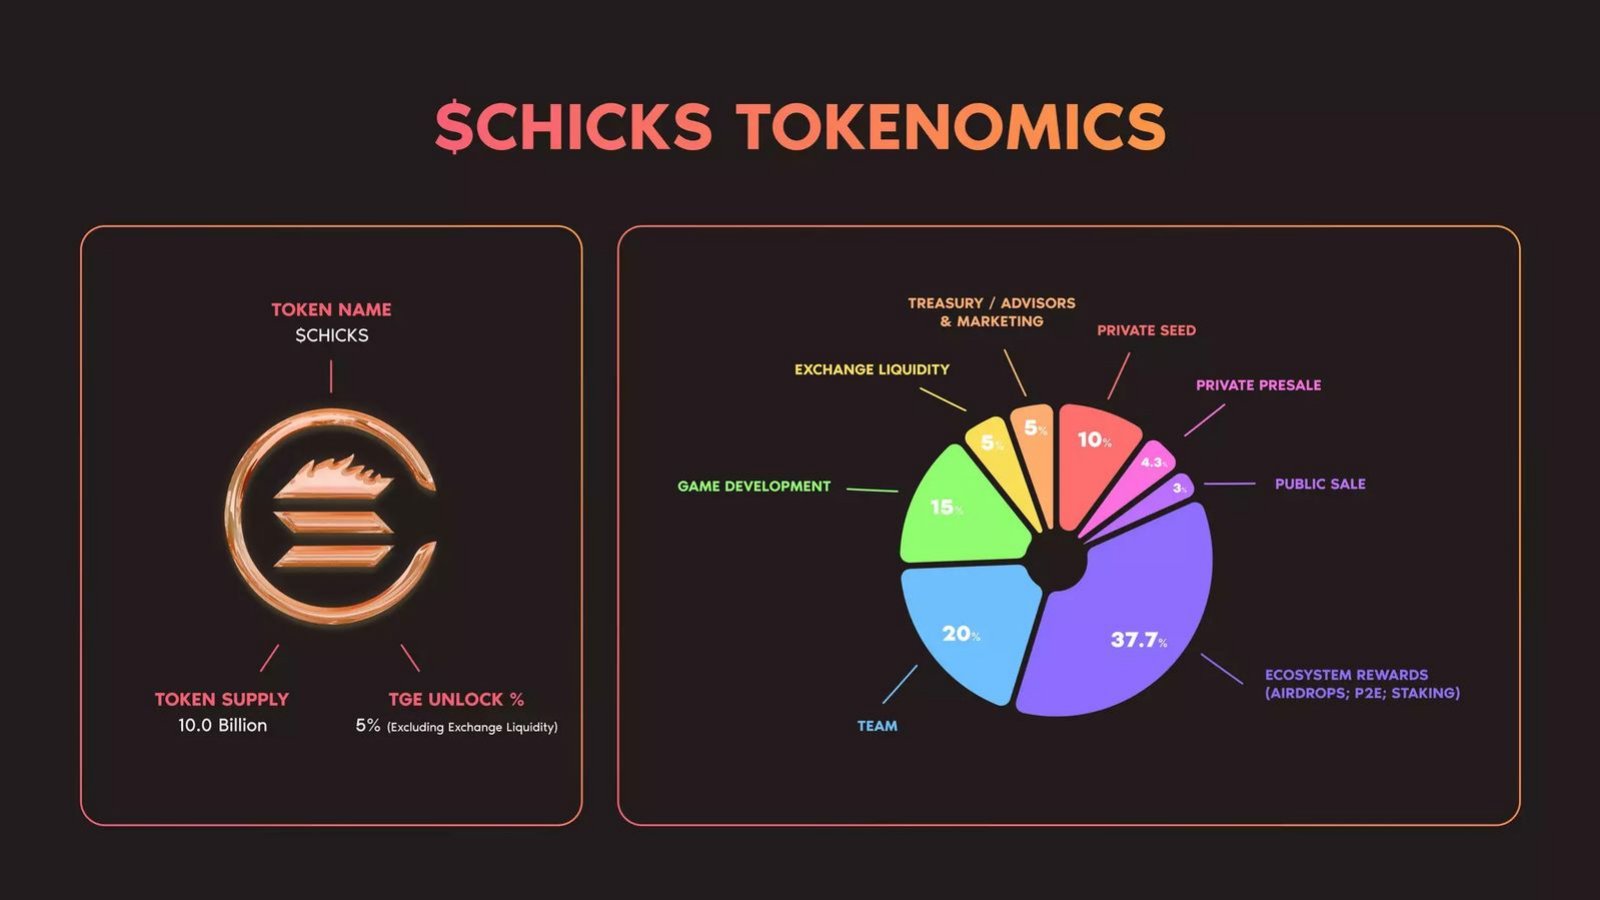
Blockchain game on Solana; launched December 2021. Warning example.
SolChicks deck, slide 21. Exact stored slide matched to this analysis.
Our analysis: Cautionary: a clear chart, but no treasury controls or team schedule.
Evidence and limitation: A launch unlock figure with nothing after it.
What a founder can adapt: Say who controls the treasury and when the team can sell.
Supporting analysis
What the deck claims: 10.0 billion supply; 5% unlocked at launch excluding exchange liquidity. Ecosystem rewards 37.7%, team 20%, game development 15%, private seed 10%, exchange liquidity 5%, treasury/advisors/marketing 5%, private presale 4.3%, public sale 3%.
Presentation choice: Cautionary: a clear chart, but no treasury controls or team schedule.
When it does not fit: A launch unlock figure with nothing after it.
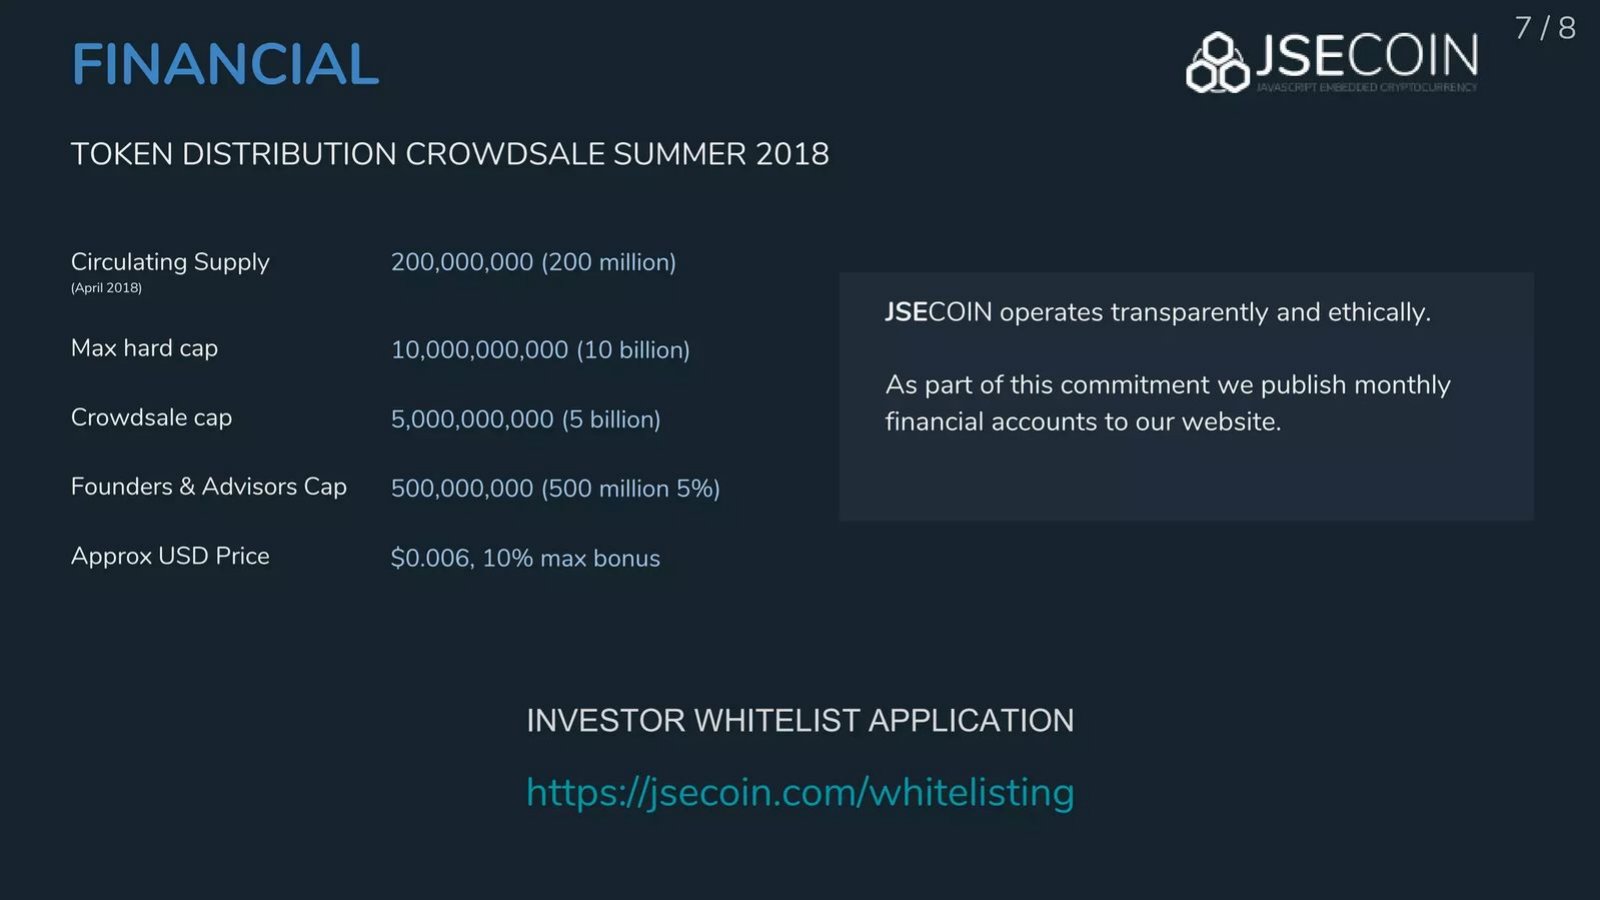
JSEcoin deck, slide 7. Exact stored slide matched to this analysis.
Our analysis: Cautionary: a cap worth about $30M; the sale raised about $111,500.
Evidence and limitation: Treating a cap as a forecast.
What a founder can adapt: Present a minimum you need, not only a ceiling.
Supporting analysis
What the deck claims: Circulating supply 200,000,000 (April 2018); hard cap 10 billion; crowdsale cap 5 billion; founders and advisors cap 500 million (5%); price about $0.006, 10% maximum bonus.
Presentation choice: Cautionary: a cap worth about $30M; the sale raised about $111,500.
When it does not fit: Treating a cap as a forecast.
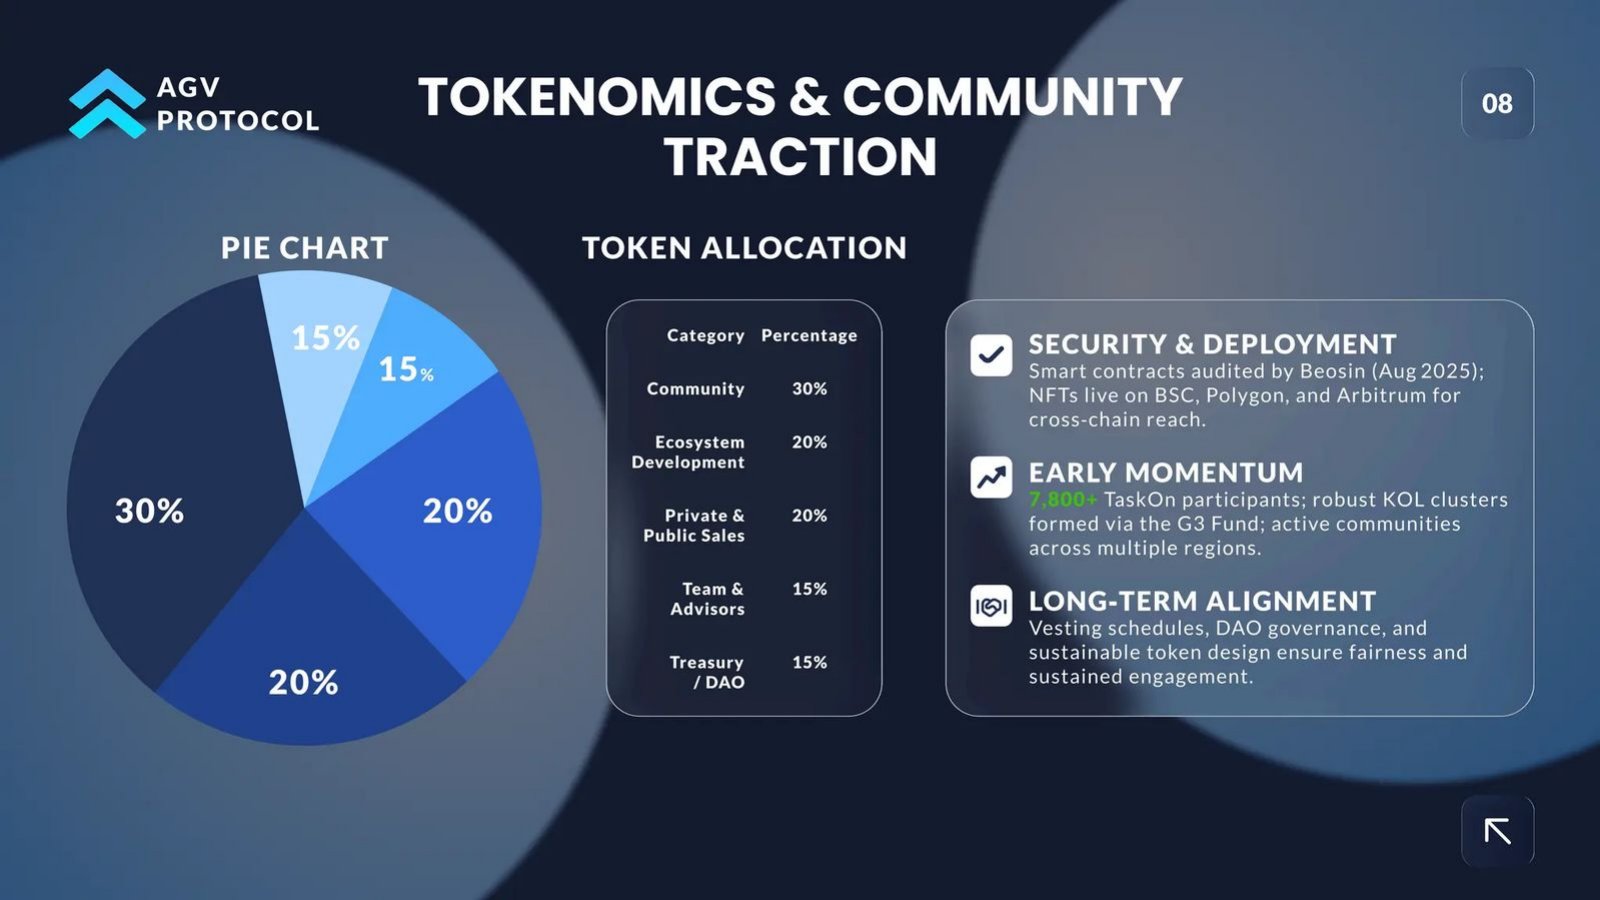
AGV Protocol deck, slide 9. Exact stored slide matched to this analysis.
Our analysis: Cautionary: vesting claimed but not shown; public page promised "up to 40x".
Evidence and limitation: Return multiples anywhere near the deck.
What a founder can adapt: Give the actual lock and release terms.
Supporting analysis
What the deck claims: Community 30%, ecosystem development 20%, private and public sales 20%, team and advisors 15%, treasury/DAO 15%. "Vesting schedules, DAO governance, and sustainable token design ensure fairness"; 7,800+ campaign participants; contracts audited August 2025.
Presentation choice: Cautionary: vesting claimed but not shown; public page promised "up to 40x".
When it does not fit: Return multiples anywhere near the deck.
Only GameState and Cometa give a lock and release rule that covers insiders; only Uptota shows the value tradable at launch.
Example
Shares
Insider timing
Price or caps
Launch float
SwissBorg
Yes
Team: 4 years (adds to 80%)
Caps
No
GameState
Partly
2-year lock, daily unlock
No
No
Cometa
Yes
Seed only
Seed price
No
Uptota
Yes
Next slide
Market caps
Yes
Monico
Yes
No
Full table
No
Plastic Finance
Yes
Up to 27 months
Reconciles
No
Hoard
No
No
Does not reconcile
No
Warlands
Yes
No
No
No
SolChicks
Yes
No
No
5%
JSEcoin
Caps only
No
Price and cap
No
AGV Protocol
Yes
Claimed, not shown
No
No
Key Takeaways
Show shares, timing and price together.
Give a lock and release schedule for every insider group.
Show the value of tokens on the market at launch, not only the full supply.
Make the percentages and caps add up.
Keep return promises off the slide.
Check your tokenomics slide before you send it
Answer each in one line.
Shares. Does every group have a share and token count, and do they total 100%?
Insiders. What is the lock and release schedule for the team, advisors and each investor round?
Price. Do token counts times prices equal the stated caps?
Launch. What share of tokens is tradable on day one, and what is it worth?
Treasury. Who controls the treasury, and what can it be used for?
Copyable framework: [Group], [share]%, [n] tokens at [price]; [lock] lock, then [period] of [monthly/daily] release; unvested tokens [return to treasury/are cancelled] if [condition]
Illustrative example 1 — written by us
Before: Vesting schedules, DAO governance, and sustainable token design ensure fairness.
After: Team and advisors, 15%: [n]-month lock, then [n] months of monthly release; sales rounds, 20%: [terms per round]
What improved: Our illustrative rewrite, not AGV Protocol's text. Bracketed parts are placeholders, not company facts.
What this guide covers
Many crypto projects raise money by selling a token rather than, or as well as, shares. Their pitch decks then need a slide that does the job a cap table does for an equity round: it shows who owns what, and on what terms. In crypto this slide is usually called tokenomics. It normally includes the total number of tokens, a chart of how they are divided between groups such as the team, investors, the community and a treasury, and, in the better examples, when each group's tokens are released.
Our live web3 guides cover the problem, product, business model, market, competition, traction and team slides for crypto companies. The business model guide explicitly leaves out token allocation slides because they are not revenue models. The cap table guide covers equity ownership. None of them looks at how a token is divided and released over time, which is what investors and token buyers ask about first. This guide fills that gap.
We searched the extracted text of the deck library for tokenomics, token allocation, token distribution, vesting and related terms and read each candidate from images of the original deck pages. We kept eleven slides from eleven projects. Eight slides were dropped because they had no figures (a supply number alone, or percentages left as placeholders) or were about something else, such as a roadmap or a timeline. Tokens are not listed equity, so a token trading on an exchange did not exclude a project. Instead we checked each project's public record for collapse or regulatory action and used three of them only as warnings.
This is a guide to presenting information clearly. It is not advice to buy, sell or launch any token, and we have not checked whether any token described here is a security under any country's law. Founders should get legal advice before selling tokens to anyone.
Question one: who gets what share
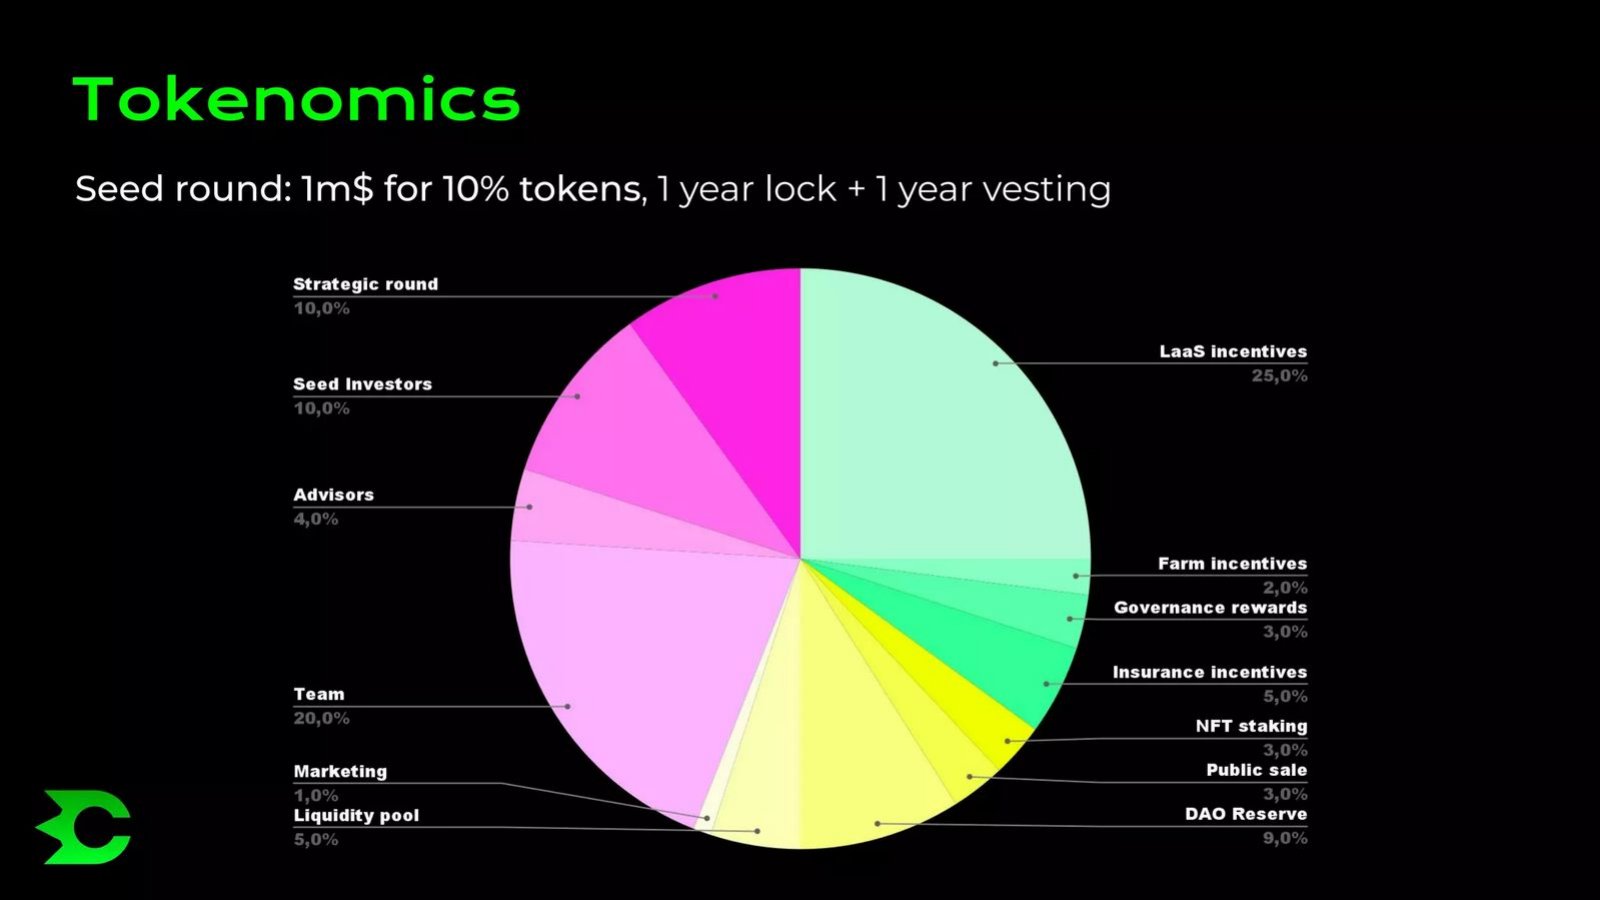
Every slide in this set shows how the token supply is divided, usually as a pie chart. The chart is only useful if the labels are specific and the numbers add up. Cometa, a liquidity project built on the Algorand blockchain, splits its supply into thirteen labelled groups that add up to exactly 100%: liquidity incentives 25%, team 20%, seed investors 10%, a strategic round 10%, a reserve for its governing community 9%, advisors 4% and seven smaller pools. AGV Protocol, which turns real-world assets such as orchards and solar farms into tokens, uses a five-row table: community 30%, ecosystem development 20%, private and public sales 20%, team and advisors 15%, treasury 15%. Both are easy to read.
The groups that matter most to an outside buyer are the insiders: the team, advisors and early investors. Their combined share tells a reader how much of the supply could later be sold by people who got it cheaply or for free. On Cometa's slide the team, advisors, seed and strategic investors together hold 44%. On SolChicks, a blockchain game, the team holds 20% and the private seed and presale buyers another 14.3%. Neither slide adds these up for the reader. It is worth doing on the slide itself, because an investor will do it anyway.
Be careful to separate the token split from the use of the money raised. Warlands, a blockchain game, puts two charts on one page. The first, titled capital acquisition distribution, says 50% of the money raised goes to the developer team, 20% to promotion, 10% each to structure, team and marketing. The second, the token distribution, gives 52% of the tokens to play-and-earn rewards and 10% to the team. A quick reader could take the 50% for the team's share of the tokens. Label each chart clearly and, if possible, put them on separate slides. Warlands also adds a disclaimer that the reserve, marketing and liquidity allocations may change before distribution, which is honest but means the chart is not final.
Question two: when insiders can sell
Timing is where most tokenomics slides fall short, and it is the part buyers worry about most. If the team or early investors can sell their tokens the day trading opens, the price can fall sharply. The usual protections are a lock, sometimes called a cliff, during which nothing is released, followed by vesting, where tokens are released gradually. A good slide states both for every insider group.
SwissBorg, a Swiss crypto investing app, gives the most detailed rule in this set. Its note says team and advisor tokens are distributed over four years from the end of the token generation event on 7 January 2018, with 10% released every six months, and that a team member who leaves receives nothing further, with the remainder passing to whoever replaces them. The forfeiture rule is excellent: it ties the team's tokens to staying with the company. But the arithmetic does not close. Eight releases of 10% over four years add up to 80%, not 100%, and the note does not say when the last 20% arrives. A reader will notice.
GameState, a gaming platform, writes one line across its whole chart: "All vested tokens locked for 2 years - daily linear unlock." Each allocation is marked vested or liquid, so a reader can see that the company's 15%, advisors, a venture partner and a community allocation are locked, while the 10% treasury for bounties and influencer rewards is liquid from the start. The development team's 10% is split into 5% vested and 5% sent to the liquid treasury, which is unusual and worth explaining. The project's public token page adds that private round buyers had a three-month cliff and nine months of daily vesting.
Cometa puts the seed terms in the slide's subtitle: "Seed round: 1m$ for 10% tokens, 1 year lock + 1 year vesting." In one line, a reader learns the price, the share, the lock and the release period, and can work out that the deal values the full token supply at $10M. Plastic Finance, a recycling project, says early contributors' 3,585,000 tokens, about 15% of its 23.9 million supply, are "locked up to 27 months". That gives a maximum, but not when release starts or how fast it goes.
AGV Protocol shows the weakness most clearly. Its slide says "Vesting schedules, DAO governance, and sustainable token design ensure fairness" but gives no schedule at all. SolChicks gives one timing figure, a 5% unlock at the token generation event excluding exchange liquidity, and nothing about when the team's 20% is released. Saying vesting exists is not the same as showing it.
Question three: what the sale raises, at what price
Investors also need to know how much money the token sale is meant to raise and what the price implies. Uptota, a crypto exchange and payments project aimed at Africa, puts three figures across the top of its chart: total supply 200 million, initial market capitalisation at the token generation event $4,294,688, and fully diluted market capitalisation $45,000,000. The first is the value of the tokens that will actually be tradable on day one; the second is the value of every token that will ever exist at the same price. Showing both is unusually honest, because it tells a buyer that only about 9.5% of the supply's value will be on the market at launch and the rest will arrive later. The slide also says 19.35% of tokens are sold in pre-launch rounds, which matches the six labelled sale slices of 2%, 2.5%, 2.85%, 3.5%, 4% and 4.5%. The open sale round, at 28.15%, is shown separately. Uptota's own website repeats the same $45M figure and gives each round's cliff and vesting.
Monico, a 2018 app for finding and buying token sales, prints a full sale table: 100 million tokens authorised, 50 million for sale, a price of 1,000 tokens per ether, a private round and four public rounds with discounts of 35%, 25% and 15% and none, hard caps of 10 million, 10 million, 10 million and 15 million tokens, and the duration of each round. Beside it are two charts, one for the token split and one for how the money will be spent (technology 45%, marketing 21%). It is a clear page. It does not say when the 30% held in reserves can be sold.
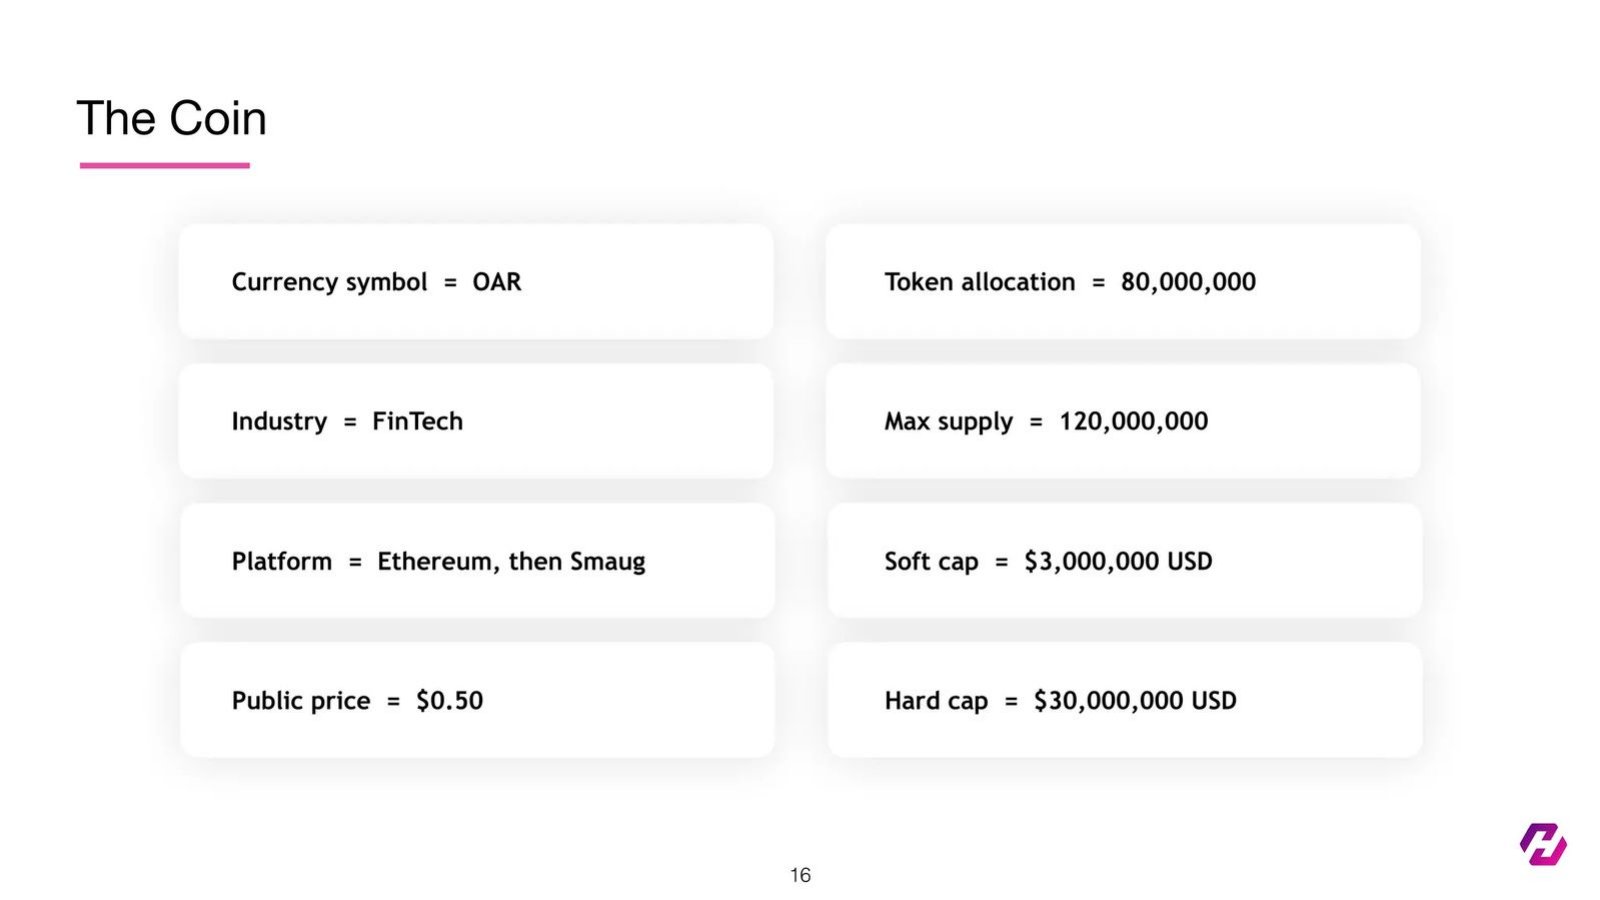
Plastic Finance's figures reconcile, which is worth noting because many do not. Two million tokens in private sales at $0.375 and two million in pre-sales at $0.60 add up to its stated $1.95M pre-sale cap; two million public tokens at $1 make its $2M public cap; the total, $3.95M, matches the slide. Hoard, a 2018 crypto wallet project, shows 80 million tokens to be sold out of a maximum of 120 million, at a public price of $0.50, with a soft cap of $3M and a hard cap of $30M. Eighty million tokens at $0.50 would raise $40M, not $30M. Discounts or bonuses might explain the gap, but the slide does not say. If your caps and prices cannot be multiplied together to get the same answer, explain why on the slide.
The warning examples
JSEcoin, a project that let websites mine a cryptocurrency in visitors' browsers, planned a summer 2018 crowdsale with a cap of 5 billion tokens at about $0.006 each, with founders and advisors capped at 5%. At that price the full crowdsale would have raised about $30M. Public records show the sale, which ran from July to October 2018, raised about $111,500, and the company shut down its platform in April 2020, citing the decline in crypto markets. JSEcoin's competition slide, analysed in another guide, also claimed "Potential for 100x growth". The lesson is that a cap is a ceiling, not a forecast, and should never be presented as one.
SolChicks' launch in December 2021 was so busy that it congested the Solana network. Its creator, Catheon Gaming, raised $55M, but in 2022 it cut its staff by about half as crypto prices fell, and leaked messages reported by the blockchain investigator ZachXBT suggested the project lost up to $20M of its treasury in the collapse of the TerraUSD stablecoin without telling its community. A tidy allocation chart said nothing about how the treasury would be managed. If your slide includes a treasury, say who controls it and what it may be invested in.
AGV Protocol's slide is ordinary. The warning comes from its public participation page, which offered tokens at $0.025 before launch against a "target launch range" of $0.80 to $1.00 and promised "up to 40x potential upside". Statements like that invite regulatory attention in many countries and destroy credibility with professional investors. Keep return promises, price targets and multiples out of the deck and out of any sales page that accompanies it.
How to build a tokenomics slide investors can check
Start with a single table rather than a pie chart. Give one row per group: team, advisors, each investor round, public sale, community or rewards, treasury, liquidity. For each row show the share, the number of tokens, the price paid if any, the lock period, the vesting period and how often tokens are released. Add a final row for the total, which must be 100% and must match the supply figure. A chart can sit beside the table, but the table is what an investor will read.
Then add three summary numbers at the top: the total supply, the share of tokens that will be tradable on the first day, and the value of those tokens at the launch price beside the value of the full supply. Uptota is the only slide here that does this. Below the table, add one line for any rule that protects buyers, such as SwissBorg's forfeiture rule, and one line for who controls the treasury. Finally, check every multiplication: shares times supply should give token counts, token counts times price should give the caps, and release periods should add up to 100% of each allocation.
A hypothetical example of a complete insider row, not taken from any deck, would read: "Team, 15%, 150,000,000 tokens, 12-month lock, then 24 months of monthly release; unvested tokens return to the treasury if a member leaves." One line like that answers most of the questions a buyer has about the team.
Common mistakes
Shares without timing. Give a lock and release for every insider group.
Schedules that don't add up. Release steps must total 100%.
Caps that don't multiply out. Tokens times price should equal the cap.
Only the big number. Show the launch value beside the full value.
Return promises. No price targets or multiples.
Diagnostic checklist
One row per group with share and token count.
Lock and vesting for each insider group.
Price per round and caps that reconcile.
Share and value tradable at launch.
Who controls the treasury.
Frequently asked questions
How we chose these examples
Corpus: published pitch deck teardowns on StartupFundraising.com. Founder-uploaded private decks are excluded.
Selection (2026-10-01): we searched extracted slide text for tokenomics, token allocation, token distribution, vesting, unlock and related terms, shortlisted 19 pages and read each from images made from the original deck files. Eight were dropped: no figures (Chillchat p12, Glow Labs p6, Seam Social p9, GameState p17 supply only), percentages left as placeholders (Space and Time p12), or a different subject (Cometa p14 roadmap, Hoard p13, WOF p19 timeline).
Eligibility: tokens are not listed equity, so trading on an exchange did not exclude a project. We checked each project's public record for collapse or regulatory action. SwissBorg, GameState, Cometa, Uptota, Monico and Warlands showed no regulatory action; Hoard and Plastic Finance have no public outcome we could find. SolChicks, JSEcoin and AGV Protocol are included only as warnings, for the public reasons given in the guide.
Overlap check: no live guide or draft covers token allocation or vesting; the web3 business model guide excludes AGV Protocol p9 as a token allocation slide. JSEcoin, Monico and AGV Protocol appear in the web3 competition draft with different slides.
Slide numbers are PDF page numbers; AGV Protocol's slide is printed as page 08.
Review: all eleven slide images were inspected on 2026-10-01 and matched to company, deck and slide number (AI editorial model review). No person has yet completed an editorial review of this page. The worksheet and the example insider row are hypothetical and use placeholders, not company data.
Figures are the projects' own claims; we did not verify underlying data or any token's legal status. Nothing in this guide is investment advice, and we make no claim that any slide caused a fundraising outcome.