For consumer brands entering retail: show margin on net sales, add a gross-to-net bridge, and budget slotting, free fills.
Trade Spend and Slotting Fees in a CPG Pitch Deck: Show Net Margin and Size Your Raise
Three slides from real consumer-brand pitch decks show where retailer costs end up: one hidden inside cost of goods, two as a line in the raise. Below each, we record what the slide says, what an investor cannot tell from it, and what to change on your own deck.
TL;DR
Show margin on net sales, not gross sales. Trade spend (promotions, off-invoice discounts, slotting, retailer deductions) reduces revenue; it does not belong in marketing below the gross margin line. Add a short gross-to-net bridge so an investor can see each deduction, and size your raise with slotting, free fills, first-year promotions and the cash tied up in inventory and receivables.
Chris Fenster of Propeller Industries, a finance firm serving consumer brands, writes that a pitched 45% gross margin is often closer to 30% once these costs are booked correctly. Eightx, a CFO firm, puts total gross-to-net deductions at 30 to 40% of gross sales for brands in promotion-heavy categories.
Retailer costs on real consumer-brand slides
Each example shows the exact stored slide, rendered from the original public deck file, above its analysis. Figures are the companies' own claims and have not been verified. Calculations marked as ours are not the companies'.
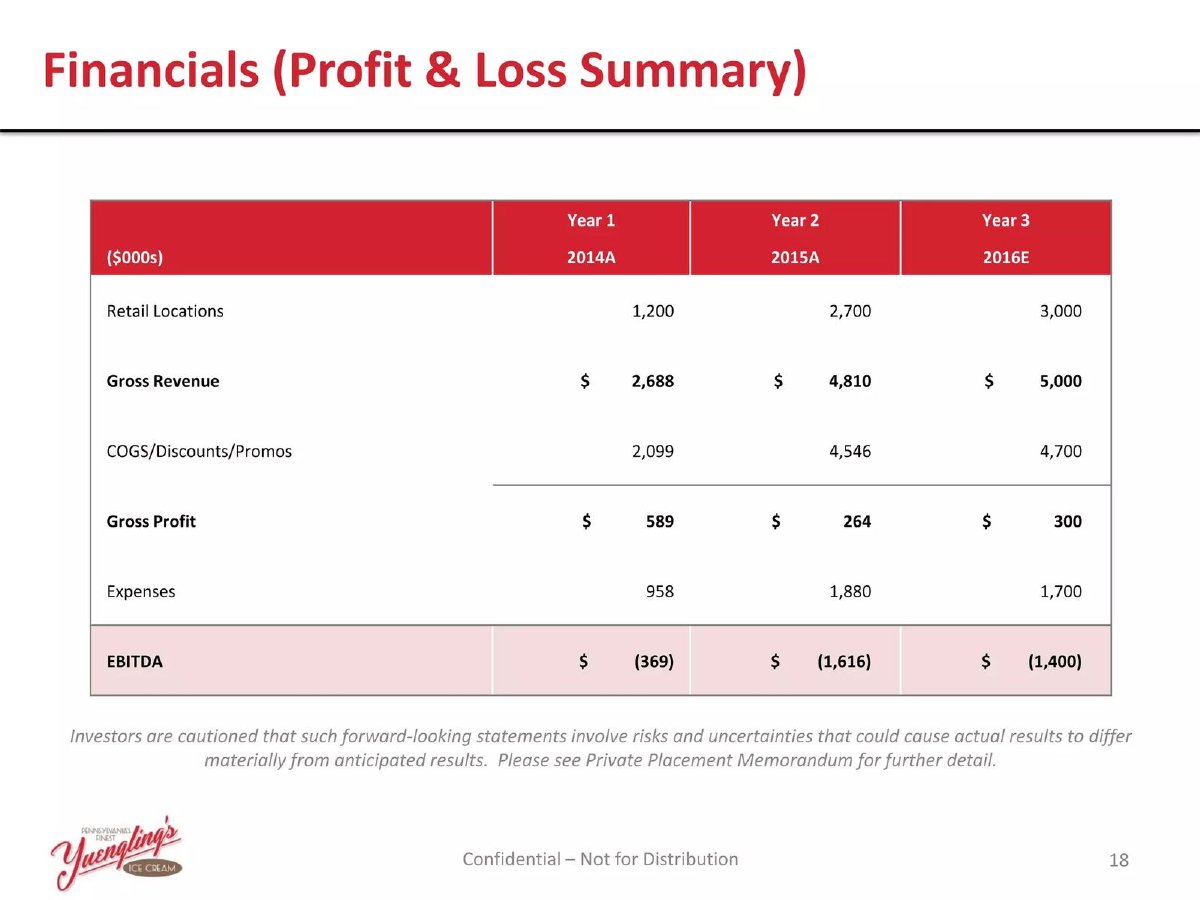
Yuengling's Ice Cream financials slide — slide 18
Ice cream brand raising through a 506(c) private placement. "Financials (Profit & Loss Summary)" page, in $000s, with a forward-looking-statements caution.
Yuengling's Ice Cream deck, slide 18. Exact stored slide matched to this analysis.
Our analysis: Product costs and retailer promotions combined on one line, so a collapse in margin cannot be explained.
Evidence and limitation: Our calculation: gross profit is 21.9% of gross revenue in 2014 and 5.5% in 2015, both labelled actual, and 6.0% in the 2016 forecast. Revenue grew about 79% from 2014 to 2015 while gross profit fell by $325,000.
What a founder can adapt: Split the line into a bridge: gross revenue, then discounts, promotions and deductions, then net revenue, then cost of goods. An investor can then see whether entering 1,500 more stores cost margin through promotions or through production.
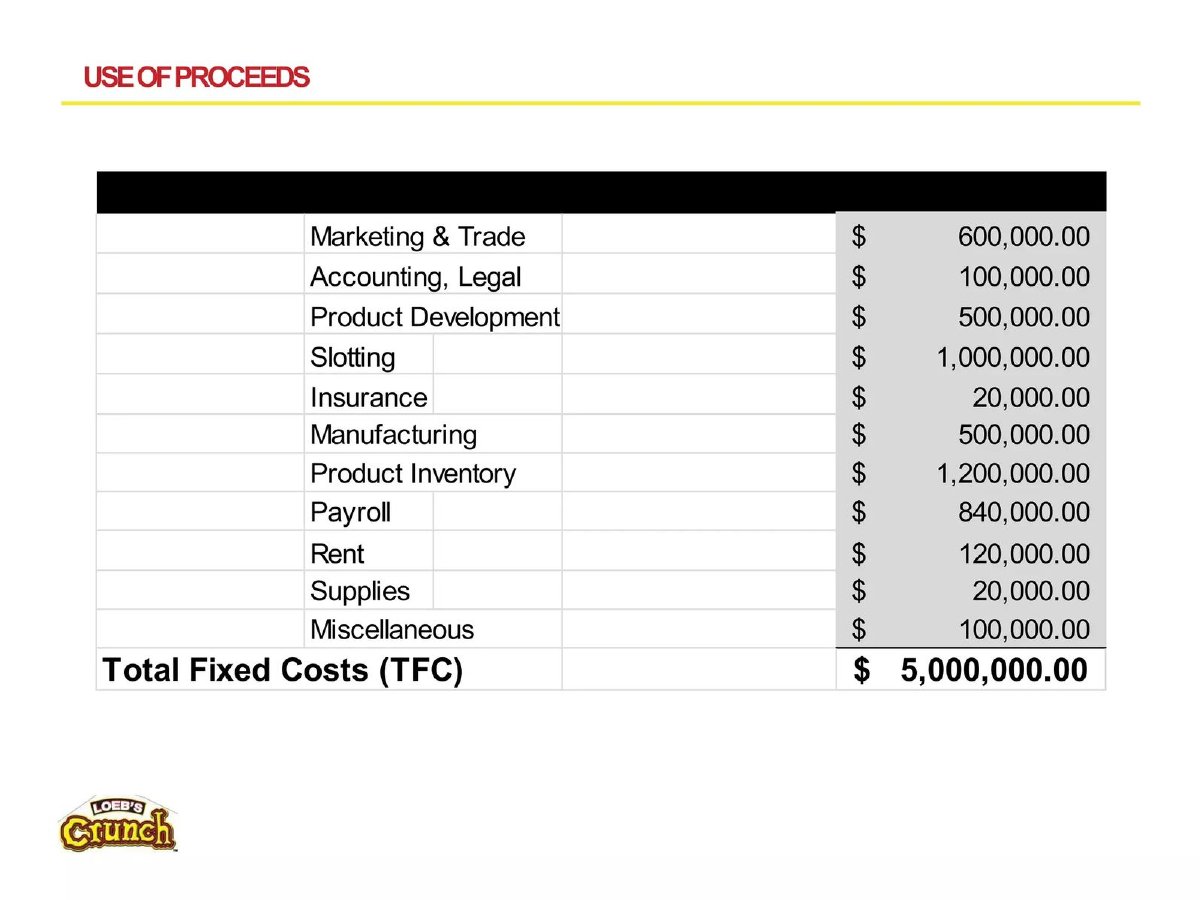
Snack brand. "Use of Proceeds" page, a table totalling the raise.
Loeb's Crunch deck, slide 7. Exact stored slide matched to this analysis.
Our analysis: Slotting and inventory sized as separate lines in the raise, but not tied to retailers or stores.
Evidence and limitation: Our calculation: the eleven lines add exactly to $5,000,000. Slotting is 20% of the raise and inventory 24%; with Marketing & Trade, retail-related lines are 56%.
What a founder can adapt: Name the target retailers, SKUs and store counts behind the $1,000,000, add free fills and first-year promotions, and split "Marketing & Trade" so trade spend is visible.
Presentation choice: Slotting gets its own line, apart from marketing, and inventory is budgeted as cash, which is the structure this guide recommends.
When it does not fit: Don't label the whole raise "fixed costs" when slotting, inventory and promotions scale with each new retailer.
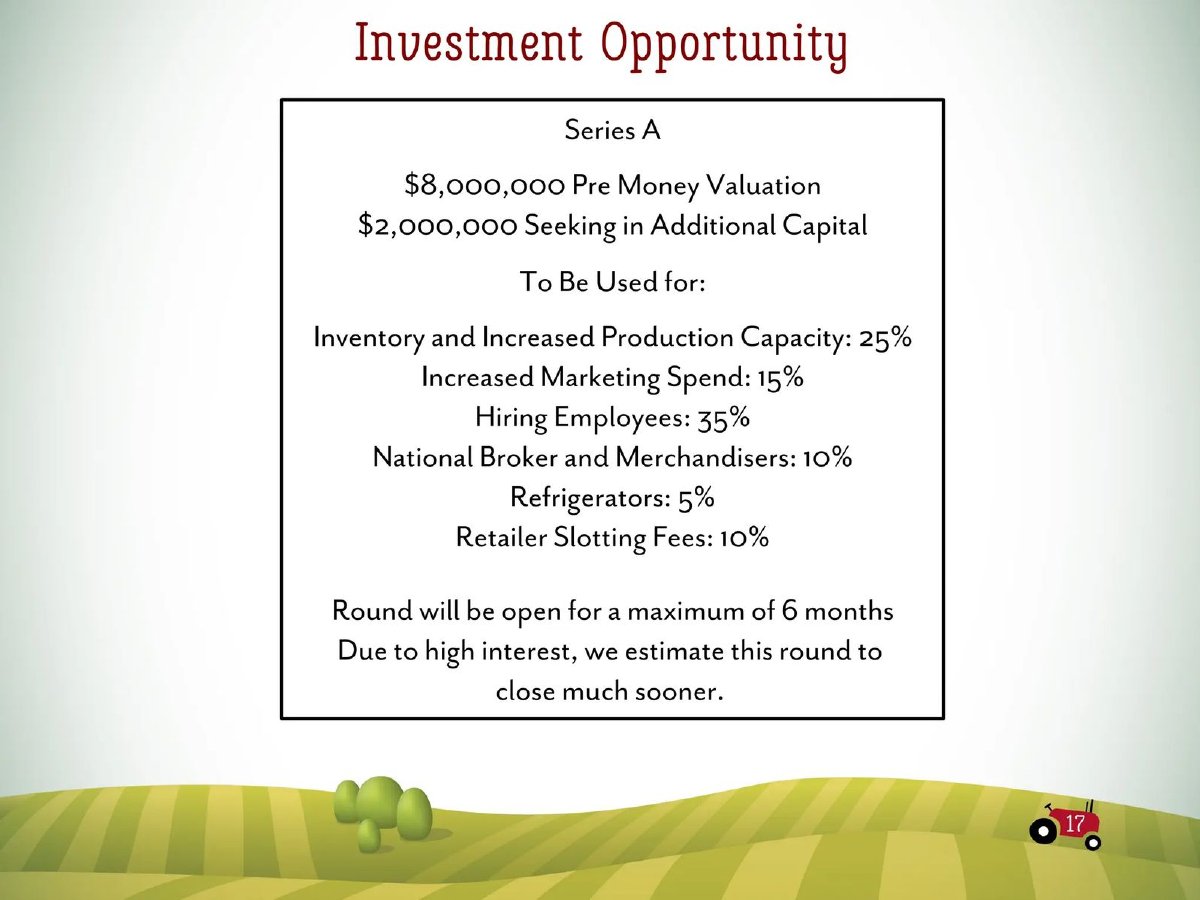
Refrigerated children's food brand. "Investment Opportunity" page; the slide carries the printed number 17, while our archive stores it as slide 20.
Once Upon a Farm deck, slide 20. Exact stored slide matched to this analysis.
Our analysis: Retail entry costs (slotting, brokers, refrigerators) listed separately in a small raise.
Evidence and limitation: Our calculation: the six shares add to 100%. Slotting is $200,000 and inventory with production capacity $500,000 of the $2,000,000.
What a founder can adapt: Convert the percentages into dollars, and say how many retailers and stores the $200,000 of slotting buys and whether free fills and launch promotions are included.
Supporting analysis
What the deck claims: "Series A"; "$8,000,000 Pre Money Valuation"; "$2,000,000 Seeking in Additional Capital". To be used for: Inventory and Increased Production Capacity 25%; Increased Marketing Spend 15%; Hiring Employees 35%; National Broker and Merchandisers 10%; Refrigerators 5%; Retailer Slotting Fees 10%.
Presentation choice: For a refrigerated brand, the slide shows the costs specific to getting into chilled shelves: slotting, in-store equipment and brokers.
When it does not fit: Don't let urgency lines ("we estimate this round to close much sooner") stand in for showing how far the money goes.
Each cell reports only what the slide itself states. "Not stated" means the page gives no figure.
Example
Trade spend shown separately?
Slotting in the raise
Inventory in the raise
Actual vs forecast
Yuengling's Ice Cream
No (one line with cost of goods)
Not stated
Not stated
Labelled (A/E)
Loeb's Crunch
Combined with marketing
$1,000,000 of $5,000,000
$1,200,000
Not applicable
Once Upon a Farm
Not stated
10% of $2,000,000
25% with production capacity
Not applicable
Key Takeaways
Calculate gross margin on net sales and say so on the slide.
Give each deduction its own row. Yuengling's single "COGS/Discounts/Promos" line hides why its gross profit fell from 21.9% to 5.5% of gross revenue (our calculation).
Label actual and forecast columns, as Yuengling does with "2014A", "2015A" and "2016E".
Give slotting its own line in the use of funds, as Loeb's Crunch and Once Upon a Farm do, then tie it to retailers, SKUs and stores.
Budget free fills, pay-to-stay and first-year promotions with the slot, not just the fee.
Size the raise for inventory and receivables as well as losses.
Build your gross-to-net and retail entry lines
Fill in your own figures. Leave a field blank rather than borrowing another brand's benchmark.
Gross sales. Gross sales for the period, at list price before any deduction. Actual or forecast?
Trade spend. Promotions, off-invoice discounts, slotting and scan or billback allowances, in dollars and % of gross sales.
Deductions and returns. Retailer chargebacks, shortage claims, returns and cash discounts, in dollars and % of gross sales.
Net sales and gross profit. Net sales, cost of goods, and gross profit as a % of net sales.
Retail entry budget. For each target retailer: SKUs, stores, slot fee, free fills, first-year promotions, and cases needed to pay back the slot.
Working capital. Days of inventory, days to get paid, days you pay suppliers, and the cash this ties up at your forecast volume.
Copyable framework: Gross sales [amount] less trade spend [amount, %], deductions [amount, %], returns [amount, %] = net sales [amount]; gross margin [%] of net sales ([actual/forecast], [period]). Raise: operating losses [amount], retail entry [amount] for [retailers, SKUs, stores], working capital [amount].
Illustrative example 1 — written by us
Before: Gross margin 45%. Use of funds: marketing 40%.
After: Hypothetical figures: gross sales $1,000,000 less deductions $200,000 (20%) = net sales $800,000; gross margin 31.25% of net sales, forecast. Retail entry: $40,000 slot at one chain, 4,000 cases to pay back at $10 gross profit per case, plus free fills and launch promotions.
What improved: Invented for illustration. Margin on net sales and a retail entry line tied to a retailer make the figures testable.
Why the margin slide is usually wrong
Fenster says almost every consumer-brand deck has a gross margin slide that is wrong, not because founders are lying but because trade deductions, slotting fees and distributor and retail margins are supposed to come out of revenue. He adds that a dollar of gross sales commonly comes back with 40 to 50 cents of deductions already taken before the brand sees cash.
Eightx explains the accounting basis: under US GAAP (ASC 606, consideration payable to a customer), money paid to a retailer generally reduces the transaction price. It cites Hershey's annual report, which records trade promotion costs as a reduction to net sales. Booking trade spend as marketing overstates both revenue and gross margin. (Propeller Industries (Chris Fenster), Eightx (Matt Putra))
Show a gross-to-net bridge
Eightx's typical ranges, as a share of gross sales: trade spend 15 to 25%; retailer deductions and chargebacks 5 to 15%; returns, allowances and cash discounts 3 to 10%; total 30 to 40%, leaving net revenue near 60 to 70% of gross. These are one firm's client benchmarks, not rules; use your own figures.
Our recommendation: put the bridge on the financials or unit economics slide as one row per deduction, from gross sales to net sales, then gross profit on net sales. State the period and whether figures are actual or forecast. If promotions are still accrued roughly, say so rather than presenting a precise-looking number. (Eightx (Matt Putra))
Expect margin to dip as you enter grocery
Fenster reports from Propeller's client data that properly accounted gross margin for a $5 to $10m brand typically runs 35 to 40%, falls to about 30% near $80m of revenue, then recovers to 40% at $180m. He attributes the dip to expansion into grocery, new SKUs before volume, and growth capital spent on slotting and trade.
Our recommendation: if your plan adds conventional grocery, show the dip in the forecast and explain it, rather than a straight line to a mature margin. Fenster's figures are one firm's benchmarks. (Propeller Industries (Chris Fenster))
Budget the full cost of getting on shelf
Eightx gives planning ranges for slotting: about $250 to $1,000 per item per store in conventional grocery, $5,000 to $75,000 per SKU for a chain authorization, with frozen and refrigerated items the most expensive; it notes Walmart, Costco, BJ's and many natural retailers charge little or no upfront cash slotting. It also cites the FTC's grocery study (early-2000s data, directional) averaging $9,182 per UPC per region-chain.
The slot is not the whole entry cost. Eightx lists free fills (initial stock supplied at no charge), pay-to-stay fees and first-year promotions, and describes a founder who budgeted $40,000 for the slot and spent closer to $110,000 getting the SKU to stay on shelf. Its breakeven test: total slot cost divided by gross profit per case. (Eightx (Matt Putra))
Size the raise for cash, not just losses
Fenster describes the most common early failure as sizing a raise off losses on the P&L and forgetting the balance sheet: 60 days of inventory plus 60 days of receivables, less what payables cover, is often double what the P&L implies. He also warns that each added channel and SKU adds minimum orders, receivables and trade spend.
Our recommendation: show investors the raise as three parts: operating losses, retail entry costs (slotting, free fills, launch promotions), and working capital for inventory and receivables. (Propeller Industries (Chris Fenster))
A worked example: the same brand, two margins
Invented for illustration; not a real company. A snack brand forecasts $1,000,000 of gross sales next year and $550,000 of cost of goods. Its deck shows a 45% gross margin: ($1,000,000 - $550,000) / $1,000,000. Trade spend sits further down the page, inside marketing.
Now assume deductions, as shares of gross sales: trade spend 12% ($120,000), retailer deductions 5% ($50,000), returns and allowances 3% ($30,000); total 20% ($200,000). Net sales are $800,000. Gross profit on net sales is $800,000 - $550,000 = $250,000, or 31.25% of net sales. The margin falls 13.75 percentage points, and gross profit falls by the same $200,000 that left marketing.
Nothing about the business changed between the two versions; only where the costs sit. That is why an investor who has seen many consumer decks will rebuild the margin themselves, and why a founder who shows the second version first starts the diligence conversation with credibility rather than a correction.
For one new chain, the same founder assumes a $40,000 slot fee and $10 of gross profit per case, so the slot needs 4,000 cases to pay back ($40,000 / $10), before free fills and promotions. If Eightx's example of a $40,000 slot turning into about $110,000 of total entry cost applied, payback would need about 11,000 cases at the same gross profit (our calculation). Showing both numbers tells an investor you know the difference. (Eightx (Matt Putra))
Reading the three slides together
Put side by side, the three slides cover the two places retailer costs belong in a deck, and show what is missing from each. Yuengling's financials page shows the effect on margin but not the cause. Loeb's Crunch and Once Upon a Farm show the cost in the raise but not the margin effect or what the money buys.
Yuengling's 2015 column is the clearest warning in the set. Retail locations more than doubled, from 1,200 to 2,700, and gross revenue rose from $2,688,000 to $4,810,000, yet gross profit fell from $589,000 to $264,000. Because "COGS/Discounts/Promos" is one line, a reader cannot tell whether the brand paid to enter 1,500 stores through promotions and slotting, or whether production costs rose. The two explanations call for different investor questions: the first may be a one-time entry cost, the second a structural margin problem.
Loeb's Crunch sizes slotting at $1,000,000 and inventory at $1,200,000 in a $5,000,000 raise, which together are 44% of the money (our calculation). That is the shape the sources recommend, but without retailer and store counts an investor cannot check whether $1,000,000 is enough, too much or a round number. Once Upon a Farm's $200,000 of slotting (our calculation from 10% of $2,000,000) raises the same question for a refrigerated product, where Eightx says slotting is the most expensive.
Combine the two halves on your own deck: a bridge on the financials slide that shows trade spend as a deduction from revenue, and a use of funds that names the retailers, SKUs and stores the slotting line buys. Then the margin slide and the raise slide tell one consistent story. (Eightx (Matt Putra))
Where each retail cost goes
Money paid or credited to a retailer or distributor, such as promotions, discounts, slotting and chargebacks, belongs between gross sales and net sales in the bridge. If it is a one-time entry cost such as slotting, also budget its cash in the raise.
The cost of making the product, such as ingredients, packaging and co-packer fees, goes in cost of goods, below net sales. One-time costs of entering a new retailer go in the use of funds as retail entry, tied to retailer, SKUs and stores. Cash tied up in stock or unpaid retailer invoices goes in the raise as working capital, not as a loss. Everything else is an operating expense.
Our recommendation: when you are unsure where a cost goes, ask whether the retailer receives the money or the credit. If it does, treat it as a deduction from revenue and confirm the treatment with your accountant. (Eightx (Matt Putra))
Common mistakes
Margin on gross sales. Quoting gross margin on gross sales while trade spend sits in marketing.
One combined line. Combining product costs and promotions, as Yuengling does, hides the cause of a margin change.
Slot fee only. Budgeting only the slot fee and forgetting free fills and first-year promotions.
Losses only. Sizing the raise from P&L losses alone, without inventory and receivables.
Borrowed benchmarks. Applying another brand's percentages instead of your own retailer terms.
Diagnostic checklist
Gross margin is calculated on net sales, and the slide says so.
A gross-to-net bridge lists each deduction with its period.
Actual and forecast figures are labelled.
Promotions and slotting do not sit in marketing.
The forecast explains any margin dip from entering grocery.
The use of funds shows slotting, free fills and launch promotions tied to named retailers.
The raise includes working capital for inventory and receivables.
Frequently asked questions
Is trade spend a marketing cost?
Generally no. Under US GAAP, money paid or credited to a retailer usually reduces revenue, which is how Hershey reports trade promotions. Confirm the treatment with your accountant. (Eightx (Matt Putra))
How much should I budget for slotting?
Use your target retailers' terms. Eightx's planning ranges are about $250 to $1,000 per item per store in conventional grocery and $5,000 to $75,000 per SKU for a chain, with some retailers charging little or no cash slotting. (Eightx (Matt Putra))
Should slotting appear in my use of funds?
Yes, as its own line. Loeb's Crunch and Once Upon a Farm both do; add the retailers, SKUs and stores it buys, plus free fills and promotions.
Why might my margin fall as I grow?
Fenster reports that margins often dip when brands enter grocery, add SKUs before volume and spend on slotting and trade. Show the dip and explain it rather than projecting a straight line. (Propeller Industries (Chris Fenster))
How we chose these examples
Search (2026-10-03): the durable corpus index (docs/seo/artifacts/corpus-search) was searched for "slotting", "trade spend", "promos", "discounts" and "gross-to-net"; consumer-brand pages were kept.
Three pages were rendered from the original public deck files and read from the images: Yuengling's Ice Cream 18, Loeb's Crunch 7, Once Upon a Farm 20. Chamberlain Coffee 7 was left out because its text could not be read reliably.
All calculations are ours and labelled. Benchmark ranges are the cited firms' client data, not rules. This guide is editorial guidance, not accounting, legal, tax or investment advice.
Drafted with AI assistance and checked by an editorial model against the cited sources and slide images; not reviewed by a person.