How B2B software decks show which customers go self-serve, which get a salesperson, and what moves an account from one to the other.
SaaS Go-to-Market Slide: Routing Customers Between Self-Serve and Sales
Many software companies run more than one way of selling at once: a free or low-priced plan people sign up for alone, a salesperson for bigger accounts, sometimes a partner channel. This guide compares six real B2B software go-to-market slides on one question: does the slide say which customers go down which path, and what moves an account from one path to the next?
TL;DR
Name each way you sell, say which customers it is for, and state the rule that moves an account between them. Craft.io comes closest: sign-ups become sales-qualified leads through email and in-app outreach, and large-value customers are sent to a proof-of-concept with customer success while small-value customers take a transactional path. The slide does not define what counts as large value. Cloudsmith maps its four subscription plans to self-serve, mid-market and strategic sales, but not what moves a customer up a plan. ArchFormation lists three stages in order with no trigger between them. Rundit and CorgiAI each rely on one route (user invites and payment-provider integrations) without showing how customers in that route are served. Fibery's slide is mostly about the tools it replaces, with channels in one line.
SaaS go-to-market slides from real pitch decks
Each example shows the slide above its analysis and links to the full teardown. Slides that say who goes down each path and how accounts move come first. Claims are as shown on the slides; checks and comments are ours.
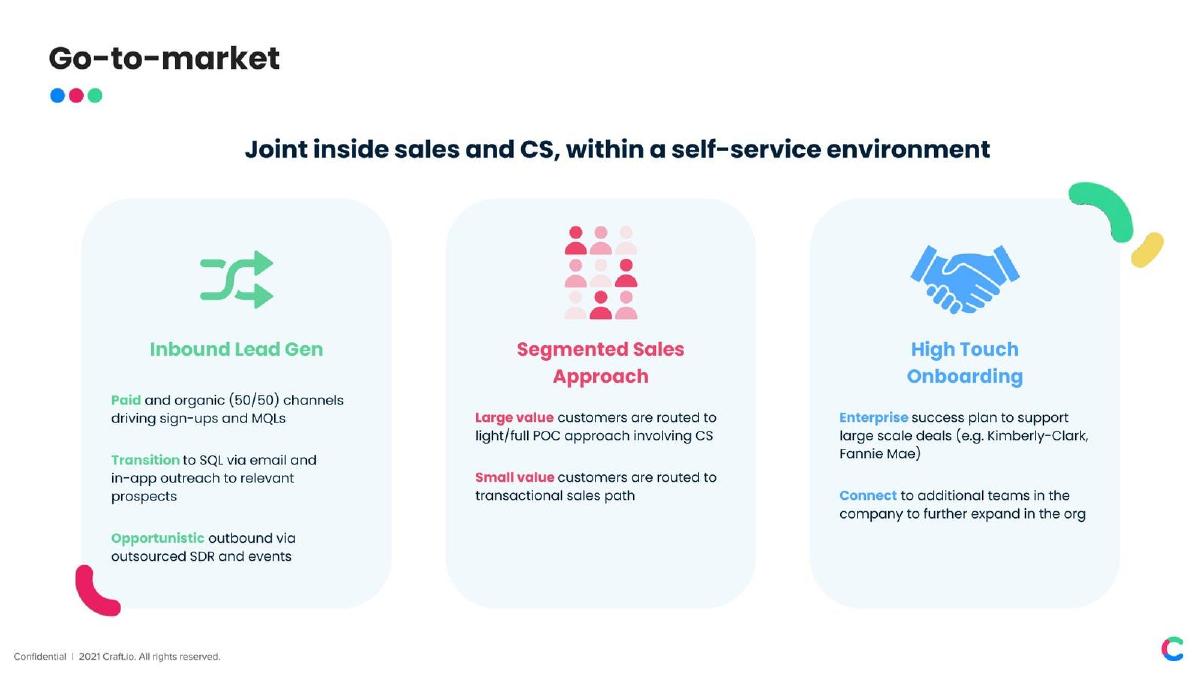
Craft.io go to market slide — slide 10
Product management software. Three panels; the slide footer reads "Confidential | 2021 Craft.io" (our teardown record lists the deck as a 2024 Series A, so the deck's exact date is not established).
Craft.io deck, slide 10. Exact stored slide matched to this analysis.
Our analysis: A product-led front door with sales layered on top for bigger accounts, and expansion by adding teams. This is the only slide in the set that states how an account moves from self-serve to a salesperson.
Evidence and limitation: The slide names the routing rule (value) and the handoff mechanism (email and in-app outreach from sign-up to sales-qualified lead). It does not say what value separates large from small, what share of sign-ups become qualified leads, or whether the 50/50 split refers to spend, leads or sign-ups. Kimberly-Clark and Fannie Mae are given as examples of large deals; the slide doesn't give their size.
What a founder can adapt: Keep the three panels and add the numbers behind them: the threshold for "large value" ([seats or annual value]), the sign-up to qualified-lead rate ([X]% over [period]), and one expansion figure.
Supporting analysis
What the deck claims: "Joint inside sales and CS, within a self-service environment." Inbound Lead Gen: "Paid and organic (50/50) channels driving sign-ups and MQLs"; "Transition to SQL via email and in-app outreach to relevant prospects"; "Opportunistic outbound via outsourced SDR and events". Segmented Sales Approach: "Large value customers are routed to light/full POC approach involving CS"; "Small value customers are routed to transactional sales path". High Touch Onboarding: "Enterprise success plan to support large scale deals (e.g. Kimberly-Clark, Fannie Mae)"; "Connect to additional teams in the company to further expand in the org".
Presentation choice: An investor can see all three stages of the funnel and who owns each, which is the question a multi-motion plan has to answer.
When it does not fit: "Large value" and "small value" without a definition leave the routing rule untestable. Say what "50/50" measures.
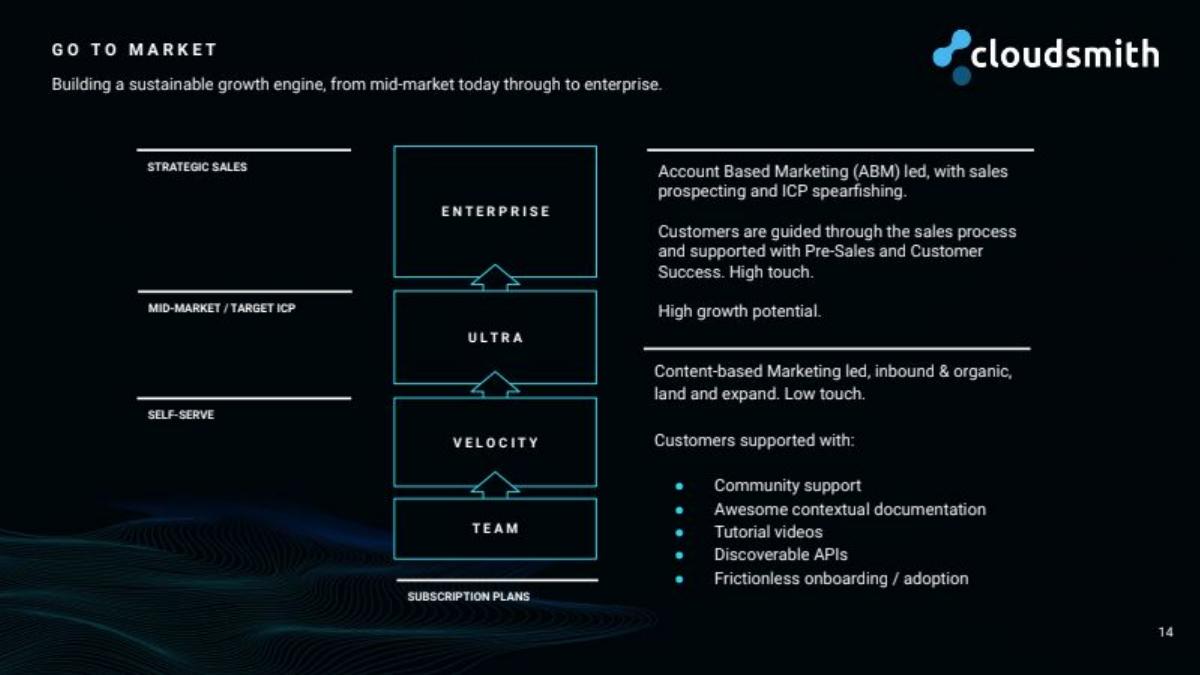
Software package management for developers; Series A deck according to our teardown record. Subscription plans drawn as a ladder beside three sales tiers.
Cloudsmith deck, slide 14. Exact stored slide matched to this analysis.
Our analysis: Pricing and sales motion drawn as one picture: the plan a customer buys tells you how it is sold. The upward arrows imply customers climb, but the reason they would is not shown.
Evidence and limitation: Each plan is placed beside a sales tier, and the two text blocks describe how the high-touch and low-touch tiers are acquired and supported. From the drawing, Team and Velocity sit at self-serve, Ultra at mid-market and Enterprise at strategic sales; the slide doesn't say this in words. It doesn't say what moves a customer up a plan, and it gives no customer counts or revenue per tier. "Mid-market today" says where the company sells now; enterprise is described as where it is heading.
What a founder can adapt: Add the upgrade trigger beside each arrow ([seats, usage or feature] moves a customer from [plan] to [plan]) and the share of revenue from each tier.
Supporting analysis
What the deck claims: "Building a sustainable growth engine, from mid-market today through to enterprise." Plans from bottom to top: Team, Velocity, Ultra, Enterprise, with arrows upward. Left labels: Self-serve, Mid-market / Target ICP, Strategic sales. Top text: "Account Based Marketing (ABM) led, with sales prospecting and ICP spearfishing. Customers are guided through the sales process and supported with Pre-Sales and Customer Success. High touch. High growth potential." Lower text: "Content-based Marketing led, inbound & organic, land and expand. Low touch." Support: community support, documentation, tutorial videos, discoverable APIs, frictionless onboarding.
Presentation choice: Tying each plan to a motion makes the routing rule visible without extra text, and "mid-market today" separates the present from the plan.
When it does not fit: Arrows without triggers read as hope. Say what you've seen: how many customers moved up in the last [period].
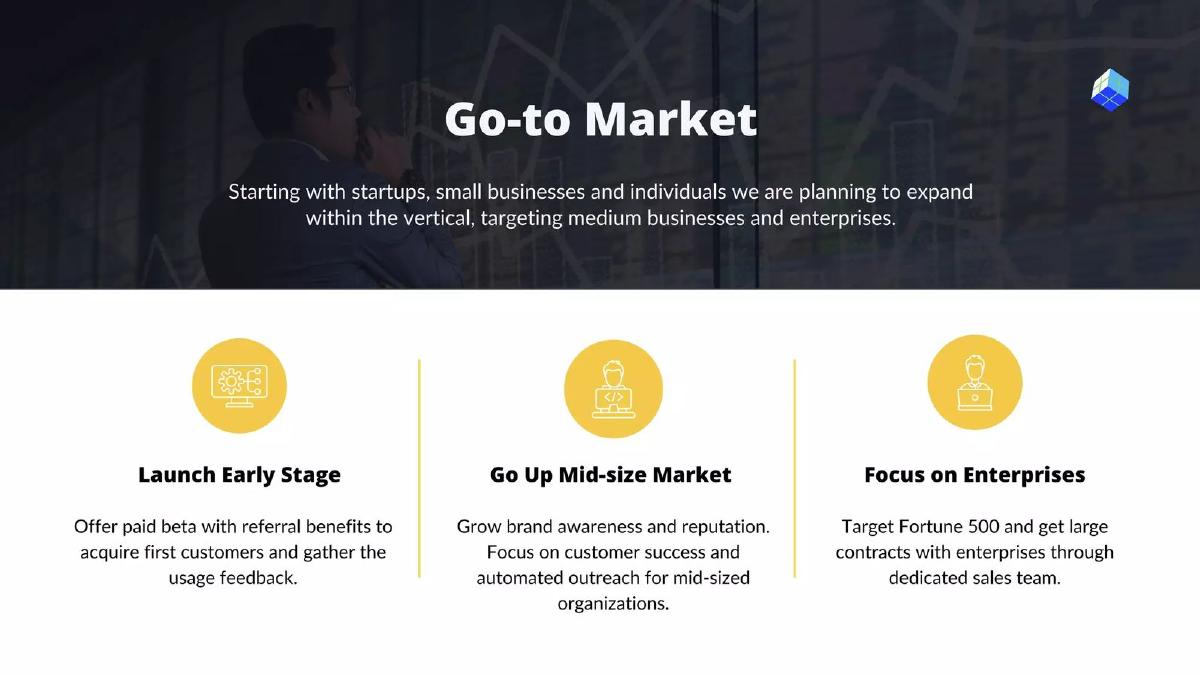
Cloud infrastructure automation. Three stages in sequence.
ArchFormation deck, slide 7. Exact stored slide matched to this analysis.
Our analysis: A sequence rather than parallel motions: the company plans to move up-market over time. Without triggers, the reader can't tell when the dedicated sales team is hired or what evidence justifies it.
Evidence and limitation: Each stage has a segment and a method. The slide gives no milestone for moving from one stage to the next, no timing, and no figure for the paid beta. It does not say whether earlier segments are still served once the next stage starts.
What a founder can adapt: Put the milestone on each arrow: "Mid-market once [N] paying beta customers and [retention measure]"; "Enterprise sales hire when [deal size or inbound enterprise demand] reaches [X]."
Supporting analysis
What the deck claims: "Starting with startups, small businesses and individuals we are planning to expand within the vertical, targeting medium businesses and enterprises." Launch Early Stage: "Offer paid beta with referral benefits to acquire first customers and gather the usage feedback." Go Up Mid-size Market: "Grow brand awareness and reputation. Focus on customer success and automated outreach for mid-sized organizations." Focus on Enterprises: "Target Fortune 500 and get large contracts with enterprises through dedicated sales team."
Presentation choice: It separates the first step (paid beta with referrals) from later ambitions, which is clearer than listing every channel at once.
When it does not fit: Fortune 500 contracts as a third stage, with no milestone, reads as a destination, not a plan.
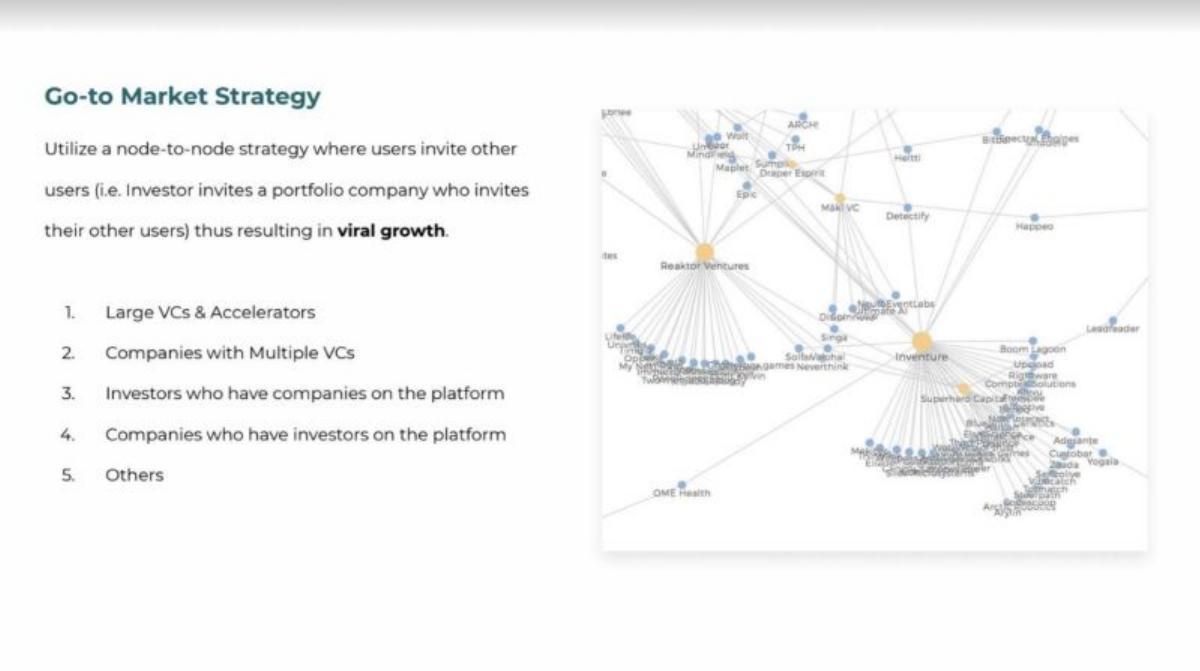
Portfolio reporting software for investors and startups; seed deck (2021) according to our teardown record. Text beside a network diagram.
Rundit deck, slide 8. Exact stored slide matched to this analysis.
Our analysis: A single, invite-led route, with a priority order that starts where one sign-up brings the most others (large investors with many portfolio companies).
Evidence and limitation: The diagram shows connections between named investors and companies, and a clear priority order. The slide does not say how many invites were sent or accepted, how many invited companies became paying users, or whether the diagram shows current users or prospects. "Viral growth" is the company's expected outcome, not a measured rate.
What a founder can adapt: Add one measured loop: "Each investor who joins invites [N] companies on average; [X]% join within [period]." Say who pays: the investor, the company or both.
Supporting analysis
What the deck claims: "Utilize a node-to-node strategy where users invite other users (i.e. Investor invites a portfolio company who invites their other users) thus resulting in viral growth." Target order: "1. Large VCs & Accelerators 2. Companies with Multiple VCs 3. Investors who have companies on the platform 4. Companies who have investors on the platform 5. Others." The diagram shows named investors (for example Reaktor Ventures, Inventure, Superhero Capital) linked to many company names.
Presentation choice: The priority list explains why the first targets matter: each one opens a network, which is a specific reason for the order.
When it does not fit: Calling growth viral before showing an invite rate turns a hypothesis into a claim.
Payment fraud prevention software for businesses; 2023 seed deck according to our teardown record.
CorgiAI deck, slide 9. Exact stored slide matched to this analysis.
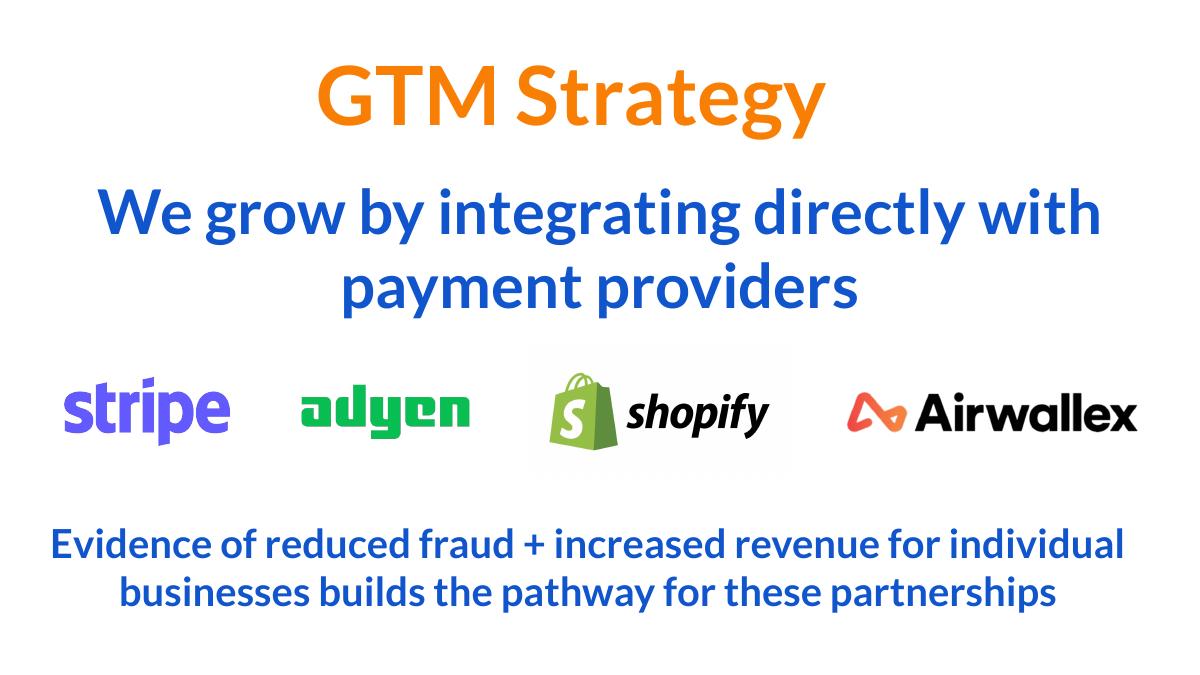
Our analysis: A partner-channel route with an order implied by the last line: win individual businesses first, then use their results to get payment providers to distribute the product. The first step is the one the slide leaves out.
Evidence and limitation: The logos are not labelled as current partners, integrations in progress or targets, and the last line describes partnerships as something to be built from evidence. The slide gives no fraud-reduction or revenue figure. How individual businesses are acquired before any partnership exists is not shown.
What a founder can adapt: Label each logo (live integration, in discussion, target) and add the first motion: "Until a provider partnership, we sell to [segment] through [route]; [N] businesses live, fraud down [X]% over [period]."
Supporting analysis
What the deck claims: "GTM Strategy." "We grow by integrating directly with payment providers." Logos: Stripe, Adyen, Shopify, Airwallex. "Evidence of reduced fraud + increased revenue for individual businesses builds the pathway for these partnerships."
Presentation choice: A single, specific channel is easier to evaluate than a list, and the slide says what evidence the partnerships depend on.
When it does not fit: Large partner logos without a status can be read as signed partnerships. Say which they are.
All-in-one workspace software for product teams. The same slide appears in a second Fibery deck in our library.
Fibery deck, slide 10. Exact stored slide matched to this analysis.
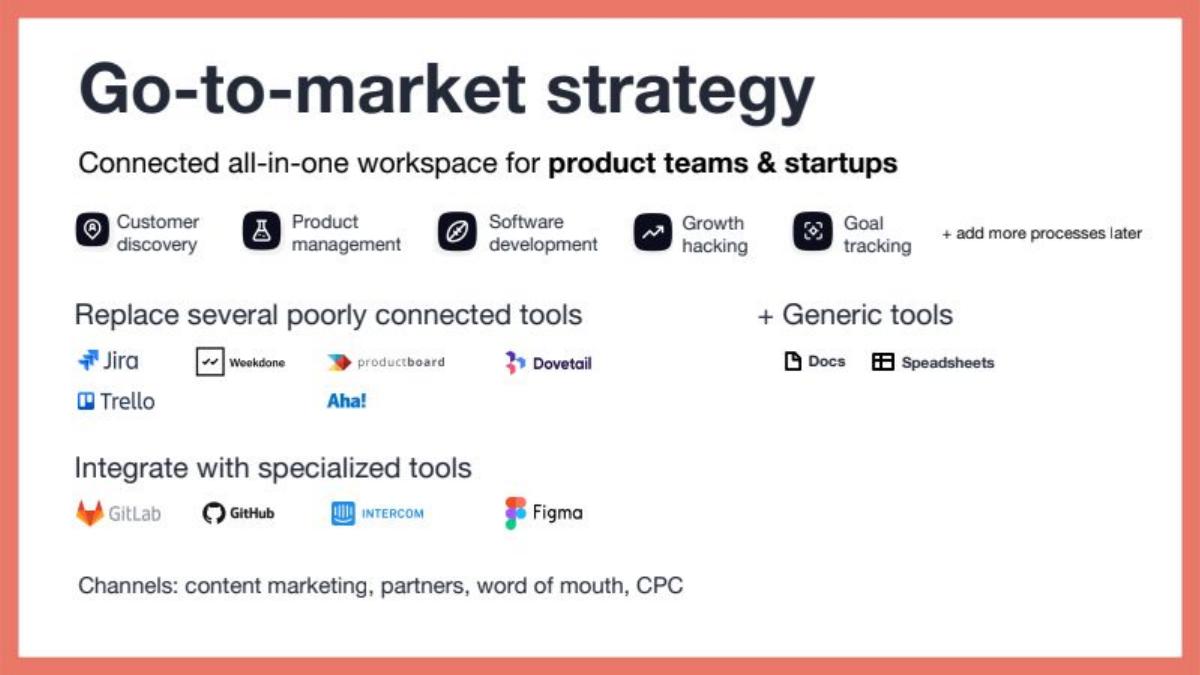
Our analysis: A clear target (product teams and startups) and a clear replacement story, but the go-to-market part is a list. It shows the difference between positioning and a plan for reaching customers.
Evidence and limitation: Most of the slide describes positioning: which tools Fibery replaces and which it connects to. The four channels share one line with no priority, split or result, and nothing on the slide says whether sales are self-serve or assisted.
What a founder can adapt: Move the replace-or-integrate map to the competition slide, and use this slide for the route: which channel brings most sign-ups, and when a salesperson gets involved.
Supporting analysis
What the deck claims: "Go-to-market strategy. Connected all-in-one workspace for product teams & startups." Processes: Customer discovery, Product management, Software development, Growth hacking, Goal tracking, "+ add more processes later". "Replace several poorly connected tools": Jira, Trello, Weekdone, productboard, Aha!, Dovetail; "+ Generic tools": Docs, Spreadsheets. "Integrate with specialized tools": GitLab, GitHub, Intercom, Figma. "Channels: content marketing, partners, word of mouth, CPC."
Presentation choice: Naming the tools a buyer drops and the ones they keep tells a reader where Fibery enters an account.
When it does not fit: Four channels in one line without a lead channel or numbers.
Whether each slide says who each path serves, what moves an account between paths, and gives any evidence.
Example
Motions shown
Who each path serves
Handoff rule
Evidence on slide
Craft.io
Self-serve, inside sales, enterprise onboarding
By deal value (undefined)
Yes: email and in-app outreach to SQL
Named enterprise customers; no rates
Cloudsmith
Self-serve, mid-market, strategic sales
By subscription plan (from the drawing)
Not stated (arrows only)
None
ArchFormation
Three stages in sequence
By company size
Not stated
None
Rundit
Invites (one route)
Priority order of targets
Not applicable
Network diagram; no counts
CorgiAI
Payment-provider partners (one route)
Not stated
Implied: results before partnerships
None; logo status unlabelled
Fibery
Channel list
Product teams and startups
Not stated
None
Key Takeaways
If you sell in more than one way, say which customers each way is for.
State the rule that moves an account from self-serve to a salesperson: a deal size, a seat count, a usage signal. Define it.
Map your pricing plans to the way each is sold, as Cloudsmith does, then add what triggers an upgrade.
A sequence of stages (small businesses first, enterprises later) needs the milestone that starts the next stage.
A single route, such as invites or a partner channel, needs evidence that it works: a count, a rate, a signed partner.
A channel list without priorities is not a go-to-market plan.
Build your SaaS go-to-market slide
Start from how customers actually arrive and who talks to them.
Paths. Which ways do you sell today: self-serve, inside sales, field sales, partners? Which is live and which is planned?
Routing rule. What decides the path for a customer: seats, deal value, plan, company size? Give the threshold.
Handoff. What signal moves a self-serve account to a salesperson, and who acts on it?
Expansion. How does revenue grow inside a won account: more seats, more teams, a higher plan?
Evidence. One measured number per path: conversion rate, sales cycle, expansion, over a stated period.
Copyable framework: [Segment] sign up through [route]. Accounts above [threshold] go to [inside or field sales] after [signal]. We expand by [mechanism]. Today: [measure] over [period].
Illustrative example 1 — written by us
Before: Channels: content marketing, partners, word of mouth, paid search.
After: Product teams sign up through content and search. Accounts that reach [N] active users get a call from inside sales within [X] days. We expand by adding teams. [X]% of sign-ups became paying in [period].
What improved: Our illustrative rewrite; all bracketed figures are placeholders, not company facts. It names the lead route, the routing rule and the handoff, and leaves room for one measured result.
What this guide adds
The general go-to-market guide covers choosing a first segment and a channel, and matching the channel to price (for example, self-serve for low-priced software and direct sales for infrastructure). The customer acquisition guide covers channel costs and early numbers. This guide covers a question specific to software companies that run several motions at once: how customers are routed between them, and how the slide shows the handoff.
The SaaS business model, traction and competition guides cover other slides in software decks.
Three things a multi-motion slide should show
Who: which customers each path serves, in terms a reader can apply (company size, deal value, seats, plan).
Handoff: the signal that moves an account to the next path, and who acts on it. Craft.io names the mechanism (email and in-app outreach turning sign-ups into sales-qualified leads) but not the threshold.
Expansion: how revenue grows inside an account once it is won. Cloudsmith and Craft.io both mention land and expand or connecting to more teams; neither shows a figure.
How we read each slide
We quote the text on the slide images and describe diagrams from what is drawn. We have not checked company claims. None of these slides was in our stored image set, so we rendered each one from the original deck file in our library; the pages shown are the ones quoted. Deck years come from our teardown records unless a slide shows its own date.
Common mistakes
No routing rule. Say which customers go self-serve and which get a salesperson.
Undefined thresholds. "Large value" or "enterprise" needs a number: seats, annual value or company size.
Arrows without triggers. A plan ladder or stage sequence needs the event that moves a customer or the company to the next step.
Hypothesis as result. "Viral growth" or "land and expand" is a plan until you show a rate.
Unlabelled partner logos. Mark each as live, in discussion or a target.
Positioning in place of a route. Which tools you replace belongs on the competition slide.
Diagnostic checklist
Names each path and whether it is live or planned.
States the rule that assigns a customer to a path, with a threshold.
Shows the signal that hands an account from self-serve to sales.
Says how revenue expands inside an account.
Gives at least one measured number with its period.
Frequently asked questions
Should a SaaS startup have both self-serve and sales?
Many do, but the slide should say which customers go down each path and what moves an account from one to the other. Craft.io routes customers by deal value and turns sign-ups into sales leads through email and in-app outreach.
How do I show product-led growth on a go-to-market slide?
Show the route from sign-up to paying customer and the point where a salesperson gets involved, with one measured rate. A plan ladder, as in Cloudsmith's deck, works well if you add what triggers an upgrade.
How we chose these examples
Corpus: published pitch deck teardowns on StartupFundraising.com. Founder-uploaded private decks are excluded.
Selection (2026-09-26): candidates came from earlier searches of teardown slide text for go-to-market headings in software decks (cloudsmith p14, craft-io p10, fibery p10, corgiai p9, rundit p8, archformation p7, conextvr p7, naraway p8, carta-healthcare p11). This topic was set aside on 2026-09-25 because none had a stored image and because imaged go-to-market slides overlapped the general guides. Rendering from the deck files solves the image gap; the question here (routing between motions) is different from the channel and segment lessons of the general guides.
We inspected ten slide pages and kept six companies. Excluded: Fibery's second deck (same slide), ConextVR p7 (event marketing channels, same lesson as the general guide), Naraway p8 (four equal pillars, same lesson as Fibery), Carta Healthcare p11 (a platform-and-apps product map, not a go-to-market route).
None of the chosen pages was in our stored image set; we rendered them from the original deck PDFs in our library and stored them with the existing slide-image workflow.
Review: slide images were checked on 2026-09-26 and matched to company, deck and page (editorial model review). No person has yet completed an editorial review of this page. We make no claim that any slide caused a fundraising outcome.