Web3 Market Slide Examples: Crypto and Blockchain Market
How crypto, NFT and blockchain pitch decks size their market, cite sources and handle headwinds. Six real web3 market slides compared.
Web3 Market Slide Examples: Crypto and Blockchain Market Size
Six market and opportunity slides from real crypto, NFT and blockchain pitch decks, shown in full, compare how each sizes the market, where the numbers come from, and whether the slide connects the market to the company.
TL;DR
A web3 market slide is most convincing when it prints the source of every number and ties the market to what the company sells. Hexlant shows blockchain market value growing from $2.3 billion to $17 billion, with the research firm and a Deloitte survey named on the slide. Aladino goes further and devotes the slide to headwinds in its own market, each with a link. Glow Labs and CoinMall give large figures ($17.7 billion in NFT sales, a $100 billion digital products market) with no source, and CoinMall's figure is not a crypto market at all. AGV Protocol uses named institutions instead of numbers, and Clutch's "Opportunity" slide has no market figure.
Web3 market slides from real pitch decks
Each example shows the exact stored slide above its analysis and links to the full teardown. Stage and year are given only where the deck states them. Market figures are quoted as the slide states them; we have not checked them against the cited research.
Hexlant (Octet) market slide — slide 3
Blockchain infrastructure for enterprises. Stage and year not stated.
Hexlant deck, slide 3. Exact stored slide matched to this analysis.
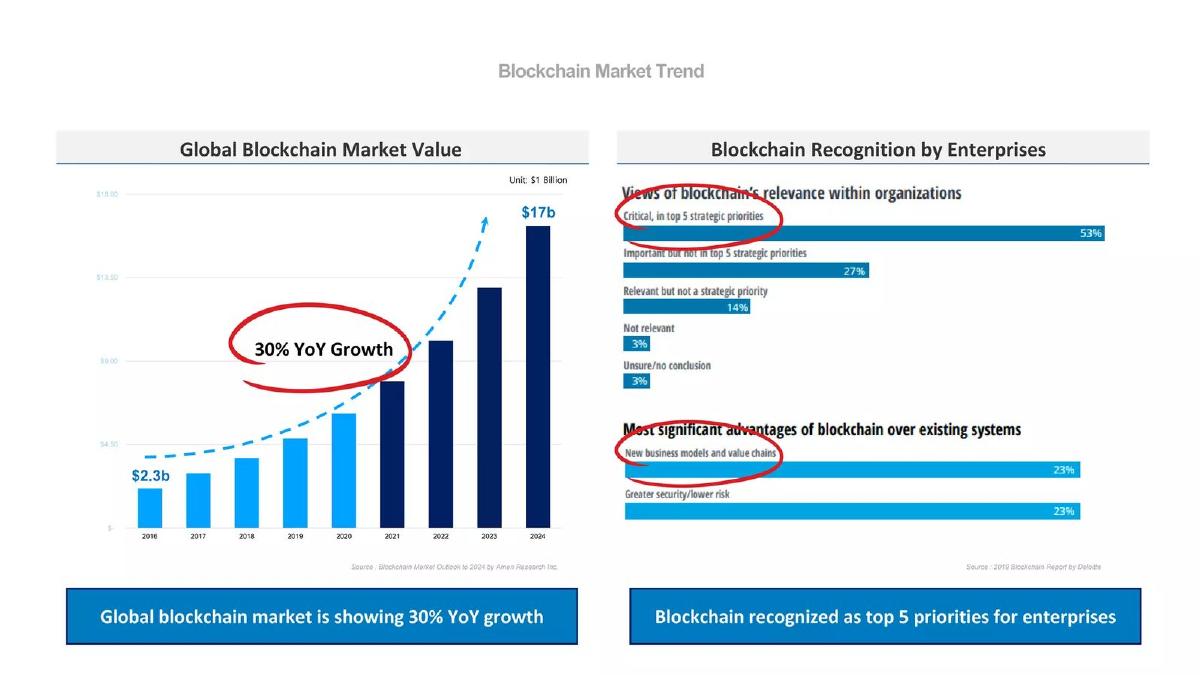
Our analysis: Both panels name their source, and the right panel supports the company's enterprise focus: it shows that the buyers it sells to rank blockchain as a priority, not just that the market is big.
Evidence and limitation: The slide doesn't say how much of the $17 billion Hexlant can reach, and the 2021 to 2024 bars are forecasts, which the slide doesn't label.
What a founder can adapt: Pair a sourced market size with one sourced fact about your specific buyers.
Supporting analysis
What the deck claims: "Blockchain Market Trend". Left: "Global Blockchain Market Value", bars from $2.3b (2016) to $17b (2024), "30% YoY Growth", source "Blockchain Market Outlook to 2024 by Amen Research Inc." Right: "Blockchain Recognition by Enterprises", 53% call blockchain "Critical, in top 5 strategic priorities", source "2019 Blockchain Report by Deloitte".
Presentation choice: Both panels name their source, and the right panel supports the company's enterprise focus: it shows that the buyers it sells to rank blockchain as a priority, not just that the market is big.
When it does not fit: The slide doesn't say how much of the $17 billion Hexlant can reach, and the 2021 to 2024 bars are forecasts, which the slide doesn't label.
Aladino deck, slide 3. Exact stored slide matched to this analysis.
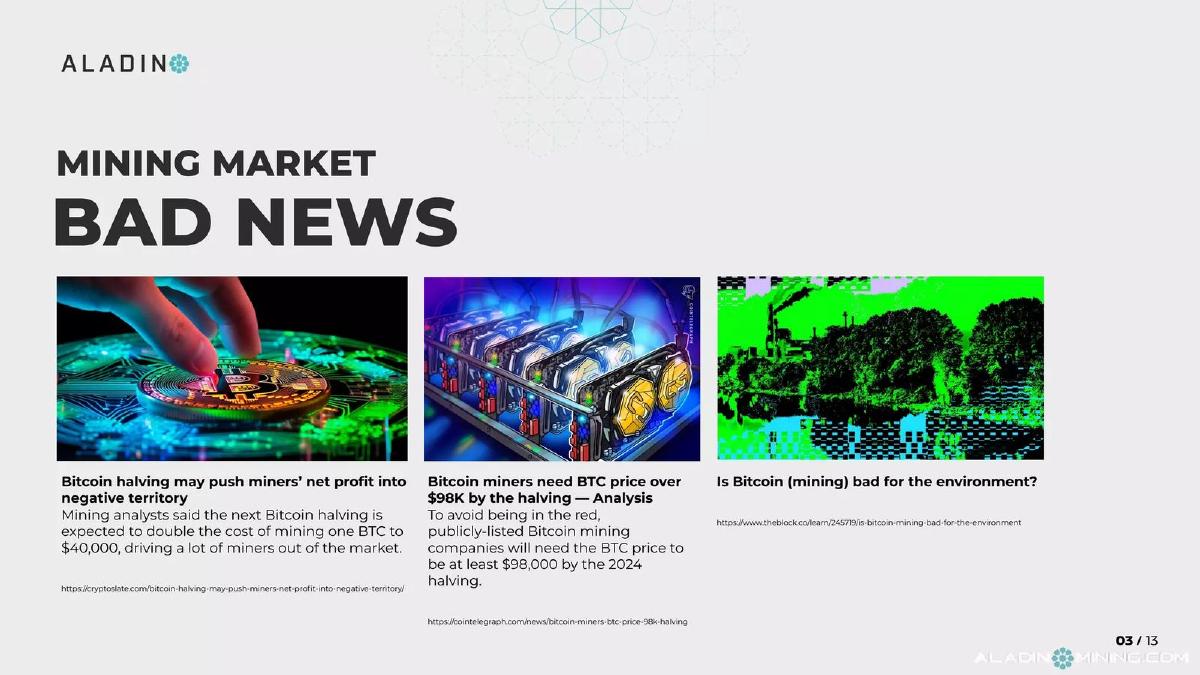
Our analysis: The slide raises the objections an investor would bring up anyway, with a source for each, and sets up the next slides to answer them.
Evidence and limitation: It gives no market size at all, and news articles are weaker sources than research. The answer to each headwind needs to follow quickly.
What a founder can adapt: If your market has a well-known risk, name it with a source, then show how you handle it.
Supporting analysis
What the deck claims: "Mining Market Bad News": "Bitcoin halving may push miners' net profit into negative territory" (halving expected to double the cost of mining one BTC to $40,000); "Bitcoin miners need BTC price over $98K by the halving"; "Is Bitcoin (mining) bad for the environment?" Each headline has its article URL printed beneath it.
Presentation choice: The slide raises the objections an investor would bring up anyway, with a source for each, and sets up the next slides to answer them.
When it does not fit: It gives no market size at all, and news articles are weaker sources than research. The answer to each headwind needs to follow quickly.
Web3 loyalty rewards for NFT communities. The web3 problem and team guides use different slides from this deck.
Glow Labs deck, slide 5. Exact stored slide matched to this analysis.
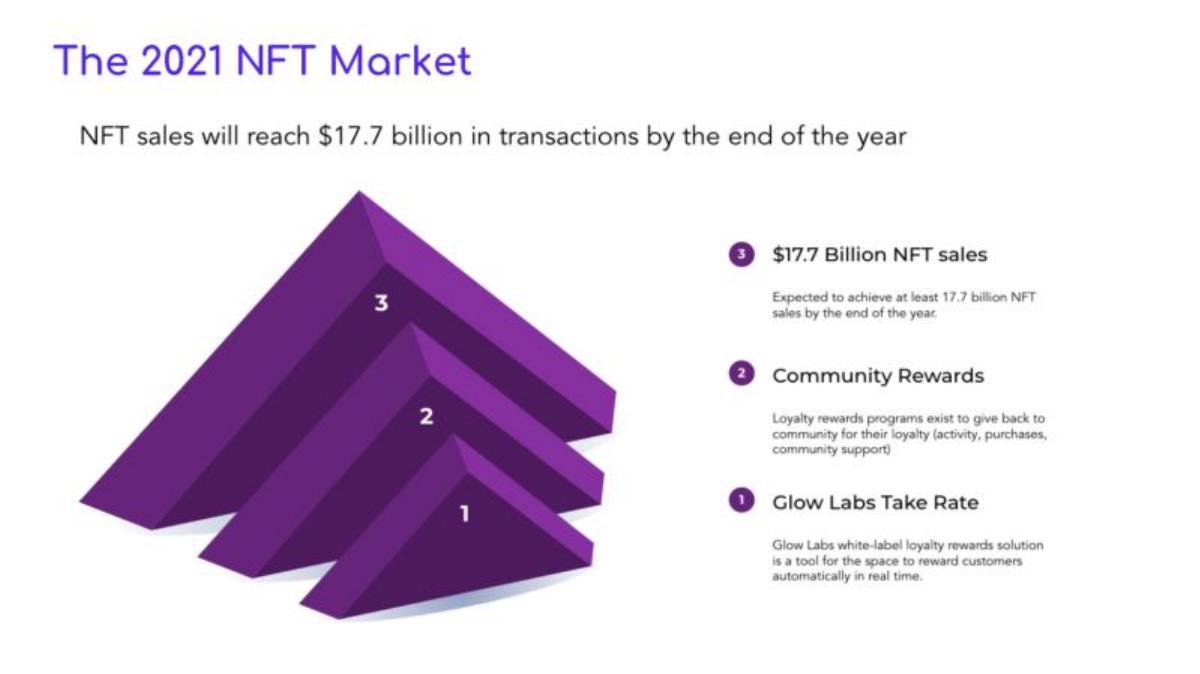
Our analysis: The pyramid moves from the whole NFT market to Glow Labs' own revenue, which is the right structure for a market slide.
Evidence and limitation: Only the top level has a number, and it has no source. NFT sales volume isn't what a loyalty tool earns from, so the middle and bottom levels are where the figures matter.
What a founder can adapt: Keep the funnel, but put a number and a source on every level.
Supporting analysis
What the deck claims: "The 2021 NFT Market": "NFT sales will reach $17.7 billion in transactions by the end of the year." A three-level pyramid: 3, $17.7 billion NFT sales; 2, community rewards; 1, Glow Labs take rate ("white-label loyalty rewards solution").
Presentation choice: The pyramid moves from the whole NFT market to Glow Labs' own revenue, which is the right structure for a market slide.
When it does not fit: Only the top level has a number, and it has no source. NFT sales volume isn't what a loyalty tool earns from, so the middle and bottom levels are where the figures matter.
Marketplace for digital goods paid in cryptocurrency. The web3 business model and marketplace problem guides use different slides from this deck.
CoinMall deck, slide 6. Exact stored slide matched to this analysis.
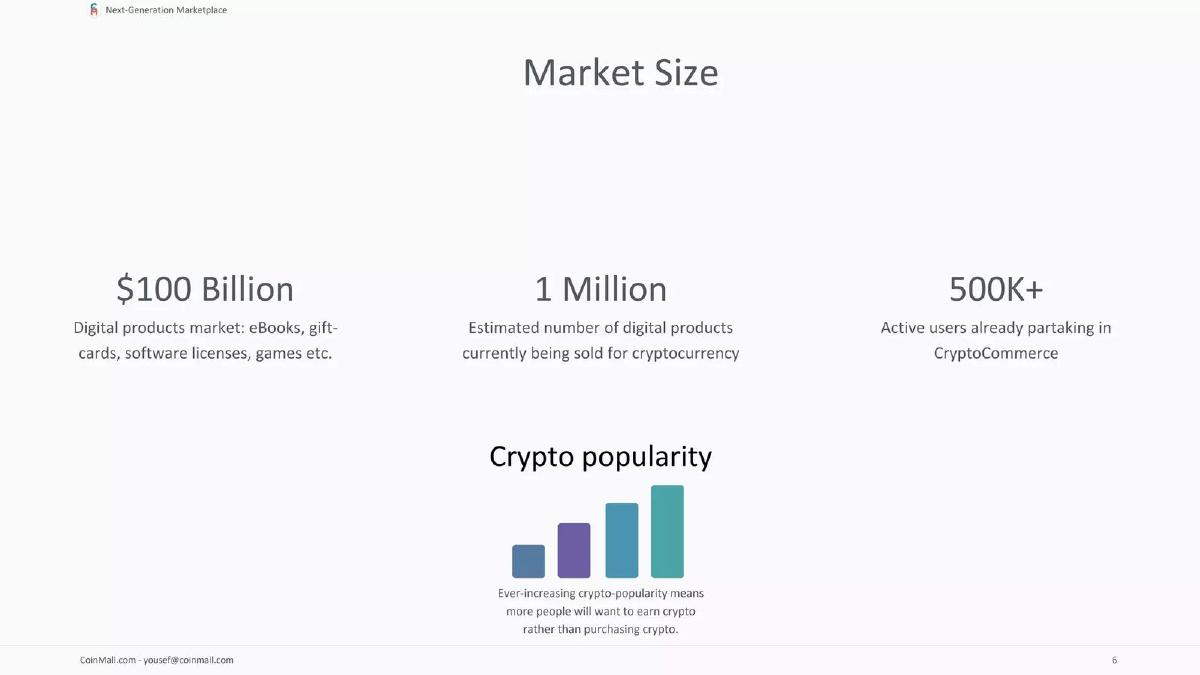
Our analysis: The three numbers move from the wide market to the crypto-paying slice, which is the part CoinMall can actually serve.
Evidence and limitation: No number has a source or a year, the $100 billion figure is the whole digital products market rather than crypto commerce, and the chart has no axis or values.
What a founder can adapt: Lead with the slice that fits your product, like the number of crypto buyers, and give its source.
Supporting analysis
What the deck claims: "Market Size": "$100 Billion" digital products market (eBooks, gift cards, software licenses, games); "1 Million" estimated digital products currently sold for cryptocurrency; "500K+" active users in crypto commerce. An unlabeled "Crypto popularity" bar chart.
Presentation choice: The three numbers move from the wide market to the crypto-paying slice, which is the part CoinMall can actually serve.
When it does not fit: No number has a source or a year, the $100 billion figure is the whole digital products market rather than crypto commerce, and the chart has no axis or values.
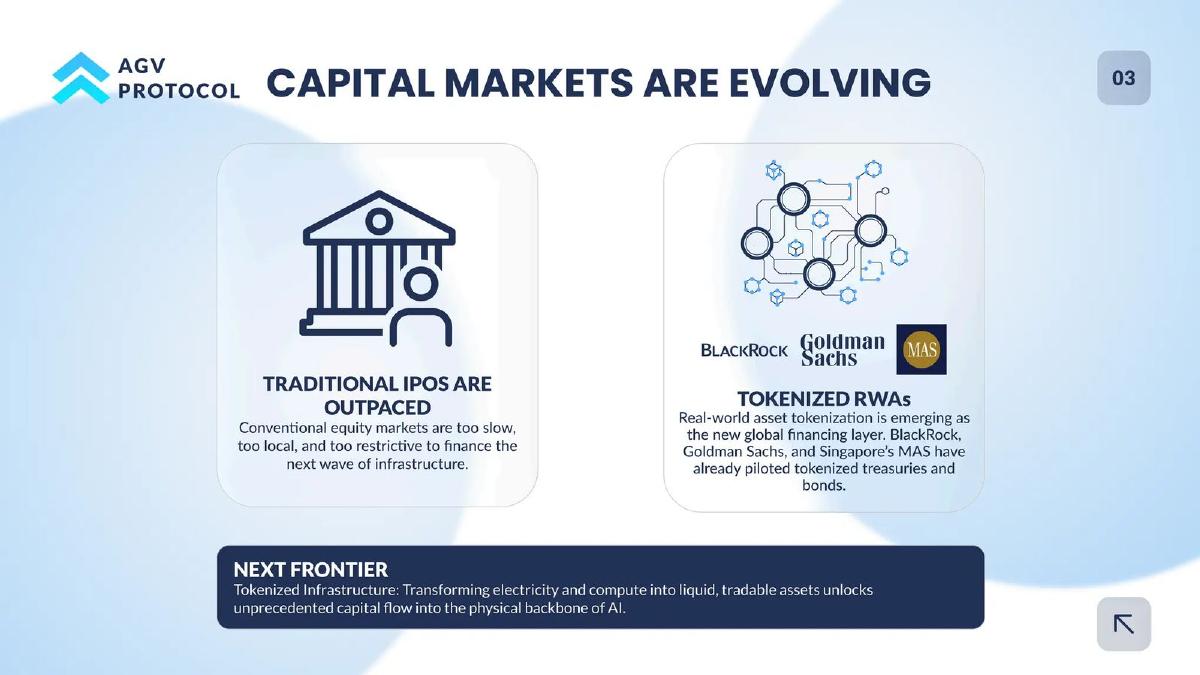
Tokenized infrastructure assets. The file name marks it as an institutional deck; stage not stated.
AGV Protocol deck, slide 4. Exact stored slide matched to this analysis.
Our analysis: For institutional readers, naming large institutions that have run pilots shows the category is being taken seriously.
Evidence and limitation: There is no market size, no date for the pilots and no source, and the claim that IPOs are "outpaced" is asserted rather than shown.
What a founder can adapt: If you cite institutions, add what they did and when, and a figure for the market that results.
Supporting analysis
What the deck claims: "Capital Markets Are Evolving": "Traditional IPOs are outpaced"; "Tokenized RWAs": real-world asset tokenization "is emerging as the new global financing layer. BlackRock, Goldman Sachs, and Singapore's MAS have already piloted tokenized treasuries and bonds." "Next Frontier": tokenized electricity and compute.
Presentation choice: For institutional readers, naming large institutions that have run pilots shows the category is being taken seriously.
When it does not fit: There is no market size, no date for the pilots and no source, and the claim that IPOs are "outpaced" is asserted rather than shown.
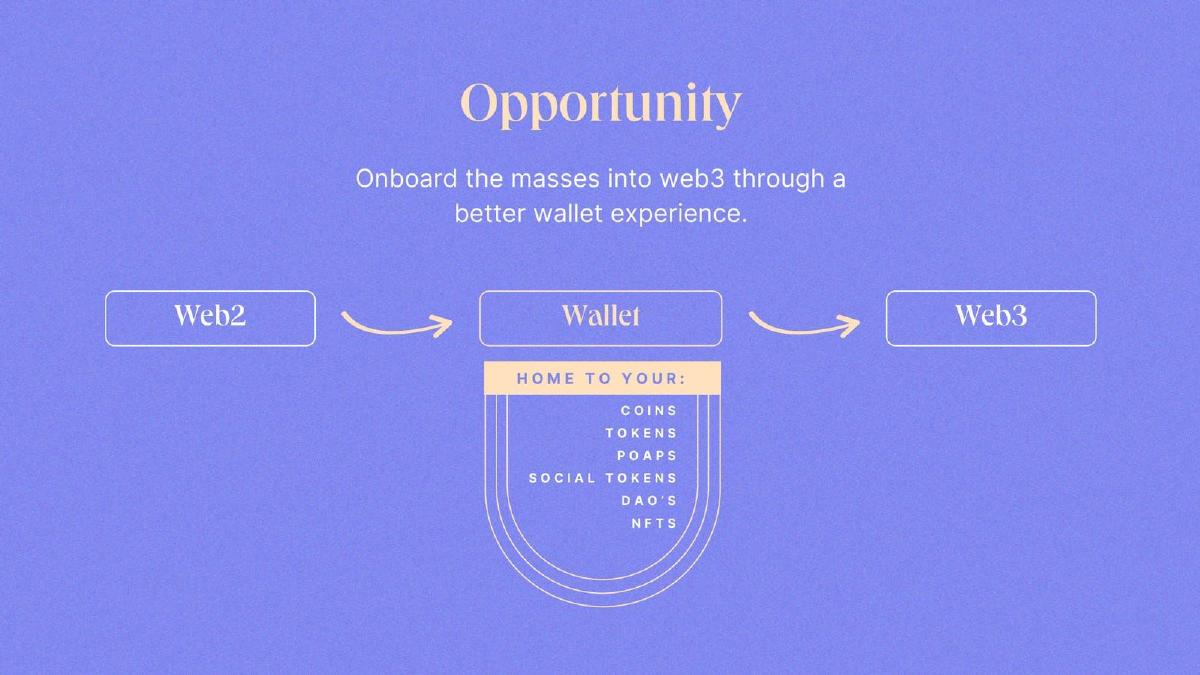
Crypto wallet. The fintech business model guide uses a different slide from this deck.
Clutch deck, slide 4. Exact stored slide matched to this analysis.
Our analysis: It states the company's thesis in one line and makes the product's role easy to see.
Evidence and limitation: A slide titled "Opportunity" with no number leaves an investor to guess how big the opportunity is.
What a founder can adapt: Keep the one-line thesis, and add how many people or dollars the "masses" represent, with a source.
Supporting analysis
What the deck claims: "Opportunity": "Onboard the masses into web3 through a better wallet experience." Diagram: Web2 → Wallet → Web3, with the wallet as "home to your" coins, tokens, POAPs, social tokens, DAOs and NFTs.
Presentation choice: It states the company's thesis in one line and makes the product's role easy to see.
When it does not fit: A slide titled "Opportunity" with no number leaves an investor to guess how big the opportunity is.
Sources and a link to the company's own revenue matter more than the size of the headline figure.
Example
Market figure
Source on slide
Tied to company revenue
Addresses risk
Hexlant
$2.3b to $17b, 30% YoY
Yes (Amen Research, Deloitte)
Partly (buyer priority)
No
Aladino
None
Yes (article links)
No
Yes
Glow Labs
$17.7b NFT sales
No
Structure only
No
CoinMall
$100b, 1M products, 500K+ users
No
Partly
No
AGV Protocol
None
No
No
No
Clutch
None
No
No
No
Key Takeaways
Crypto market figures swing with prices, so print the source and the date next to every number.
A headline market (all NFT sales, all blockchain spending) is not the company's market. Show the slice you can earn revenue from.
Naming headwinds you have a plan for can build more trust than a rising chart.
Named institutions can show a market is real, but they don't size it.
A mission line is not a market slide. If the slide is titled "Market" or "Opportunity", give at least one sourced number.
Build your web3 market slide
Answer these before designing the slide.
Headline. What is the broad market figure, who published it and when?
Your slice. Which part of that market pays for what you sell (fees, take rate, subscriptions)?
Buyers. How many buyers of your kind exist, and where does that count come from?
Volatility. Does the figure depend on token prices? Say which year or price it assumes.
Risk. Which headwind will investors raise, and what is your answer?
Copyable framework: [Market] was [$X] in [year] ([source]). We earn from [revenue line], worth [$Y] across [N] [buyers] ([source]).
Illustrative example 1 — written by us
Before: $17.7 Billion NFT sales · Community Rewards · Glow Labs Take Rate
After: NFT sales: [$X, year, source] · Communities running rewards: [N, source] · Our take rate: [%] of [base]
What improved: Our illustrative rewrite, not Glow Labs' text. Bracketed parts are placeholders, not company facts. It puts a sourced number on every level of the funnel.
How this guide relates to the other market and web3 guides
The TAM, SAM and SOM guide and the bottom-up market guide cover sizing methods for any company. The web3 problem, solution, business model and traction guides cover other slides in crypto decks. This guide covers what is specific to web3 market slides: volatile figures that date quickly, headline markets that are far larger than what a startup can earn, and the use of institutions or headwinds in place of a size.
Common mistakes
No source or date. Crypto figures move fast. Print where each came from and when.
Headline market as your market. Total NFT or blockchain volume isn't your revenue base.
Unlabeled forecasts. Mark which bars are projections.
Names instead of numbers. Institutions show interest, not size.
"Opportunity" with no figure. Give at least one sourced number.
Diagnostic checklist
Every market figure has a source and a year.
The slide shows the slice the company earns from, not just the headline market.
Forecasts are labeled as forecasts.
Known risks are named and answered.
The one-line thesis is backed by a number.
Frequently asked questions
How we chose these examples
Corpus: published pitch deck teardowns on StartupFundraising.com. Founder-uploaded private decks are excluded.
Selection (2026-09-28): we searched extracted slide text for slides whose opening words include "market", "TAM" or "opportunity" and whose text mentions crypto, blockchain, DeFi, NFTs, tokens, web3 or bitcoin, with a stored slide image. Excluded: public-company decks, near-duplicate deck versions, and slides where crypto is mentioned only in passing.
Overlap check: no market-slide facet for web3 existed. Glow Labs, CoinMall and Clutch appear in other guides with different slides; the other three decks appear in no other guide.
Review: all six stored slide images were inspected on 2026-09-28 and matched to company, deck and slide number (editorial model review). Market figures are quoted from the slides and were not checked against the cited research. No person has yet completed an editorial review of this page.
We make no claim that any slide caused a fundraising outcome.