Footprint Map Slide: How to Show Where Your Startup
How do you show investors where you operate without overstating it? Five real slides show how to put a figure on each place, separate live from planned.
Footprint Map Slide: Put a Figure on Every Place, and Mark What Is Live
A map covered in pins or coloured regions is one of the most common slides in startup decks. It is meant to say "we are already in many places". Investors have learned to read it carefully, because a pin can mean almost anything: a paying customer, one employee, a partner who has signed nothing, or a plan. This guide uses five real slides to show how founders present where they operate, what makes a footprint map evidence rather than decoration, and how to avoid a map that looks larger than the business.
TL;DR
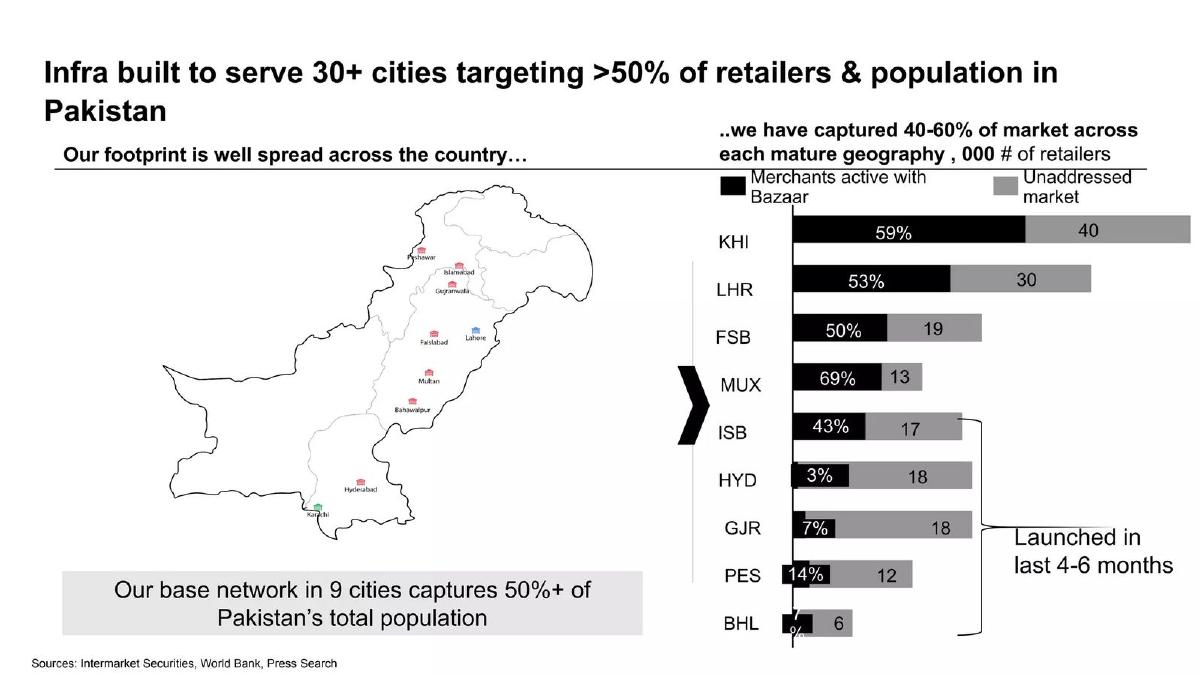
Put a figure on every place you mark, say what the figure counts, and separate places that are running from places you have just launched or only plan. Bazaar does this best: its map of Pakistan sits beside a bar for each city showing merchants active with Bazaar against the unaddressed market, from 59% in Karachi to 3% in Hyderabad, with the newest cities bracketed as "Launched in last 4-6 months".
Five footprint slides, read in full
Each slide was rendered from the original deck at full size and read in full. Figures are as the slides state them; we did not check them against outside sources.
Bazaar traction slide — slide 6
Retail ordering and supply app for shops in Pakistan. Footprint slide.
Bazaar deck, slide 6. Exact stored slide matched to this analysis.
Our analysis: The clearest footprint slide in the set.
Evidence and limitation: A share figure for every city; mature and new cities separated; sources printed.
What a founder can adapt: Add a merchant count per city and make the new-city bracket unambiguous.
Supporting analysis
What the deck claims: "Our footprint is well spread across the country..."; "..we have captured 40-60% of market across each mature geography, 000 # of retailers"; KHI 59% / 40, LHR 53% / 30, MUX 69% / 13; HYD 3%, GJR 7%, PES 14%, BHL 7% "Launched in last 4-6 months"; "Sources: Intermarket Securities, World Bank, Press Search".
Presentation choice: Shows depth as well as breadth, and is honest about new cities.
When it does not fit: Pins on a map with no figure behind them.
Clothing manufacturing platform. Global presence slide.
Fashinza deck, slide 4. Exact stored slide matched to this analysis.
Our analysis: Better than pins, but logos stand in for figures.
Evidence and limitation: Named customers per region; factories marked separately; no counts; title disagrees with map.
What a founder can adapt: Add customer counts and revenue share per region, and match the title to the boxes.
Supporting analysis
What the deck claims: "Strong global presence across North America, MENA and South East Asia"; boxes "North & South America", "Middle East and North Africa", "Europe", "Indian Subcontinent" with customer logos and "...and many more"; "Fashinza Factory Base": India, Bangladesh, Vietnam, Turkey.
Presentation choice: Shows the value of separating customers from operations on one map.
When it does not fit: A title naming regions the map doesn't support.
Security services for hemp and cannabis businesses, 2019. Footprint slide.
Patriot Shield deck, slide 14. Exact stored slide matched to this analysis.
Our analysis: A warning: live and hoped-for states look the same.
Evidence and limitation: Eight states in one colour; boxes range from operations to plans; no figures.
What a founder can adapt: Use two colours for live and planned, and add one figure per state.
Supporting analysis
What the deck claims: "OUR FOOTPRINT"; "COLORADO: Main Command Center for all operations..."; "MICHIGAN: Currently has robust security operations. Almost the 1st Transport License in the state!"; "OKLAHOMA: ...big partners ready to start growing".
Presentation choice: Shows how one colour for every state inflates a footprint.
When it does not fit: Colouring a state because a partner is "ready to start".
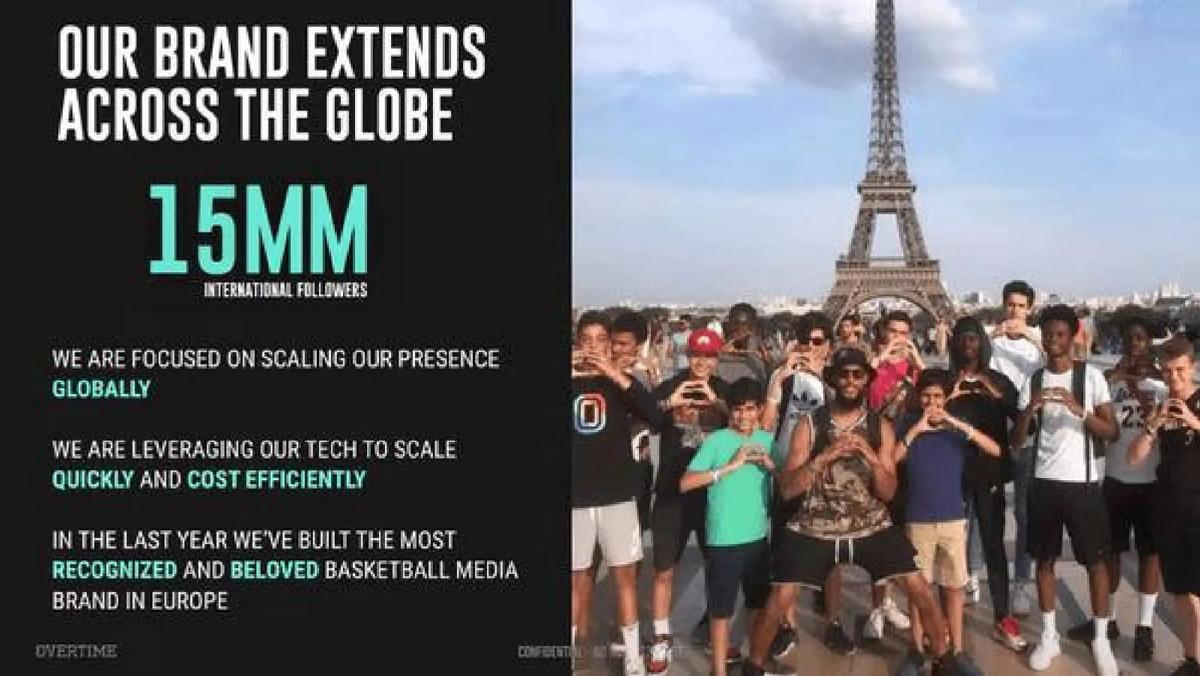
Overtime deck, slide 5. Exact stored slide matched to this analysis.
Our analysis: A warning: audience presented as presence.
Evidence and limitation: One follower total; no countries, platforms or revenue; superlative unmeasured.
What a founder can adapt: List top countries with followers per platform and any revenue there.
Supporting analysis
What the deck claims: "OUR BRAND EXTENDS ACROSS THE GLOBE"; "15MM INTERNATIONAL FOLLOWERS"; "IN THE LAST YEAR WE'VE BUILT THE MOST RECOGNIZED AND BELOVED BASKETBALL MEDIA BRAND IN EUROPE".
Presentation choice: Shows why followers need countries and platforms before they count as a footprint.
When it does not fit: "Across the globe" with one total and a photo.
Whether each slide gives a figure per place, says what a mark means, separates stages and matches its title.
Example
Figure per place
Mark explained
Live vs new vs planned
Title matches
Bazaar
Yes, share per city
Yes, legend
Yes, bracketed
Yes
Fashinza
Logos, no counts
Factories only
No
No
Patriot Shield
No
No
Mixed in boxes, same colour
Overstates
Ayekart
No
Business vs team
No
Yes
Overtime
One total
No map
No
Unmeasured
Key Takeaways
Every pin needs a figure: customers, revenue or share.
Say what a pin means in a legend.
Separate mature, new and planned places.
Make the title match what the map shows.
Followers or team locations are not a customer footprint.
Build your footprint slide
Answer each prompt before drawing the map.
Test. What must be true for a place to be marked: paying customers, revenue, a signed contract?
Figure. What one number will you show for each place?
Stage. Which places are established, which are new, and which are only planned?
Kinds. Are you showing customers, staff, factories or partners, and are they kept apart?
Title. Does the title name exactly the places the map supports?
Copyable framework: [Places marked] = [test]. [Place]: [figure] ([established/new since month]). Planned: [places] (see expansion slide). Source: [data], [month year].
Illustrative example 1 — written by us
Before: A map with pins in 12 cities titled "Nationwide presence".
After: "Cities with 50+ paying venues: Leeds 210, Manchester 140, Bristol 60 (launched May). Next: Glasgow, Cardiff (see expansion slide). Source: own data, March 2024."
What improved: Our illustrative rewrite; the figures are invented for the example. It states the test, a figure per city, which city is new, and moves plans to another slide.
The question this guide answers
Founders ask how to show investors where their company already operates: which cities, regions or countries, and how deep it goes in each. The international expansion guide covers a different question, choosing the next market and what must be true before entering it. The traction guides cover growth over time, not across places. None says how to build a map of today's footprint that an investor can trust.
The question matters because geography is easy to inflate. A map with pins in eight states looks like a national business even if seven of the pins are partners in talks. An investor who later learns what the pins meant will discount the rest of the deck. A map that counts something in each place, and is clear about what is new, does the opposite: it shows where the business works and where it is still being tested.
How we chose and read the examples
We searched saved slide text in the teardown library for phrases such as "our footprint", "our presence", "global presence", "where we operate" and "operating in" followed by a number of cities or countries. We left out listed companies, mining, energy, banking and shipping presentations, and slides that mention presence only in a sentence. Five slides from five startup decks remained: Bazaar (retail ordering in Pakistan), Fashinza (clothing manufacturing), Patriot Shield (hemp and cannabis security), Ayekart (agriculture and food supply) and Overtime (sports media).
Each slide was rendered from the original deck at full size and read in full. Quotes and figures are the slides' own. We did not check any figure against outside sources; this guide is about how clearly each slide shows where the company operates and what a reader can check.
The strongest pattern: a figure for every place
Bazaar, which runs an ordering and supply app for small shops in Pakistan, titles its slide "Infra built to serve 30+ cities targeting >50% of retailers & population in Pakistan". On the left, a map marks nine cities under the line "Our footprint is well spread across the country...". A box below adds "Our base network in 9 cities captures 50%+ of Pakistan's total population".
The right side is what makes the slide useful. Under "..we have captured 40-60% of market across each mature geography, 000 # of retailers", each city gets a bar split into "Merchants active with Bazaar" and "Unaddressed market". Karachi shows 59% with 40 thousand retailers unaddressed; Lahore 53% and 30; Faisalabad 50% and 19; Multan 69% and 13; Islamabad 43% and 17. A bracket groups the last four cities, Hyderabad (3%), Gujranwala (7%), Peshawar (14%) and Bahawalpur (7%), as "Launched in last 4-6 months".
Three things work. Every city on the map has a figure. The figure is a share of a named base, so the reader can judge depth as well as breadth. And the slide is honest that four of the nine cities are new and barely started. Sources are printed at the foot: "Intermarket Securities, World Bank, Press Search".
Two details could be clearer. The bars show the unaddressed market as an absolute figure but Bazaar's share only as a percentage, so the reader has to work out how many merchants Bazaar has in each city. And the bracket includes Islamabad in its sweep on the chart, which makes it unclear whether Islamabad counts as mature or new. One column of merchant counts and a cleaner bracket would fix both.
Customers by region, with a gap between title and map
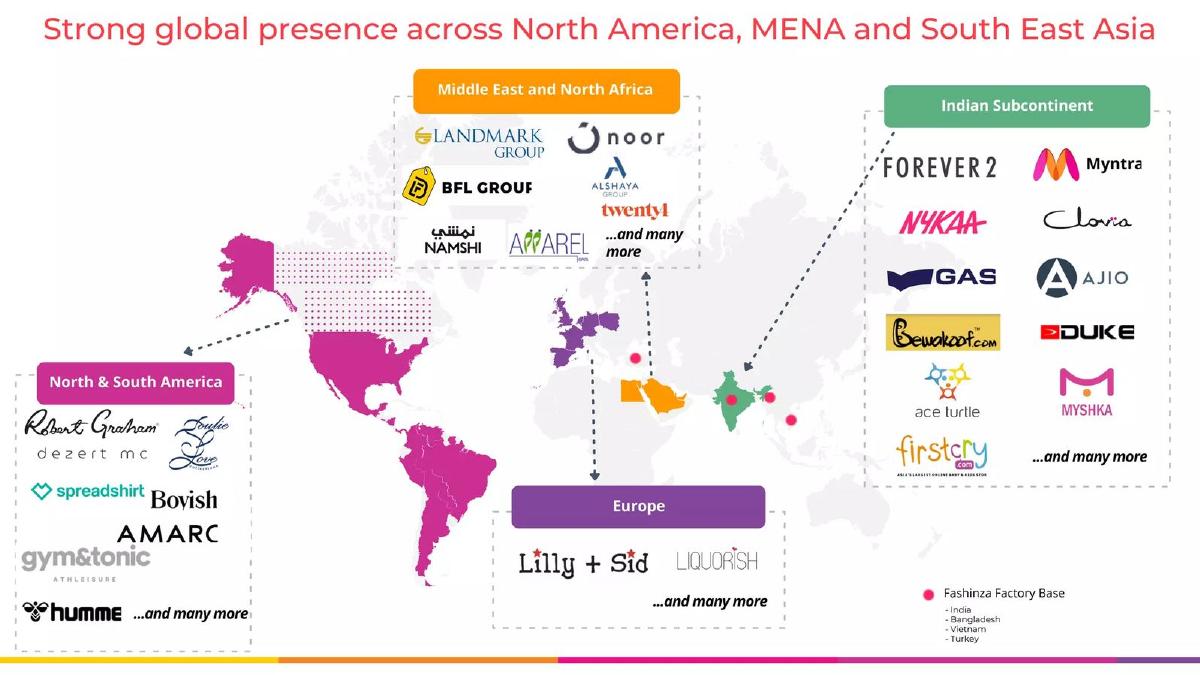
Fashinza, which connects clothing brands with factories, titles its slide "Strong global presence across North America, MENA and South East Asia". A world map has four coloured regions, each with a box of customer logos: "North & South America" (Robert Graham, Spreadshirt, Hummel and others), "Middle East and North Africa" (Landmark Group, Noon, Namshi and others), "Europe" (Lilly + Sid, Liquorish) and "Indian Subcontinent" (Myntra, Nykaa, Ajio, FirstCry and others). Each box ends with "...and many more". Red dots mark "Fashinza Factory Base": India, Bangladesh, Vietnam and Turkey.
This is better than pins alone, because each region names real customers a reader could look up. Separating customers from factory locations is also useful; they are different things and are easily confused on a map.
But the title and the map disagree. The title names South East Asia, which has no customer box, and leaves out the Indian subcontinent, which has the largest box. Europe is shown but not named. The slide also gives no revenue or order count per region, so a region with two logos looks as strong as one with fourteen. "...and many more" in every box is not a figure. A count of active customers and a share of revenue under each box would turn the logo map into evidence.
Warning: mixing what is live with what is hoped for
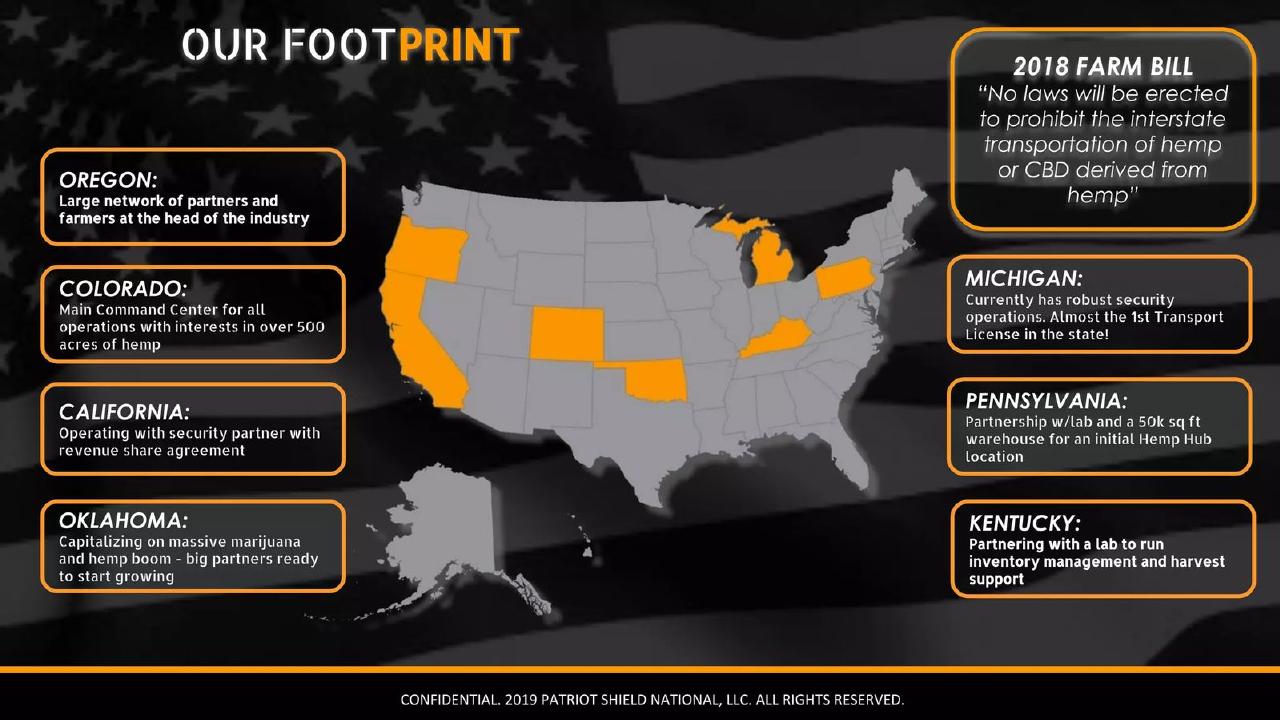
Patriot Shield, a security company serving hemp and cannabis businesses, shows "OUR FOOTPRINT" as a map of the United States with eight states coloured orange. Each has a box. Some describe operations: "COLORADO: Main Command Center for all operations with interests in over 500 acres of hemp"; "CALIFORNIA: Operating with security partner with revenue share agreement"; "MICHIGAN: Currently has robust security operations. Almost the 1st Transport License in the state!"
Others describe plans or relationships: "OKLAHOMA: Capitalizing on massive marijuana and hemp boom - big partners ready to start growing"; "KENTUCKY: Partnering with a lab to run inventory management and harvest support"; "PENNSYLVANIA: Partnership w/lab and a 50k sq ft warehouse for an initial Hemp Hub location"; "OREGON: Large network of partners and farmers at the head of the industry".
On the map all eight states are the same orange, so a reader sees eight states of operations. The boxes reveal that the company's own work ranges from a main operations centre to partners who are "ready to start". "Almost the 1st Transport License" means the licence was not held. No state has a figure: customers, contracts or revenue.
The fix is to use two colours, one for states with paying customers today and one for states with partners or plans, and to put one figure in each box. That would likely shrink the bright part of the map, but it would make every coloured state believable.
Two maps, no figures
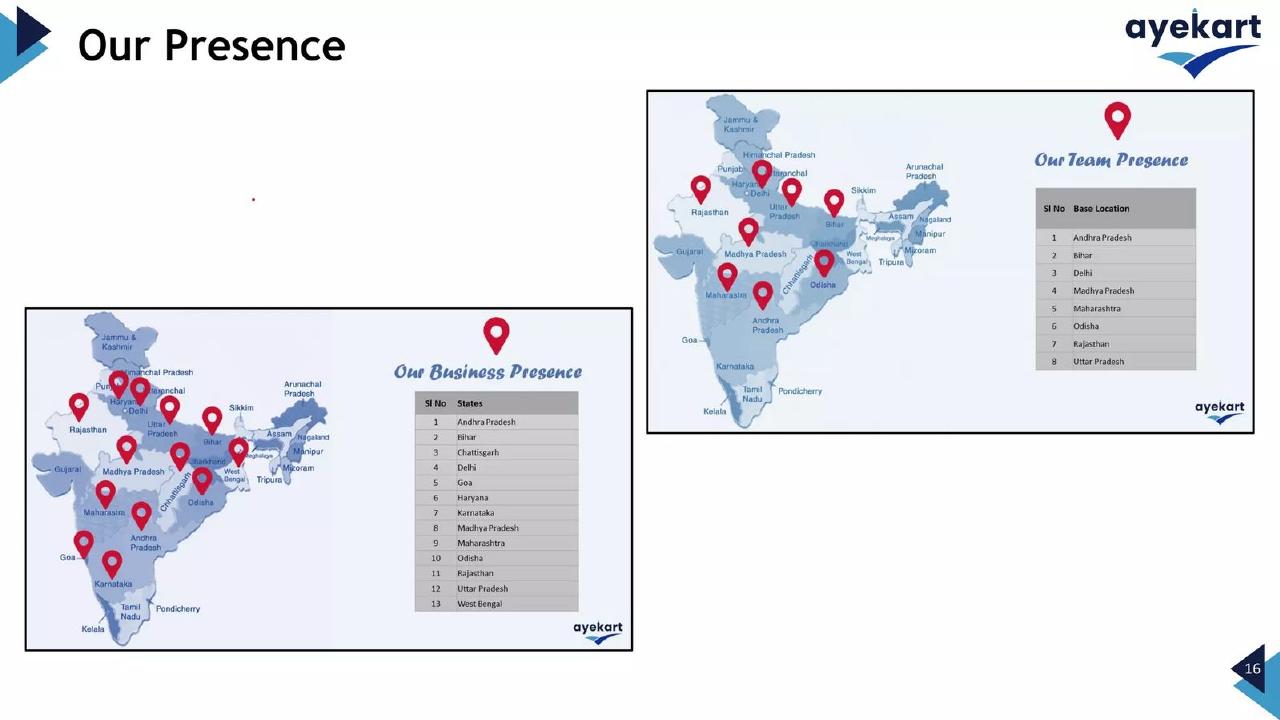
Ayekart, which provides farm-to-market supply and finance tools in India, titles its slide "Our Presence" and shows two maps. "Our Business Presence" pins 13 states and lists them in a table, from Andhra Pradesh to West Bengal. "Our Team Presence" pins 8 states and lists those as "Base Location".
Separating where the business serves from where staff sit is a good instinct. A reader can see that Ayekart serves five states where it has no team base, such as Goa, Karnataka and West Bengal, which raises a useful question about how those are served.
But neither map gives a figure. "Business presence" could mean one customer or a thousand. The two tables take up most of the slide, repeating the pins as lists. Replacing the tables with one column, such as farmers, buyers or transaction value per state, would answer the question the maps raise.
Warning: audience is not presence
Overtime, a sports media company, titles its slide "OUR BRAND EXTENDS ACROSS THE GLOBE". The main figure is "15MM INTERNATIONAL FOLLOWERS", next to a photo of young fans in front of the Eiffel Tower. The text reads "WE ARE FOCUSED ON SCALING OUR PRESENCE GLOBALLY", "WE ARE LEVERAGING OUR TECH TO SCALE QUICKLY AND COST EFFICIENTLY" and "IN THE LAST YEAR WE'VE BUILT THE MOST RECOGNIZED AND BELOVED BASKETBALL MEDIA BRAND IN EUROPE".
For a media company, international audience is a real asset, and the photo signals that fans exist outside the United States. But "followers" counts accounts across social platforms, not people or customers, and the slide doesn't say which countries they are in or how many are in Europe. "Most recognized and beloved" has no measure behind it.
A footprint slide for an audience business should name the top countries with follower or viewer counts per platform, and any revenue earned there. Without that, "across the globe" is a claim, not a footprint.
How to build your footprint slide
Decide what a place means. Before drawing the map, choose one test for marking a place: paying customers, active users above a threshold, revenue, or a signed contract. Put that test in a legend.
Put a figure on each place. A short bar, a number beside a pin or a small table works. Bazaar's share-of-market bars are the model; a simple count of customers per city is enough for most companies.
Separate stages. Use one colour or symbol for places that are established, another for places launched recently, and a third, or nothing at all, for plans. If you want to show plans, put them on the international expansion or roadmap slide instead.
Match the title to the map. If the title names regions, every named region should appear with evidence, and every region with evidence should be named.
Keep different things apart. Customers, staff, factories and partners are different kinds of presence. Fashinza separates factories from customers well; Ayekart separates team from business. Never let a reader assume a factory or an office means customers.
When a footprint map helps, and when it doesn't
A map helps most for businesses where place matters: delivery, retail supply, physical services, marketplaces that grow city by city, or companies selling across many countries. For these, depth in each place is a key question, and a map with figures answers it quickly.
It helps less for software sold online to customers anywhere. A world map with pins in 40 countries usually means a few customers found the product, not that the company has a presence there. For such companies, a short list of top countries by revenue share says more than a map.
If the footprint is small, say so plainly. One city with strong numbers is a better slide than ten pins with none. Investors usually prefer evidence that the model works in one place to a wide map with nothing behind it.
What a footprint map cannot show
A map shows where a company is, not whether it is profitable there or growing. Pair it with the traction slide's figures over time, and with unit economics if they differ by place.
It also can't show why the company chose those places. If the order matters, for example starting in the largest cities first, as Bazaar's population line suggests, explain that in one sentence on the slide or in the expansion section.
Common mistakes
Pins without figures. Put a count or share beside each place.
Plans coloured as live. Use a separate colour, or move plans to the expansion slide.
Mixed kinds of presence. Keep customers, staff, factories and partners apart.
Title overstates. Name only regions the map supports.
Audience as footprint. Give countries and platforms, not one follower total.
Diagnostic checklist
A stated test for marking a place.
A figure for every place marked.
Established, new and planned separated.
Customers kept apart from staff and factories.
Title matches the map.
Frequently asked questions
Should my pitch deck include a map of where we operate?
If place matters to your business, yes, with a figure for each place. For software sold anywhere online, a short list of top countries by revenue usually says more.
Can I show cities we plan to enter on the same map?
Only in a clearly different colour or style. It is usually better to put plans on the expansion or roadmap slide.
What figure should I show for each place?
The one that best shows depth: paying customers, revenue, share of the local market, or active users.
Is a small footprint a problem?
Not if it is deep. One city with strong figures is more convincing than many pins with none.
How we chose these examples
Corpus: published pitch deck teardowns on StartupFundraising.com. Founder-uploaded private decks are excluded.
Selection (2026-10-01): we searched extracted slide text for footprint, presence and operating-location phrases, excluded listed-company, mining, energy, banking and shipping presentations and passing mentions, and kept five slides from five startup decks.
Review: all five slides were rendered from the source decks at full size on 2026-10-01 and read in full against company, deck and page number (editorial model review, with AI assistance in drafting). No person has yet completed a human review. Figures were not checked against outside sources.