Bazaar’s deck is a masterclass in demonstrating scale and operational depth in an emerging market. By reporting 44BN in annualised GMV and a physical infrastructure spanning 750,000 square feet across 17 cities, the company positions itself as an unassailable incumbent rather than a speculative startup. The narrative moves beyond simple B2B commerce into high-margin territory, specifically fintech and data services. With 80,000+ monthly active merchants and a lending portfolio boasting a 0.5% NPL rate—significantly lower than the 3.2% industry average—Bazaar argues that its tech stack provide…
Key takeaways
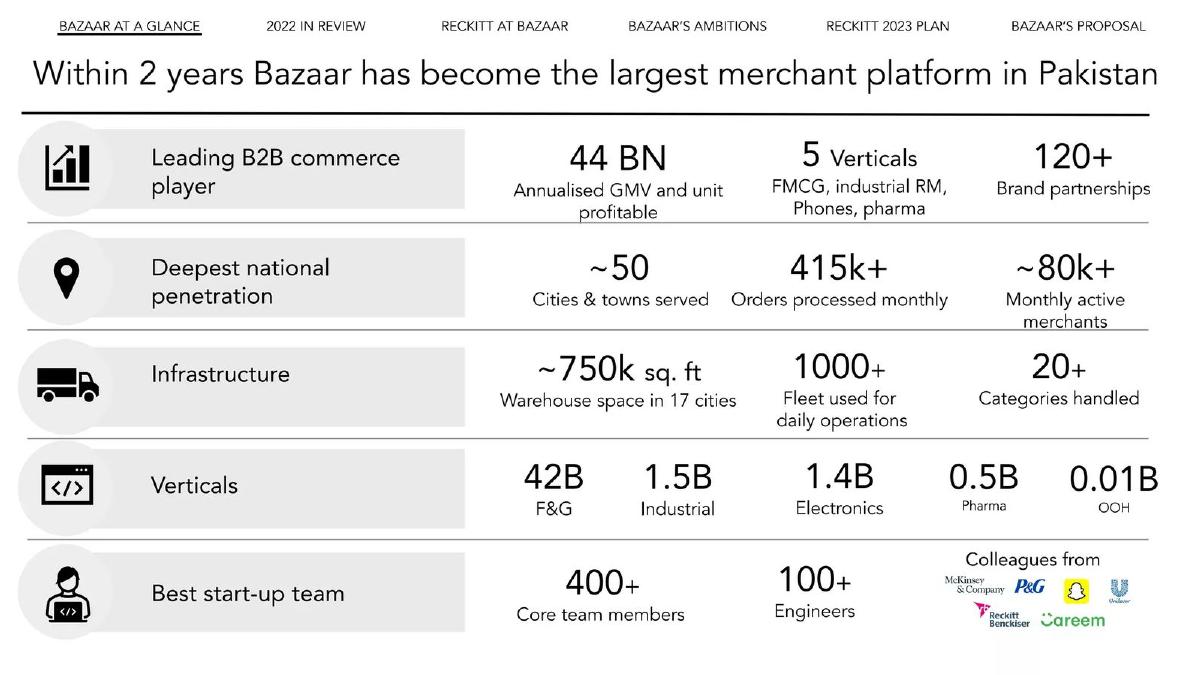
- Bazaar claims to be the largest merchant platform in Pakistan, reaching 44BN in annualised GMV within two years (Slide 2).
- The company operates a massive physical footprint with ~750k sq. ft of warehouse space and a 1000+ vehicle fleet (Slide 2).
- Digital penetration is high, with 80k+ monthly active merchants and 415k+ monthly orders processed (Slide 2).
- The product ecosystem is segmented into five distinct apps: Marketplace, Lending, Digital Ledger, Rider App, and Control Tower (Slide 3).
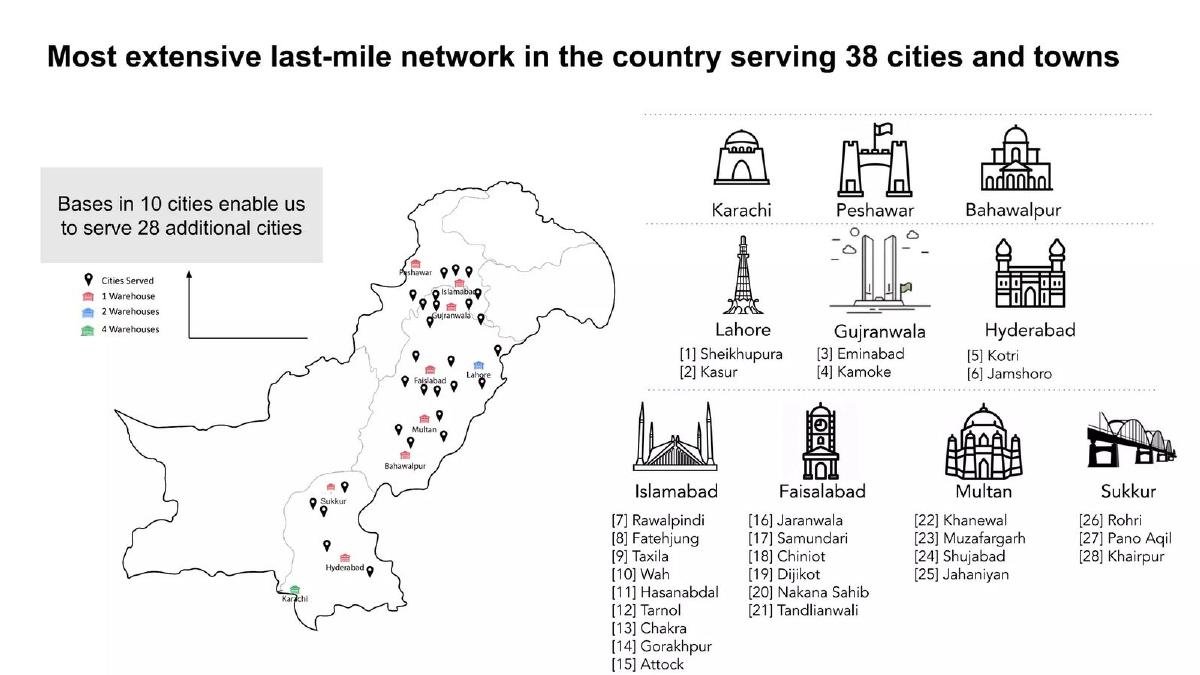
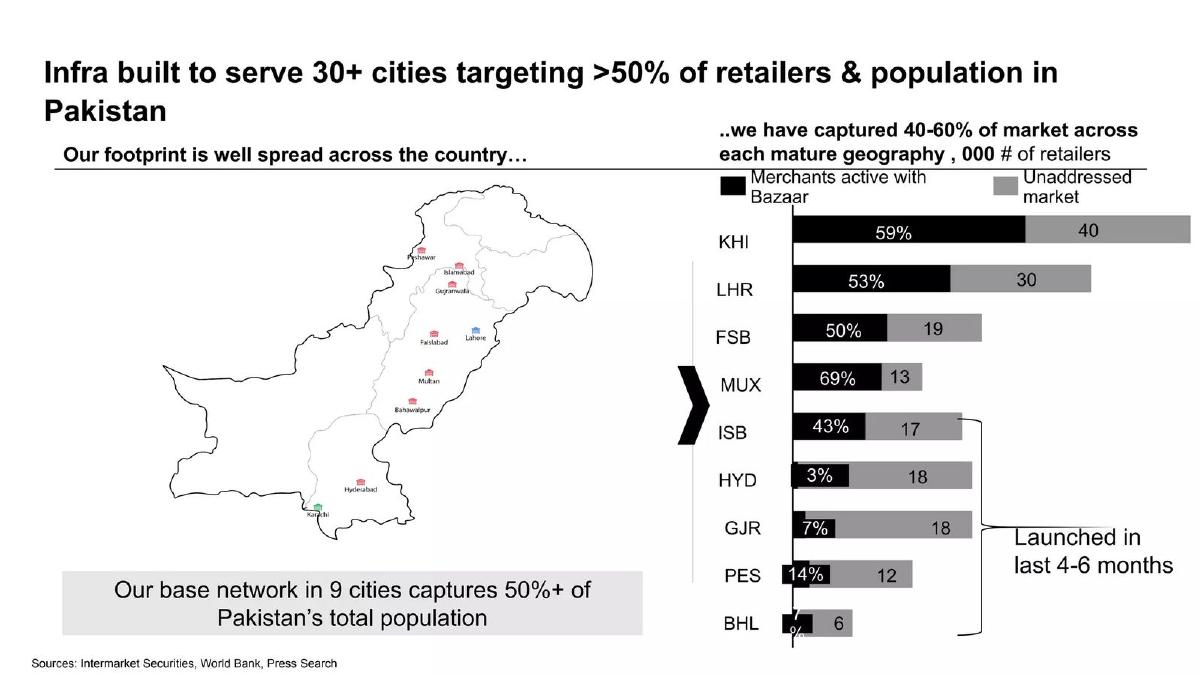
- Bazaar Prime positions itself as a superior alternative to conventional distributors by offering 24/7 access and pan-Pakistan coverage in 38+ cities (Slide 5).
- Marketing efficacy is high, with a 20% click-through rate on in-app banners and over 50% of retailers buying recommended products (Slide 6).
- The fintech arm shows strong performance, increasing average order value by 72% and maintaining a low 0.5% NPL rate (Slide 9).
- The team is built from high-tier global firms including McKinsey, P&G, Unilever, and Careem (Slide 2).
Executive Summary: The Infrastructure Giant of Pakistan
Bazaar’s pitch deck is a comprehensive look at a company that has rapidly scaled to dominate the B2B retail landscape in Pakistan. The deck focuses heavily on the intersection of physical logistics and digital financial services. By presenting massive figures—44BN annualised GMV and 750k square feet of warehousing—Bazaar moves the conversation away from 'early-stage risk' and toward 'market consolidation.' The following teardown examines the nine available slides from their 27-slide presentation.
Slide 1: Title Slide
The deck opens with a minimalist title slide featuring the company name 'Bazaar' in Urdu script. There is no tagline or secondary branding on this slide, relying entirely on the brand name's recognition within its target market.
Slide 2: Bazaar at a Glance
This is the 'traction' slide, and it is exceptionally dense with high-impact metrics. It claims Bazaar has become the largest merchant platform in Pakistan within two years. Key data points include:
Financials: 44BN Annualised GMV and a statement that they are 'unit profitable.' · Market Reach: ~50 cities and towns served with 80k+ monthly active merchants. · Operations: 415k+ monthly orders and 120+ brand partnerships. · Infrastructure: ~750k sq. ft of warehouse space in 17 cities and a 1000+ vehicle fleet. · Verticals: A breakdown showing F&G (Food & Grocery) is the largest at 42B, followed by Industrial (1.5B), Electronics (1.4B), and Pharma (0.5B). · Team: 400+ core members and 100+ engineers, with logos from McKinsey, P&G, Unilever, and Careem to validate talent quality.
Slide 3: The Technology Stack
This slide illustrates the 'deep technology stack' that enables the value chain. It divides the software into two categories: retailer-facing and backend operations. The ecosystem includes:
Marketplace: The standalone app for product sourcing. · Lending: An embedded feature within the marketplace app called 'Batwa.' · Digital Ledger: A standalone accounting app called 'EasyKhata.' · Rider App: For ground fleet delivery and cash collection. · Control Tower: A system for real-time monitoring of the ground fleet.
Slide 4: Brand Partnerships
Bazaar displays a matrix of brand partners categorized by industry (Food/Snacks, Beverages, Dairy & Tea, Household & Personal Care, Tobacco, and Mobile Phones). The slide maps these brands against their strategic goals, such as 'White Space Coverage' and 'New RTM Development.' Global giants like Coca-Cola, PepsiCo, Reckitt, and BAT are prominently featured, demonstrating Bazaar’s ability to serve as a primary distribution channel for multinational corporations.
Slide 5 & 7: Competitive Advantage (Bazaar Prime)
These slides (which appear to be part of a sequence, with Slide 7 highlighting specific rows) compare 'Bazaar Prime' to 'Conventional Distributors.' The comparison is framed across five pillars:
Access: 24/7 digital availability vs. sales-rep-dependent ordering. · Coverage: Pan-Pakistan reach (38+ cities) vs. geographically restricted traditional models. · Cost: Tech-driven order generation and optimized routing to reduce sales and last-mile costs. · Data: Real-time, granular analytics vs. rudimentary reporting. · Value-Added Services: Digitized lending and in-app gamification/ads to drive sales.
Slide 6: Visibility and Engagement Metrics
This slide focuses on the effectiveness of Bazaar’s digital real estate. It shows a mockup of the customer app and provides three key conversion metrics:
~7% of retailers order directly through landing page banners each month. · ~20% click-through rate (CTR) on banners, which the deck describes as 'best-in-class.' · >50% of retailers purchase a recommended product at least once.
Slide 8: Partner Portal Functionality
Bazaar highlights its B2B SaaS offering for brands. The 'Partner Portal' provides real-time data on sales fundamentals. The slide shows dashboard mockups for 'Geographical analysis of sales' and 'Core sales data + category insights.' Features listed include agent performance tracking, live inventory visibility, and campaign efficacy metrics. A note at the bottom indicates that 'Open APIs for seamless DMS integration' are under development.
Slide 9: Lending Expertise
The final slide in this set focuses on the fintech component of the business. It uses three bar charts to show the impact of Bazaar’s lending services:
Order Value: A 72% increase in average order value (from 6,700 to 11,500 PKR) after adopting lending. · SKU Depth: A 30% increase in the number of SKUs per customer (from 40 to 52). · Risk Management: An NPL (Non-Performing Loan) rate of 0.5%, which is significantly lower than the 3.2% industry average cited from the Pakistan Microfinance Network Review 2020.
What Works in the Bazaar Deck
Scale as a Moat: The deck does an excellent job of proving that Bazaar is not just a software company, but a massive logistics and infrastructure play. In emerging markets, the ability to move physical goods is often a stronger moat than the software itself. Reporting 750,000 square feet of warehouse space makes the business feel 'real' and difficult to replicate.
Fintech Integration: The lending slide (Slide 9) is the most compelling from a margin perspective. It proves that Bazaar isn't just facilitating trade; they are using data to provide credit, which in turn drives higher order values and better SKU variety. The 0.5% NPL rate is a powerful 'proof of concept' for their data-driven credit scoring.
Clear Competitive Comparison: The side-by-side comparison with traditional distributors (Slide 5) clearly identifies the pain points in the existing market (inefficiency, lack of data, limited reach) and shows how Bazaar’s tech-first approach solves them.
What is Missing from the Bazaar Deck
Unit Economics Detail: While Slide 2 mentions they are 'unit profitable,' there is no breakdown of take rates, logistics costs per order, or customer acquisition costs (CAC). For a B2B marketplace, understanding the margin after delivery and credit risk is vital.
The 'Ask': None of the provided slides detail how much capital is being raised or how it will be allocated. While this may be in the remaining 18 slides of the full 27-slide deck, its absence here leaves the 'why now' question unanswered.
Competitor Landscape: The deck compares itself to 'traditional distributors' but ignores other tech-enabled B2B startups in the region. Investors would want to know how Bazaar defends its position against other well-funded digital competitors.
Founder Takeaways: What to Copy
The 'At a Glance' Slide: Slide 2 is a perfect example of how to summarize a complex business. It groups metrics into logical buckets (Financials, Reach, Infrastructure, Team) and uses logos to provide instant credibility. Every founder should have a 'traction' slide this clear.
Visualizing the Ecosystem: Slide 3 uses simple phone mockups and clear labels to explain a multi-app strategy. Instead of a complex architectural diagram, they show the user-facing products, making the 'tech stack' easy to understand for non-technical investors.
Data-Backed Claims: When Bazaar claims their lending is superior, they don't just say 'it's good.' They provide three specific metrics (AOV increase, SKU increase, NPL rate) and cite an external source for the industry average. This turns a subjective claim into an objective fact.
Frequently asked questions
- What is Bazaar's primary business model based on the deck?
- Bazaar operates as a B2B commerce and fintech platform. According to Slide 2, they manage five verticals including FMCG, Industrial Raw Materials, Phones, and Pharma. They generate revenue through marketplace sourcing, but also provide value-added services like digital lending and a proprietary partner portal for brands to access real-time sales data and geographical analytics (Slide 8).
- How does Bazaar compare to traditional Pakistani distributors?
- Slide 5 and Slide 7 explicitly contrast Bazaar 'Prime' against conventional distributors. While traditional players rely on sales-rep-dependent ordering and have restricted geographic coverage, Bazaar offers 24/7 digital ordering, pan-Pakistan coverage across 38+ cities, and tech-driven logistics that reduce sales costs through optimized routing and aggregated delivery models.
- What are the key metrics for Bazaar's lending product?
- The lending product, integrated into the marketplace app, shows significant impact on merchant behavior. Slide 9 reports a 72% increase in average order value (from 6,700 to 11,500 PKR) and a 30% increase in SKUs per customer. Most notably, their Non-Performing Loan (NPL) rate is 0.5%, which they compare to a 3.2% industry average.
- What does the infrastructure and logistics setup look like?
- Bazaar emphasizes heavy physical infrastructure to support its digital marketplace. Slide 2 notes approximately 750,000 square feet of warehouse space across 17 cities and a fleet of over 1,000 vehicles used for daily operations. This is supported by a 'Control Tower' system to track and monitor the ground fleet in real-time (Slide 3).
- Which brands are currently partnering with Bazaar?
- Slide 4 lists an extensive grid of brand partners across categories. Notable names include Coca-Cola, PepsiCo, Reckitt, Philip Morris International, British American Tobacco (BAT), Nokia, and Unilever. The slide categorizes these partnerships by their stage of development, ranging from portfolio development to new route-to-market (RTM) development.