Beam’s 14-slide Series E deck from 2021 is a highly effective example of growth-stage storytelling. Rather than focusing on the novelty of dental care, the deck leans heavily into the 'Insurtech' narrative, emphasizing structural cost advantages and superior risk modeling. With 100,000+ members and a net revenue retention of 100%+, the company used this presentation to secure $80M. The deck excels at comparing Beam’s lean digital operations against the 'broken' legacy model, specifically highlighting a projected admin labor cost of just 5.3% by 2022—nearly a third of the industry average. Whi…
Key takeaways
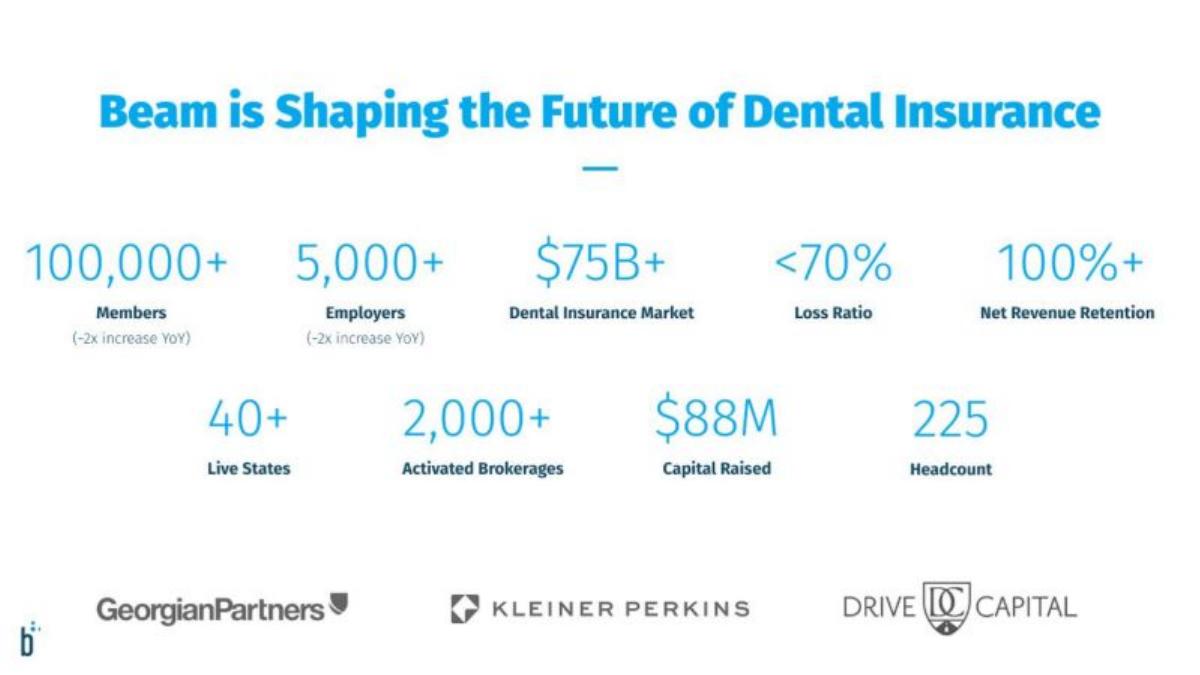
- Beam reports a member base of 100,000+, which represents a ~2x increase year-over-year as shown on slide 2.
- The company claims a structural cost advantage with admin labor projected to drop to 5.3% of dental premium by 2022, compared to an industry range of 16-20% (slide 7).
- AI-powered underwriting has successfully lowered the loss ratio to <70% by Q2 2020, significantly outperforming mature incumbents (slide 8).
- Distribution is heavily diversified, with over 50% of revenue managed on digital platforms like Gusto, Rippling, and Zenefits (slide 11).
- The business model includes a unique preventive care component featuring a connected toothbrush and wellness rewards program (slide 9).
- Beam has expanded its product footprint through bundling, with a vision attachment rate of 64%+ contributing to 12% of total revenue (slide 12).
- The leadership team features executives with backgrounds from LendingClub, PayPal, and Nationwide, emphasizing a mix of fintech and insurance expertise (slide 13).
- The deck omits a specific financial 'Ask' slide and a detailed breakdown of how the $80M Series E capital would be deployed.
The Series E Efficiency Narrative
By the time a company reaches a Series E, the pitch deck is less about 'the dream' and more about the machine. Beam’s 2021 deck is a clinical look at how an insurtech startup proves it has built a better mousetrap. The deck consists of 14 slides that prioritize hard metrics, structural advantages, and distribution scale over flashy marketing copy.
Slide 1: Title and Mission
The cover slide introduces Beam as 'Digital-first dental insurance focused on easy, smart, preventive care.' It establishes the brand identity immediately: clean, modern, and tech-centric. The inclusion of the URL www.beam.dental suggests a focus on the specific niche they occupy.
Slide 2: The Traction Snapshot
Slide 2 is a 'The Future of Dental Insurance' summary. It is a high-density data slide that serves as an executive summary. Key figures include: 100,000+ Members (~2x increase YoY), 5,000+ Employers (~2x increase YoY), and a $75B+ Dental Insurance Market . Crucially for an insurance business, it notes a Loss Ratio of <70% and Net Revenue Retention of 100%+ . It also lists $88M in capital raised prior to this round and a headcount of 225. The footer prominently displays logos for Georgian Partners, Kleiner Perkins, and Drive Capital, providing immediate institutional credibility.
Slide 3: The Problem Statement
Beam defines the problem in three short bullets: 'Policies are not serviced cost efficiently,' 'Risk is not well understood,' and 'The member experience is commoditized.' This slide sets up the 'Broken' status of the legacy industry, which Beam intends to fix with its digital-native approach.
Slide 4: Market Segmentation and Opportunity
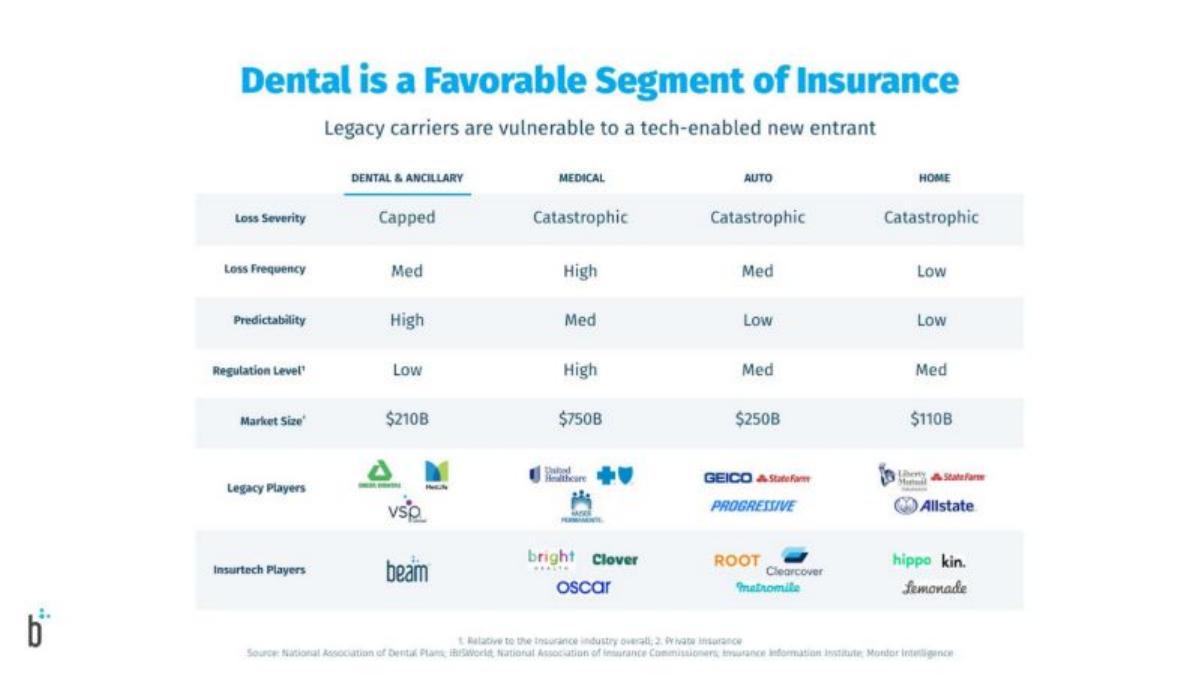
This slide is a strategic comparison of insurance segments. Beam argues that 'Dental is a Favorable Segment' because loss severity is Capped (unlike catastrophic medical or auto claims), predictability is High , and the regulation level is Low . It lists the market size at $210B (referencing total dental and ancillary) and identifies legacy players like Delta Dental and MetLife. Beam positions itself alongside other successful insurtechs like Lemonade and Root, but within the less volatile dental niche.
Slide 5 & 6: The Digitally Native Solution
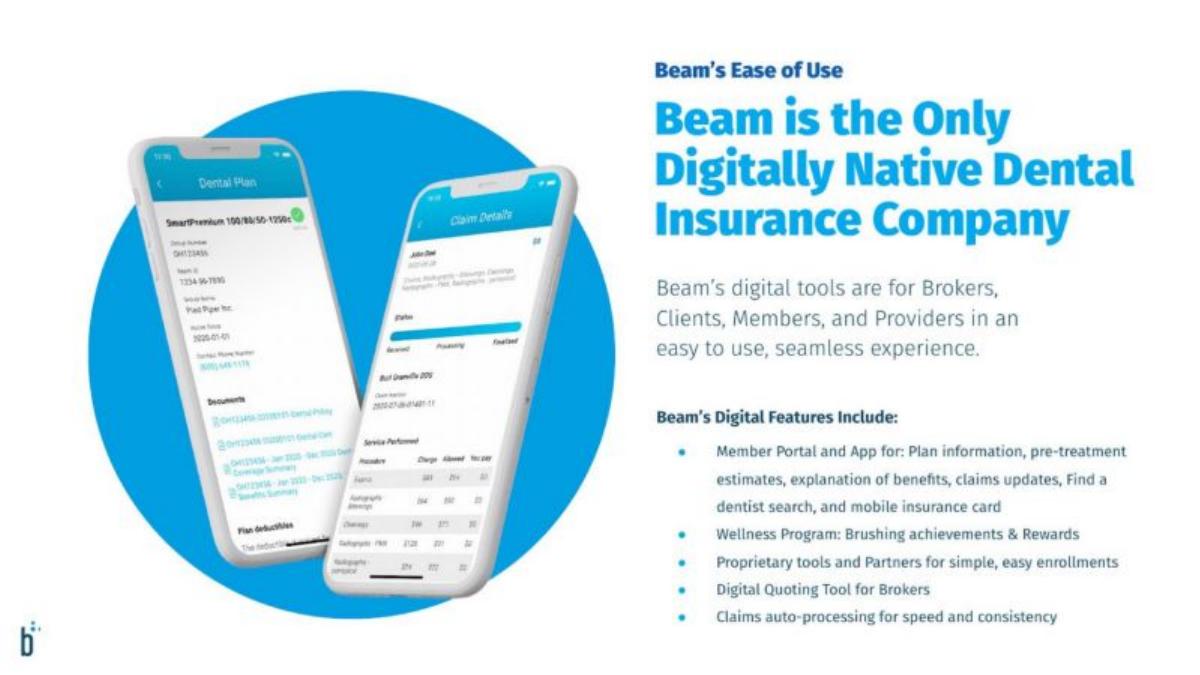
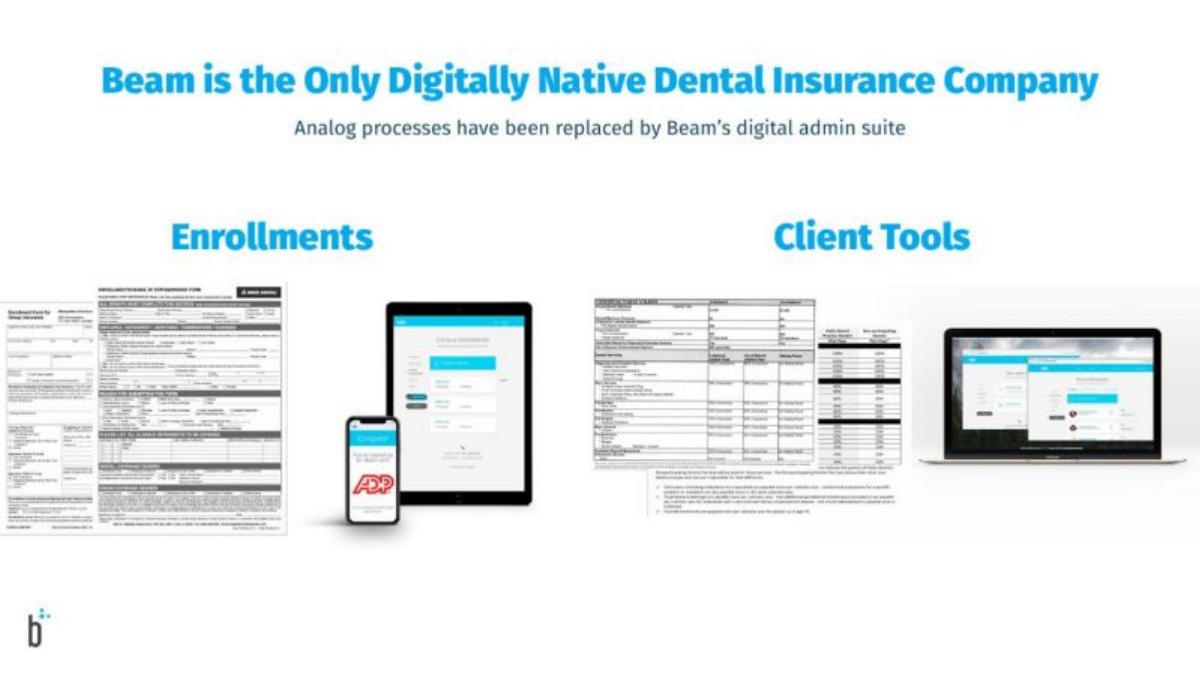
Slide 5 focuses on 'Ease of Use,' showcasing a mobile app with features like plan information, claims updates, and a 'Find a dentist' search. It lists digital quoting tools for brokers and claims auto-processing. Slide 6 drives the point home by showing a side-by-side comparison of 'Analog processes' (messy paper forms) versus 'Beam’s digital admin suite.' This is a classic 'Old Way vs. New Way' visual intended to highlight operational modernism.
Slide 7: The Structural Cost Advantage
This is arguably the most important slide for a Series E investor. It shows a line graph of 'Beam’s Admin Labor % of Dental Premium.' The percentage drops from 10.5% in 2019 to 9.5% in 2020 , 6.8% in 2021 , and a projected 5.3% in 2022 . By contrasting this against the Industry Range of 16-20% , Beam demonstrates that its technology allows it to operate with significantly higher margins or lower premiums than its competitors.
Slide 8: AI-Powered Underwriting
Risk management is the heart of insurance. Slide 8 shows a declining 'Overall LR%' (Loss Ratio) from 88% in Q1 '18 to 69% in Q2 '20 . The graph shows Beam moving from above the 'Mature Incumbents Range' to the bottom of it. The claim is that 'Proprietary underwriting methods' allow them to maintain fast growth while materially lowering losses.
Slide 9: Preventive Care and the Connected Toothbrush
Beam introduces its unique 'Wellness Program' here. It shows a connected electric toothbrush and a mobile app tracking 'Brushing Activity.' This isn't just a gimmick; it’s presented as a way to 'interweave a dental wellness program with an insurance product' to drive better health outcomes and, presumably, lower claims costs.
Slide 10: Network and Coverage
To prove they can compete with giants, Beam shows a US map with 40+ Live States and 'Coming Soon' markers for others. They claim 400,000+ access points in all 50 states through partnerships with industry-leading networks. Partner logos like HUB and OneDigital are included to show B2B validation.
Slide 11: Digital Distribution
This slide shows a bar chart of 'Revenue Managed by Digital Admin and Distributors.' It states that Beam manages over 50% of its revenue on digital platforms . Logos for Gusto, Rippling, Zenefits, and Namely are featured, showing that Beam is deeply integrated into the modern HR tech stack, which serves as a massive, scalable acquisition channel.
Slide 12: Product Expansion and Bundling
Beam demonstrates it is more than just dental. 'Bundling Generates 12% of Revenue and Growing.' It highlights a Vision attachment rate of 64%+ and shows a 'Projected Cross-Sell ARR' growing from 3.6% in 2018 to a projected 17.0% in 2023 . Partnerships with VSP Global and Nationwide are cited as the engines for this growth.
Slide 13: Leadership
The team slide features 10 leaders. It emphasizes that the company is 'Founder led' but supported by an executive team with experience in 'FinTech, Benefits, and Insurance.' Notable former companies mentioned include LendingClub, PayPal, Nationwide, MetLife, and Hertz . This mix of high-growth tech and legacy insurance experience is designed to de-risk the execution narrative.
Slide 14: Conclusion
The final slide is a standard closing page with the Beam logo and a call to 'Browse the best pitch deck examples' from the source site. Notably, the deck ends without a specific 'Ask' slide or a 'Use of Funds' breakdown, which is common in decks shared publicly after a round closes.
What Works in the Beam Deck
The Efficiency Focus: Slide 7 is a masterclass in showing how technology translates to a competitive moat. By quantifying admin labor costs against the industry average, Beam makes a mathematical argument for its superiority. · Loss Ratio Improvement: Showing a clear downward trend in loss ratios (Slide 8) proves that their AI underwriting isn't just a buzzword—it's actually working as they scale. · Distribution Strategy: Slide 11 identifies a clear 'unfair advantage.' By piggybacking on the growth of HR platforms like Gusto and Rippling, Beam avoids the high customer acquisition costs (CAC) that plague traditional insurance.
What is Missing from the Beam Deck
The Financial Ask: There is no slide detailing how much they are raising (though we know from catalogue facts it was $80M) or what the valuation expectations are. · Use of Funds: The deck doesn't specify if the capital will go toward geographic expansion, new product R&D, or marketing. · Unit Economics (CAC/LTV): While they show Net Revenue Retention and Loss Ratios, they omit specific Customer Acquisition Costs or Lifetime Value figures, which are standard for Series E. · Detailed Competition: While they mention 'Legacy Players,' there is no direct comparison against other modern dental startups or a feature-by-feature breakdown of why they win in a head-to-head RFP.
What Founders Should Copy
The 'Broken Industry' Slide: Use Slide 3's simplicity. Don't over-explain the problem; state the three reasons the current market is failing and move to the solution. · The Structural Advantage Chart: If your tech makes you cheaper to run, show the 'Industry Range' vs. 'Your Cost' over time. It is the most persuasive way to prove a tech-enabled margin advantage. · Ecosystem Integration: If you sell through partners, show the logos and the percentage of revenue they drive. It proves your product has 'market pull' within the existing workflows of your customers.
Frequently asked questions
- What is Beam's primary value proposition according to the deck?
- Beam positions itself as the only 'digitally native' dental insurance company. Its value proposition is built on three pillars: lower administrative costs through automation, more accurate risk pricing via AI-powered underwriting, and a unique preventive care model that uses a connected toothbrush to incentivize better member hygiene.
- How does Beam compare its costs to traditional insurance carriers?
- On slide 7, Beam highlights a 'Structural Cost Advantage.' It shows its admin labor as a percentage of dental premium falling from 10.5% in 2019 to a projected 5.3% in 2022. This is contrasted against a legacy industry range of 16-20%, suggesting Beam is roughly 3x more efficient than incumbents.
- What does the deck say about Beam's market reach?
- Slide 10 indicates that Beam has 'excellent network coverage from coast to coast,' with over 400,000 access points across all 50 states. At the time of the deck, the insurance product was live for employers in over 40 states, with several others listed as 'Coming Soon.'
- What is the significance of the toothbrush shown on slide 9?
- The toothbrush is the centerpiece of Beam's 'Wellness Program.' By interweaving a dental wellness program with the insurance product, Beam tracks 'brushing achievements' and offers rewards. This is intended to drive preventive care, which theoretically lowers long-term claims costs and improves the loss ratio.
- Who are the key investors and leaders mentioned?
- Slide 2 lists major investors including Georgian Partners, Kleiner Perkins, and Drive Capital. The leadership team (slide 13) is led by Co-founder/CEO Alex Frommeyer and includes executives with 'seasoned' experience from companies like PayPal, MetLife, and LendingClub.