The July 2008 barcoo business plan is a fascinating artifact from the early mobile era. Seeking 230 T€, the Berlin-based startup aimed to turn standard mobile phones into powerful barcode scanners. At the time, most mobile cameras lacked macro focus, making it impossible to read standard 1D barcodes. Barcoo’s solution was a proprietary machine-learning classifier that could interpret blurry images. The deck outlines a lean operational model: instead of building a product database, barcoo 'mashed up' data from existing web services. This allowed them to offer price comparisons, reviews, and ec…
Key takeaways
- Barcoo used a machine learning algorithm (Landweber method) to enable 1D barcode scanning on low-cost mobile phone cameras.
- The company employed a 'mash-up' data strategy to avoid the cost of building and maintaining a proprietary product database.
- Revenue was heavily dependent on a high 'Scan Rate' assumption of 3.6 scans per month per average user.
- The founders emphasized their 8-year history of working together as a core team strength.
- Marketing strategy was almost entirely viral and low-cost, relying on bloggers, YouTube, and user referral rewards.
- The deck addressed IP risks directly, noting that software-only patents are difficult to enforce in Europe.
- Break-even was projected with a relatively small user base of 150,000.
What this deck actually is
The barcoo Business Plan, dated July 1st, 2008, is a seed-stage fundraising document for a mobile application designed to bridge physical retail and digital information. At its core, the deck presents a technical solution to a hardware limitation of the era: using software-based machine learning to enable standard mobile phone cameras to scan 1D barcodes, which typically required specialized laser hardware or macro lenses. The single most important finding in this deck is its heavy reliance on "Mash-up strategy," which allows the company to avoid the massive capital expenditure of building proprietary product databases by scraping or API-linking to existing web services like Amazon, eBay, and Wikipedia.
Slide-by-slide walkthrough
Slide 1: Title Slide
The title slide establishes the brand identity and the document's purpose. It identifies Benjamin Thym as the primary contact and provides a clear date (July 1st, 2008). The logo, featuring a barcode integrated into a mobile handset icon, immediately communicates the "Physical-to-Digital" nature of the business.
For an investor in 2008, this slide is functional but plain. It positions the document as a "Business Plan," suggesting a more formal and perhaps data-heavy approach than a typical "Pitch Deck." The inclusion of a specific date is a double-edged sword; while it shows currentness, it also starts a timer on the relevance of the data within.
The strongest version of this slide would include a one-sentence value proposition or tagline. "Connecting the physical world to the internet" would reinforce the visual branding. Currently, the slide is purely administrative.
Slide 2: Value Proposition & Process Flow
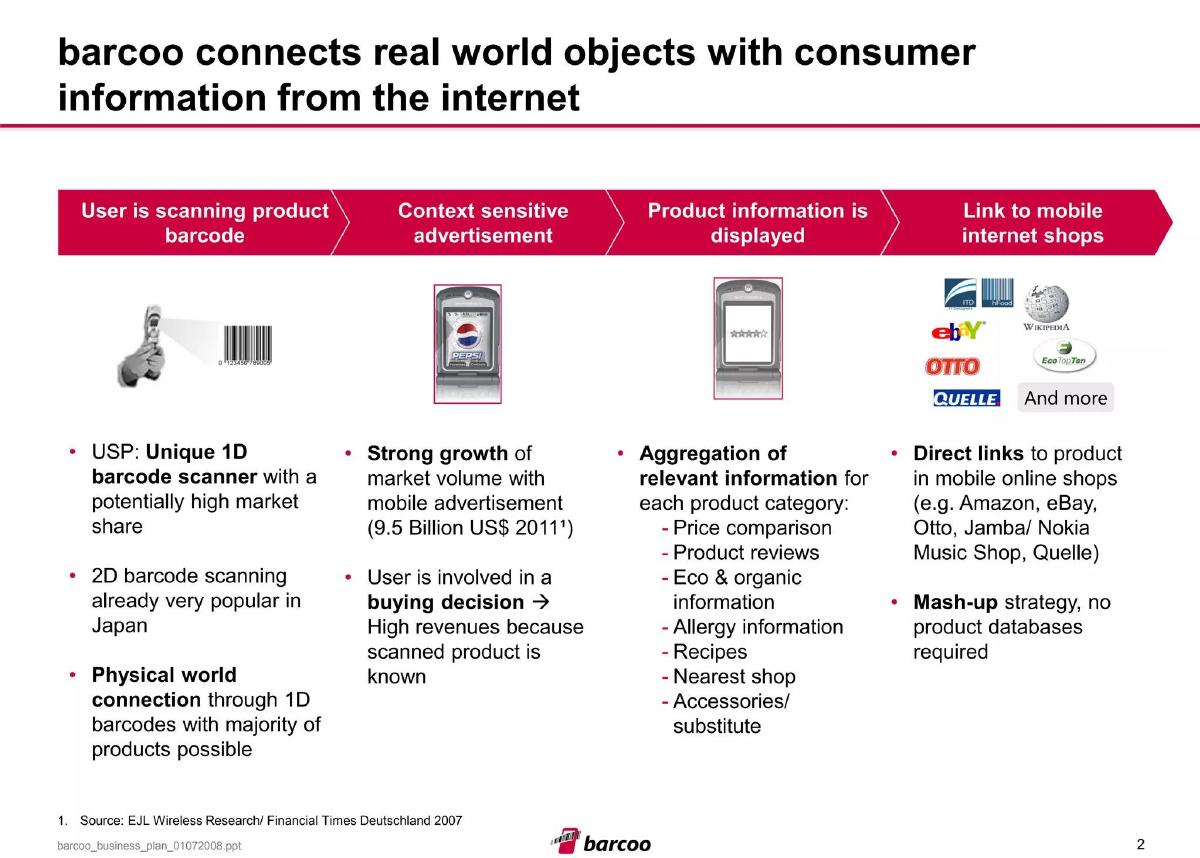
This slide outlines the user journey: scanning a barcode, receiving context-sensitive ads and product info, and finally purchasing through mobile shops. It highlights the USP as a "Unique 1D barcode scanner" and identifies a massive market opportunity in mobile advertising ($9.5 billion by 2011). It also lists the categories of information provided, such as price comparison, eco-labels, and allergy info.
An investor sees a play for the "point of decision." By knowing exactly what a consumer is holding in their hand, barcoo can serve highly targeted ads. The mention of Japan’s success with 2D barcodes provides a "look-ahead" validation, suggesting that European markets are poised for similar behavior once technical hurdles (like 1D scanning) are cleared.
The slide is cluttered with too many distinct ideas: process flow, USP, market stats, and feature lists. A stronger version would separate the "How it Works" (the diagram) from the "Why it Wins" (the USP and market data). The claim "no product databases required" is a critical operational advantage that deserves more prominence as it suggests lower overhead.
Slide 3: Management Summary
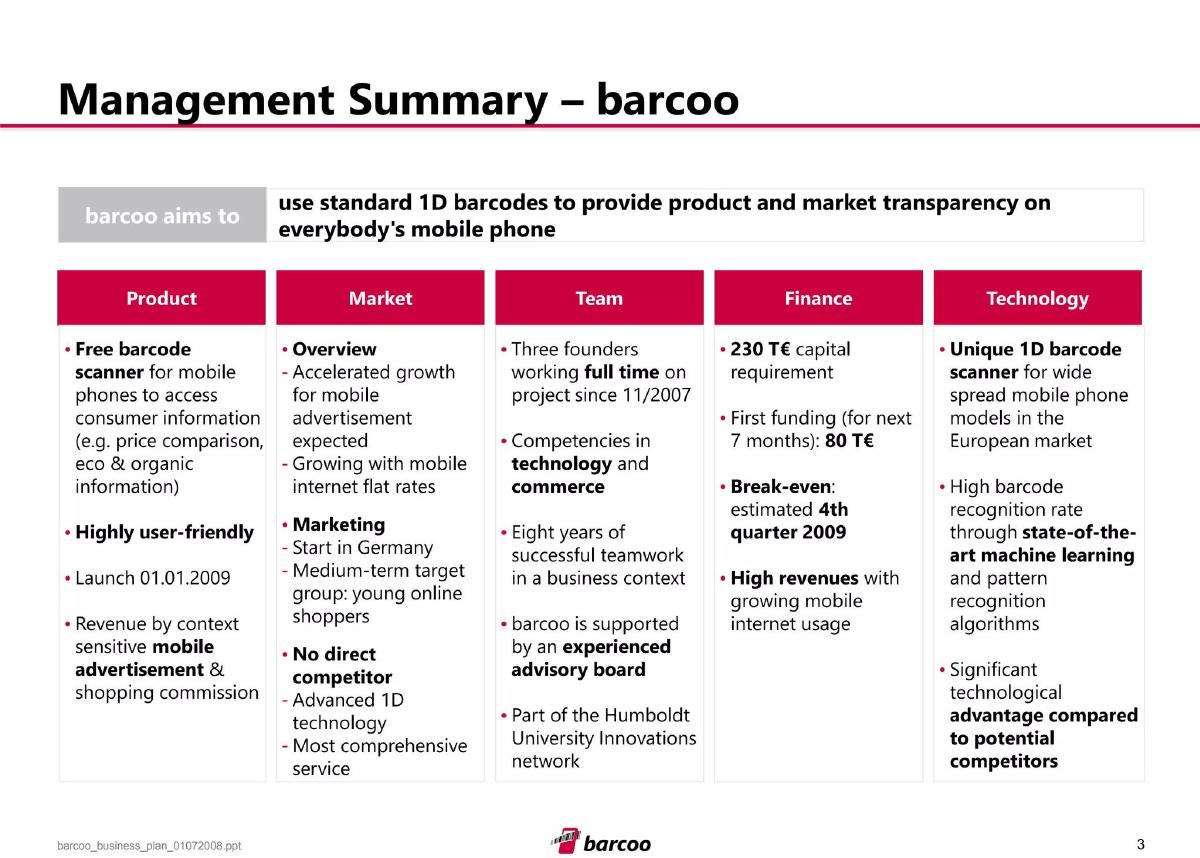
Presented in a 5-column grid (Product, Market, Team, Finance, Technology), this slide summarizes the entire business case. It explicitly states the launch date (01.01.2009), a capital requirement of 230 T€, and an estimated break-even in Q4 2009. It emphasizes the team's eight years of collaboration and the technical advantage of their pattern recognition algorithms.
This is a "high-density" slide that allows an investor to quickly assess the viability of the deal. The capital requirement of 230 T€ is modest, but the timeline to break-even (less than a year after launch) is aggressive. The "Technological advantage" claim is the most important part of this slide, as the business fails if the scanner doesn't work on low-end phones.
The strongest version of this slide would prioritize the "Why Now?" factor. Why is 2008/2009 the right time? It mentions flat rates, but more emphasis on the proliferation of camera phones would strengthen the case. The "Finance" section should also clarify if the 80 T€ "first funding" is what they are seeking now or what they have already secured.
Slide 4: Status and Beta Version
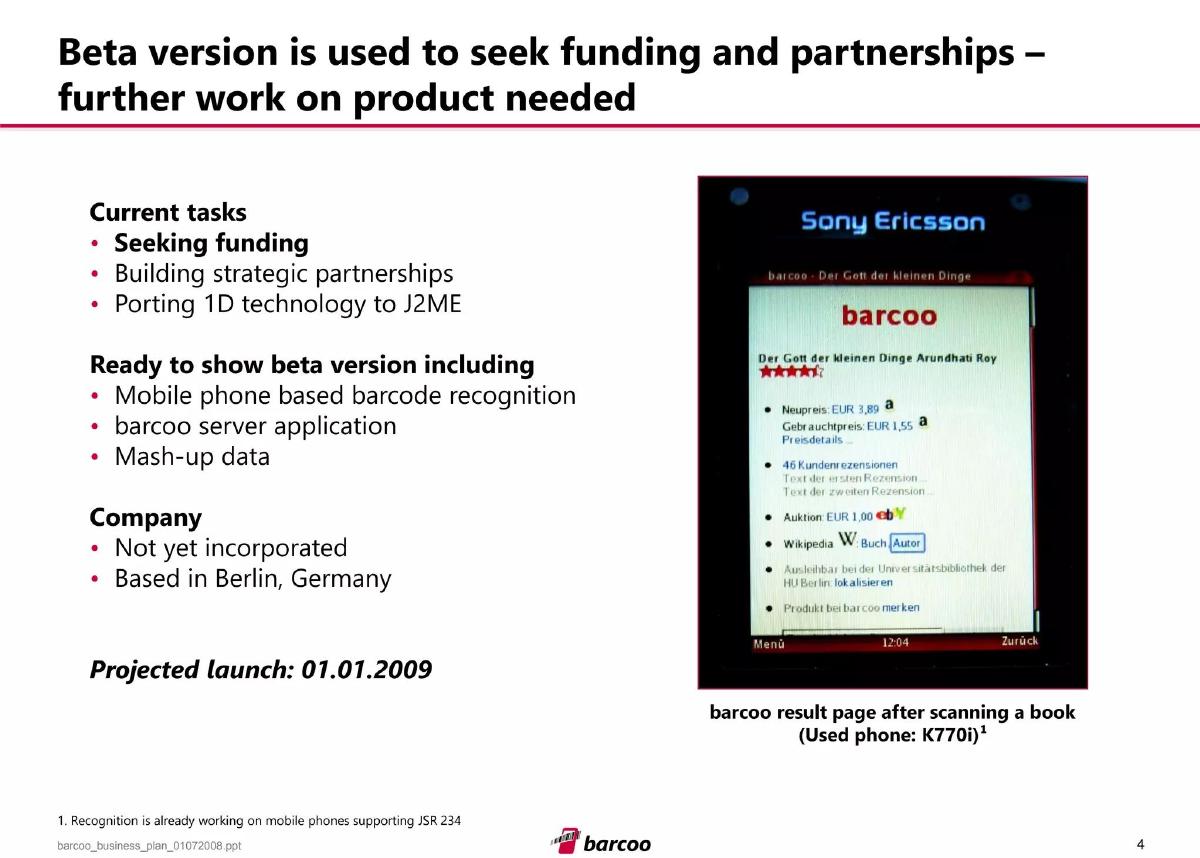
This slide shows a real photo of a Sony Ericsson K770i running the barcoo beta. It lists current tasks: seeking funding, building partnerships, and porting to J2ME (Java 2 Platform, Micro Edition). It notes the company is not yet incorporated and is based in Berlin.
The photo is the most important element here; it proves the technology isn't vaporware. However, noting that the "Recognition is already working on mobile phones supporting JSR 234" is a significant caveat, as JSR 234 was an advanced camera API not available on all handsets in 2008. The investor will wonder how much of the market is actually addressable today.
A stronger slide would provide a breakdown of what percentage of the current mobile market supports the beta vs. what will be supported after the "Porting 1D technology to J2ME" task is complete. This would quantify the technical risk mentioned in the bullets.
Slide 5: Agenda - Product
A standard transition slide highlighting the "Product" section. It serves to organize the presentation but adds no data.
In a deck of 27 slides, frequent transitions can break the flow. This slide could be combined with a "Product Vision" statement to make it more than just a navigational tool.
The strongest version would use this space to present a high-level vision statement or a compelling user quote about the problem barcoo solves.
Slide 6: Product Information and Mobile Shopping
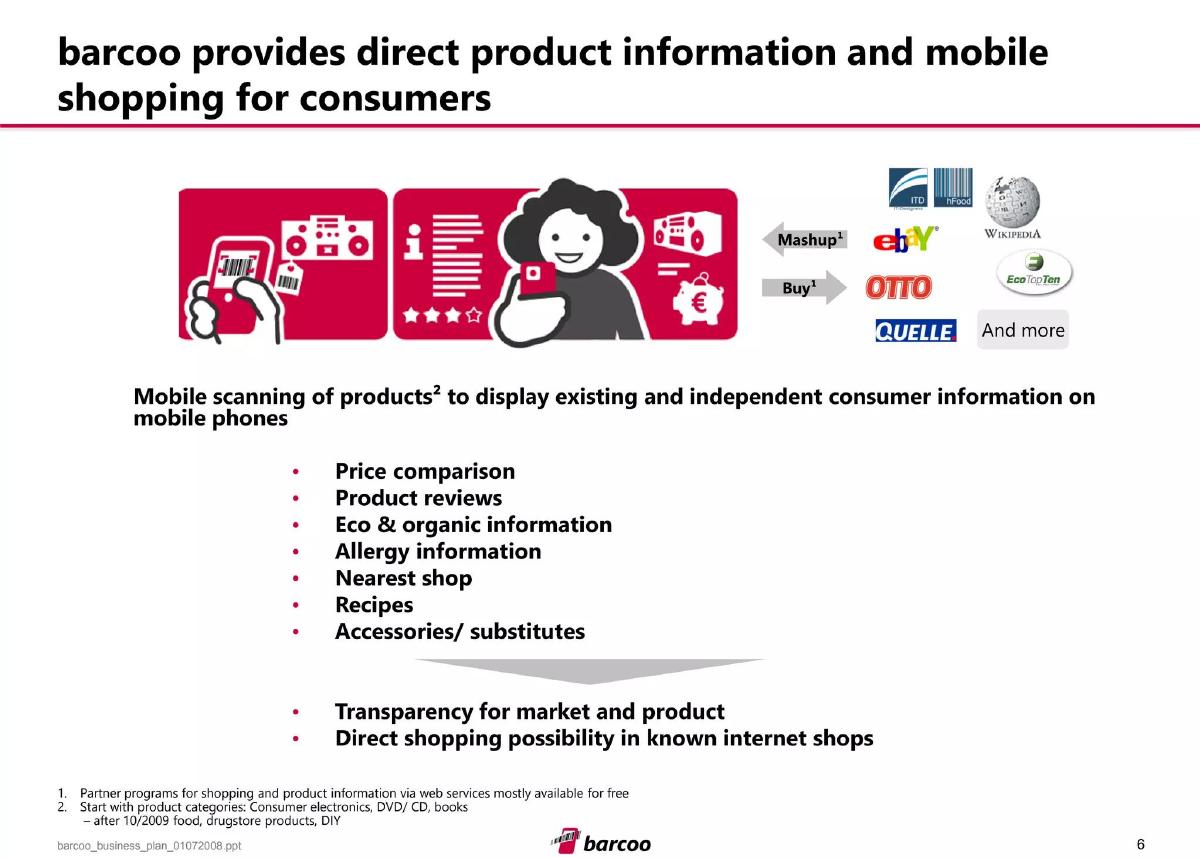
This slide goes deeper into the "Mash-up" strategy. It lists partners like Wikipedia, EcoTopTen, and Amazon. It also provides a rollout schedule for product categories: starting with electronics, DVDs, and books, then moving to food and drugstores after October 2009.
The rollout strategy is logical. Books and electronics have standardized EAN/ISBN codes and robust online pricing data, making them easier "first targets" than food, which requires more complex eco and allergy data. The "Direct shopping possibility" is the monetization hook.
The slide should clarify whether "Partner programs... available for free" means barcoo has no costs, or if they have actually signed these agreements. There is a difference between "mostly available" and "integrated."
Slide 7: Why 1D Barcodes?
This slide argues why 1D barcodes are superior to 2D codes for this application. It notes that 1D codes are already on almost every product and allow for manufacturer-independent information, whereas 2D codes (at the time) were mostly used for specific marketing campaigns.
The logic here is sound: 1D is the existing infrastructure. By not requiring brands to print new 2D codes (like QR codes), barcoo removes the biggest barrier to adoption. The claim that users are "prepared for barcode scanning" by 2D usage is a clever way to frame a competitor's marketing as "pre-education" for barcoo's own product.
To be more convincing, this slide needs data on the prevalence of 1D vs. 2D codes in the European market. A chart showing the billions of 1D-coded items vs. the handful of 2D-coded items would make the "universality" argument undeniable.
Slide 8: Revenue Model
The revenue model is split into three parts: context-sensitive ads (full screen during aggregation and on result pages), shopping commissions (5% per purchase, 0.10 € per bid, etc.), and future services (location-based ads and manufacturer campaigns).
This is a standard "Affiliate + Ads" model. The mention of a "0.10 € per bid" suggests an integration with eBay, and "6 € per order" suggests lead generation for retailers like Quelle or Otto. The inclusion of "Location based services" as a "Later" item (Q3 2009) shows a phased approach to complexity.
The footnote "No affiliate program yet" for Nokia Music Shop highlights a vulnerability: the revenue model depends on third-party affiliate infrastructures. The slide would be stronger if it showed the "Commission" portion of the revenue vs. the "Advertising" portion in their financial projections.
Slide 9: Agenda - Analysis
Another transition slide, this time moving into the "Analysis" section, which likely covers market and competition.
Again, this is filler. The deck is starting to feel long, and these slides contribute to that. A better approach would be to include a "Key Market Insight" on this slide to keep the momentum going.
A stronger version would highlight a single, shocking statistic about mobile internet growth to prime the investor for the data to follow.
Slide 10: Market Growth & Target Group
This slide features a bar chart showing mobile advertising growing from $1.85 billion in 2008 to $9.5 billion in 2011. It cites Google CEO Eric Schmidt and GfK research to support the trend of "mobile will be a larger business than the PC-Web." It defines the target group as "Young online shoppers (age 15-40)."
The market data is impressive, but it is global data. An investor would want to see how this translates to Germany (barcoo’s starting market). The definition of the target group is quite broad (15 to 40), covering everything from high schoolers to established professionals.
The strongest version of this slide would localize the data. If the global market is $1.85B, what is the German mobile ad market? Also, the "1/3 of Germans inform themselves on the internet" stat is for "expensive products," which contradicts the earlier focus on low-cost items like DVDs and books.
Slide 11: Market Segments and Personas
This slide breaks the target audience into five personas: Spontaneous shopper, Bored high school student, Spontaneous recipe user, Eco consumer, and Film freak. It provides demographics, characteristics, and projected user numbers for 2009 and 2010.
This is highly detailed, perhaps too much so for a seed deck. The "Amount of users" projections (e.g., exactly 28,000 Spontaneous shoppers in 2009) feel overly precise for a product that hasn't launched. However, it shows the founders have thought deeply about why different people would use the app.
The "Annual income" sliders are interesting—Eco consumers and Film freaks are shown with higher potential incomes than High school students. A stronger version would link these personas directly to the revenue model: which of these personas generates the highest "Shopping commissions" vs. "Ad clicks"?
Slide 12: Marketing Plan
A Gantt chart from October 2008 to August 2009. It outlines a strategy of winning "multipliers" through a semi-public beta, a barcoo blog, affiliate programs, and YouTube videos. "Go-live" is set for January 2009.
The focus on viral marketing is appropriate for a B2C app with a limited budget. Using "Amateur video series on YouTube" reflects the era's marketing trends. The "Users create users (Reward)" bullet suggests a referral mechanism, which is critical for low-cost acquisition.
The chart shows "Keyword placement in search engines" starting in October, but "Go-live" isn't until January. This seems like wasted spend unless it's for building a waitlist. The slide would be stronger if it defined the "Reward" for the referral program.
Slide 13: Competitive Matrix
A massive table compares barcoo against 16 competitors, including Google zXing, Amazon.jp, and Scanbuy. It uses a legend of "+" for supported and "o" for no service. Barcoo claims to be the only one offering 1D scanning on low-end phones, eco-information, and allergy information.
This is a "sea of pluses" for barcoo. It effectively shows that while many can scan 2D codes, very few can handle 1D barcodes on standard phones. It also highlights that barcoo is more of an "information aggregator" than just a "scanner tool."
The matrix is overwhelming. A stronger version would group competitors into "Tools" (like Scanbuy) and "Portals" (like Ciao) to show how barcoo bridges the two. Also, the claim that Google zXing has "no productive service available" was likely true in mid-2008 but was a significant looming threat.
Slide 14: Financial Projections (Revenue/Profit)
A line chart shows revenue and profit from Q2 2008 to Q4 2010. It anticipates break-even in Q4 2009 with approximately 150,000 users. Profit is shown scaling rapidly thereafter.
The chart indicates that expenses (the gap between revenue and profit) remain relatively flat while revenue scales. This suggests a high-margin software model. However, reaching 150,000 users and break-even in 10 months after "Go-live" is an extremely optimistic projection for a new mobile behavior.
The slide says "Detailed derivation of user numbers... in appendix," which is good, but the chart itself needs more labels. What are the T€ values for the peaks? It’s hard to read exact numbers from the lines alone.
Slide 15: Capital Requirement
This slide breaks down the 230 T€ ask into two steps: 80 T€ for the next 7 months (pre-launch) and 150 T€ post-launch. A bar chart shows quarterly requirements, peaking in Q1 2009 (post-launch).
The phased funding approach is investor-friendly; it suggests the founders are mindful of dilution and want to hit milestones before taking the larger chunk of capital. The 80 T€ is primarily for "porting technology" and "building partnerships."
The chart shows a requirement of 1 T€ in Q4 2009, which is when they claim to hit break-even. This is a very "tight" plan with no room for error. A stronger version would include a "contingency" or "buffer" in the capital requirement.
Slide 16: Long-term Strategy (Extensions)
This slide lists future features: Location-Based Services (LBS), community functions (scan history, Wiki-like product adding), image/RFID recognition, and a "Product chat." Each has a priority icon.
The "Community functions" are vital because they allow users to fill the gaps in the "Mash-up" data, turning barcoo into a crowdsourced database. "Mobile micro blogger (cp. Twitter)" shows the company was watching emerging social trends in 2008.
The "Product chat" seems like a "feature for the sake of features." The slide would be stronger if it focused on how these extensions drive the core business—for example, how LBS increases the conversion rate of "Shopping commissions" by offering local store alternatives.
Slide 17: Agenda - Team
As with previous agenda slides, this is a missed opportunity to lead with a "Team Strength" highlight, such as their "8 years of teamwork."
The strongest version would be a combined "Team & Advisory Board" slide to show the full support network immediately.
Slide 18: Team
Features Tobias Bräuer, Martin Scheerer, and Benjamin Thym. Highlights include a World Championship in "Robocup Rescue Simulation," a trainee stint at the ESA, and three years of strategic IT consulting. It emphasizes their since-1999 software development history.
The "since 1999" collaborative history is a huge plus; it reduces "founder conflict" risk. The "Robocup" and "ESA" mentions signal high technical IQ. However, there is a lack of deep "Retail" or "Advertising" experience among the founders, which is where the "Advisory Board" (mentioned but not named) needs to fill the gap.
The slide should name the members of the "experienced advisory board." In 2008, having a name from a major retailer or a mobile carrier on the board would have been a significant credibility booster.
Slide 19: Appendix Title
A simple title slide for the appendix. It uses the brand's red and white color scheme.
While standard, an appendix in a deck this long (27 slides) needs a table of contents or clear sectioning to help an investor find specific data points like the P&L.
A stronger version would list what is in the appendix: Financials, Technical Deep-Dive, Patent Analysis, etc.
Slide 20: Machine Learning Process
This technical slide explains how the barcode scanner works: training a database with "several thousand sample barcodes," using "statistical initialization," and "classification." It notes that the classifier is deployed to the mobile phone via J2ME.
This slide is meant to justify the "USP" of 1D scanning on low-cost optics. By moving the heavy lifting to the training phase ("Central machine learning") and deploying a lightweight "classifier" to the phone, they bypass the need for a powerful CPU on the handset.
The status "Prototype developed" and "3 web services implemented" is the most important data here. It shows they are past the "idea" phase and have a working proof-of-concept.
Slide 21: Technical Challenge: Blurry Images
This slide illustrates the core problem: mobile cameras have low-cost optics and can't access macro or auto-focus modes. It then details the solution: Histogram normalization and the "Landweber method for inverse point spread function."
This is "deep tech" for 2008. Mentioning the "Landweber method" provides technical gravitas. It explicitly addresses why their solution is better than existing ones: most "solutions for some systems... have low market share," whereas barcoo aims for the mass market.
A "before and after" image showing a blurry barcode and the "processed" version that the algorithm sees would be much more powerful than the text description. Show, don't just tell, the technology works.
Slide 22: Website Design
A screenshot of the barcoo.de website. It shows a consumer-facing landing page with red graphics and download links.
This slide feels out of place in a business plan. While it shows the brand is "real," it doesn't add much to the investment thesis unless the website is a major revenue driver (which Slide 25 suggests it isn't—only 4 T€ from community ads in 2011).
The strongest version would use this space to show the Mobile App's UI design, as that is the primary product. The website is secondary.
Slide 23: Patent Situation
This slide addresses Intellectual Property (IP). It states that software-only patents are "not enforceable" in Europe without "further technical effect." It then lists accepted, pending, and declined patents from other players.
This is a remarkably honest and thorough slide. Instead of claiming they have a "unbeatable patent," they provide a realistic assessment of the European patent landscape. This builds trust with an investor. They show they've done the "IP management" research.
The slide should clarify if barcoo has filed any of its own patents or if they are relying solely on "Trade Secrets" and the difficulty of replicating their machine learning training set.
Slide 24: Projected P&L (2008-2011)
A detailed quarterly P&L. It shows Turnover growing from 1 T€ in Q1 2009 to 326 T€ in Q4 2011. Personnel costs are the largest expense, starting at 9 T€/quarter and growing to 71 T€/quarter. It predicts a result after tax of 131 T€ in Q4 2011.
The numbers are surprisingly conservative for a startup. A total turnover of 326 T€ per quarter ($1.3M annual run rate) in Year 3 is not "explosive" growth, but the "Result after tax" shows the business is profitable. It depicts a sustainable business rather than a "unicorn or bust" moonshot.
The "Personnel costs" of 9 T€ in 2008 for three full-time founders is very low (basically subsistence wages). Investors will look at this and wonder if the founders can survive on that or if they will need to raise more just to pay themselves a market rate once the company is funded.
Slide 25: Income Breakdown and Assumptions
This slide breaks down revenue by source: Full-screen ads, Result page ads, Shopping commissions, Community ads, and LBS. It also lists the assumptions: an average of 3.6 scans per month per user, 0.10 € per full-screen ad, and a 2.0% click rate.
The revenue is dominated by "Full screen advertisement after request sent." This is a high-risk assumption, as users might find a full-screen ad intrusive when they are trying to get product information. The 20% "Click rate mobile internet" for 2009 is extremely high compared to the 0.2% "traditional internet" rate listed below it.
The "Average scans per month" of 3.6 is the most critical number in the whole deck. If users only scan 1 item a month instead of 3.6, the revenue drops by 70%. The deck needs to justify why 3.6 is the right number—is it based on the beta user behavior?
Slide 26: Marketing Costs and Assumptions
A breakdown of marketing spend: Search engine keywords (0.50 € per click), Affiliate rewards (2 € per user), and "Amateur video series on YouTube." It also includes "T-shirts for super users (> 1,000 scans)."
The marketing budget is lean (peaking at ~23 T€ per quarter). The reliance on "Word-of-mouth" and "Viral" is clear. The "Reward for each new active user (2 €)" is the core of their CAC (Customer Acquisition Cost) calculation.
The "Amateur video series" has a one-time cost of 9 T€ in Q1 2009. This is a very specific line item. A stronger version would show the Total CAC vs. the LTV (Lifetime Value) of a user based on that 3.6 scans/month assumption.
Slide 27: User Projections and Assumptions
This slide projects user growth from 10,856 in Q1 2009 to 266,936 by Q4 2011. It accounts for a "Loss of users" (churn) of 2.1% per month due to phone changes and 0.5% due to uninstallation. It attributes most new users to "Word-of-mouth" and "Press releases."
The "Word-of-mouth" numbers (growing to 28,973 new users in Q4 2011) are the engine of this growth. The 2.1% churn due to phone changes is a very specific 2008-era problem (when apps didn't always follow you to a new device). The 20% conversion rate for visitors via press releases is incredibly optimistic.
The arithmetic: If they acquire 266k users and each scans 3.6 times/month, that's 957k scans/month. At 0.10 € per full-screen ad (assuming 100% fill rate and 100% of users see the ad), that’s 95 T€/month. This matches the Q4 2011 Turnover projection of 326 T€ for the quarter. The model is consistent, but it is "perfect world" consistent—it assumes every scan results in a paid ad impression.
Closing recommendations
Verify the Ad Fill Rate: The financial model assumes every scan generates revenue ("Full screen advertisement after request sent"). In reality, ad networks rarely have 100% fill rates for every possible product category. The deck needs a "Fill Rate" assumption. · Update Handset Compatibility: The reliance on JSR 234 and the mention of porting to J2ME are significant technical hurdles. The deck should explicitly show the "Addressable Handset Market" in Germany to de-risk the technical execution. · Strengthen the "Why Now": 2008 was the dawn of the App Store era. The deck mentions J2ME and Symbian but doesn't mention the iPhone or Android (except for one competitor reference). Addressing how barcoo fits into the emerging "App Store" ecosystem vs. the "Mobile Web" would make it more future-proof. · Quantify the "Mash-up" Reliability: Since barcoo owns no data, the business is at the mercy of Amazon, eBay, and Wikipedia APIs. The deck should address the risk of these partners cutting off access or changing their terms of service. · Name the Advisors: The "experienced advisory board" is a ghost in this deck. For a seed-stage company, these names are often as important as the founders. Adding a slide with their photos and bios is a priority. · Condense the Appendix: Slides 24-27 contain vital information that is currently buried. The "Revenue per Scan" and "CAC vs LTV" metrics should be pulled out of the spreadsheets and placed in the main "Finance" section to make the business case clearer.
Frequently asked questions
- How much funding did barcoo seek in this deck?
- Barcoo requested a total of 230 T€, planned in two steps: an initial 80 T€ for the first seven months of development and porting, followed by 150 T€ post-launch.
- What was barcoo's core technical advantage?
- The deck claims a "Unique 1D barcode scanner" powered by machine learning and pattern recognition algorithms. This allowed standard mobile phone cameras to scan traditional barcodes without needing specialized macro lenses or 2D-only readers.
- How did barcoo source its product data?
- Barcoo used a "mash-up strategy," meaning it did not maintain its own product database. Instead, it pulled information (prices, reviews, eco-data) via web services from partners like Amazon, eBay, Wikipedia, and EcoTopTen.
- What was the primary revenue model?
- Revenue was projected from three main sources: context-sensitive full-screen ads shown during scanning, ads on the results page, and shopping commissions (affiliate fees) from retailers like Otto, eBay, and Amazon.
- When did the company expect to become profitable?
- The deck projected break-even in the 4th quarter of 2009, approximately 10 months after the planned January 1st, 2009 launch.
- What was the target market and demographic?
- The initial launch focused on Germany, with the "medium-term" target group defined as young online shoppers aged 15 to 40 who were comfortable installing mobile applications.