Funding to Date on a Pitch Deck: How to Show Money Already
How much you have raised, from whom, when and at what price. Four real slides show how to present funding history so it supports the new round instead.
Funding to Date on a Pitch Deck: Show What You Raised, From Whom and What It Bought
Almost every investor asks how much a company has already raised. The answer shapes how they read everything else: what the company achieved per dollar, who else is in, and whether the new round's price makes sense. Many decks answer in one line, "$2M raised to date", or not at all. This guide uses four real slides that show money already raised, from a dated round-by-round timeline to a single headline line, to show what to include, what to leave out, and which numbers invite questions you should answer first.
TL;DR
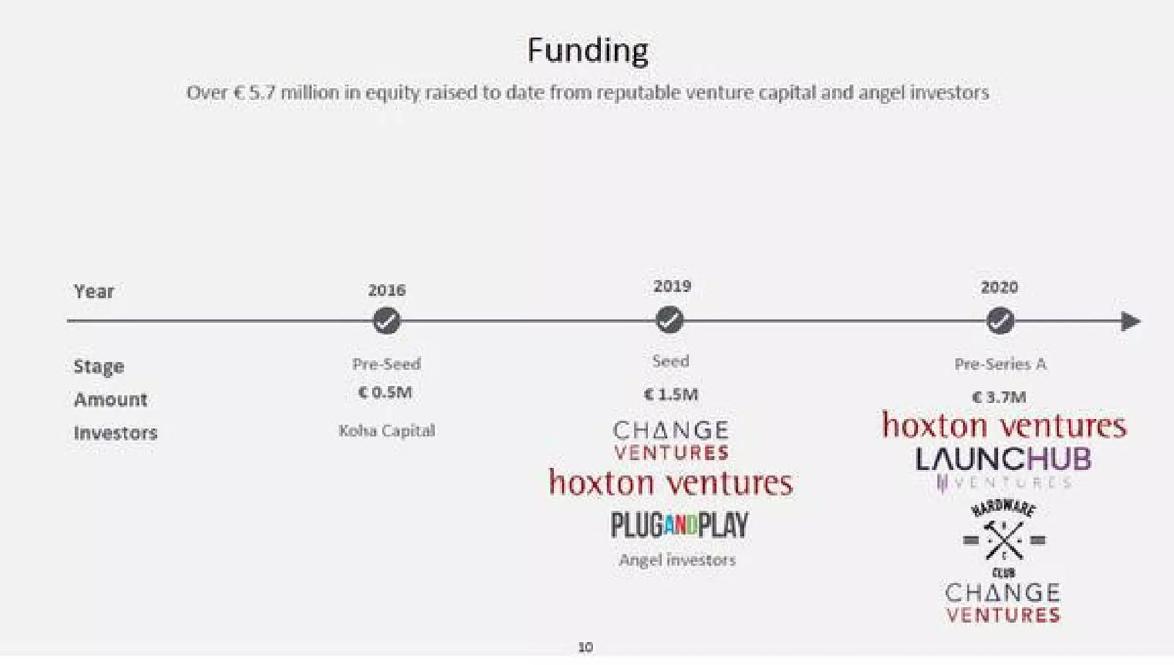
Show the total raised, broken into rounds with year, stage, amount and lead investors, and make the rounds add up to the total. Then connect the money to the results it paid for, and present the new round as the next step. Giraffe360's funding slide is the cleanest example: three dated rounds (€0.5M, €1.5M and €3.7M) add exactly to its "over €5.7 million" headline, and each round names its investors. Onfleet shows the strongest framing: "profitable, with only $5m raised to date". If you show past valuations, make sure they agree with each other and with the price of the new round; a valuation line that does not reconcile, as on Mio Marketplace's slide, invites a question before the meeting starts.
Four slides that show funding to date, read in full
Each slide was rendered from the original deck at full size and read in full; Mio's valuation text was enlarged. No funding figure was checked against outside records.
Giraffe360 ask slide — slide 10
Property imaging hardware. Funding slide.
Giraffe360 deck, slide 10. Exact stored slide matched to this analysis.
Our analysis: The cleanest round-by-round layout in the set.
Evidence and limitation: Rounds add to the total (0.5 + 1.5 + 3.7 = 5.7); equity only; two repeat investors visible but not stated; no results tied to rounds.
What a founder can adapt: State follow-on investment in words and add what each round achieved.
Supporting analysis
What the deck claims: "Over € 5.7 million in equity raised to date"; 2016 Pre-Seed €0.5M (Koha Capital); 2019 Seed €1.5M (Change Ventures, Hoxton Ventures, Plug and Play, angels); 2020 Pre-Series A €3.7M (Hoxton, LaunchHub, Hardware Club, Change Ventures).
Presentation choice: Shows the core structure every funding history needs.
When it does not fit: A headline total that does not match the rounds.
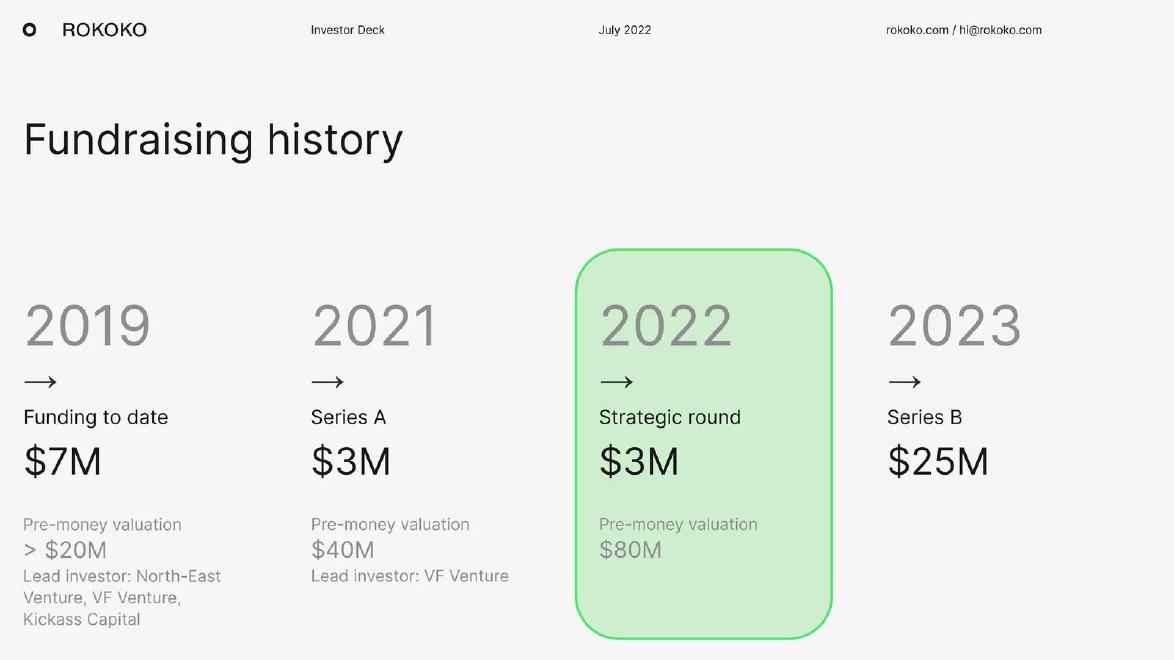
Rokoko deck, slide 15. Exact stored slide matched to this analysis.
Our analysis: The most informative history, with one labelling gap.
Evidence and limitation: Rising valuations doubling each step; first column ambiguous between cumulative and single round; next round shown.
What a founder can adapt: Label the first column's period and add a running total.
Supporting analysis
What the deck claims: 2019 "Funding to date $7M", pre-money "> $20M"; 2021 Series A $3M, pre-money $40M; 2022 strategic round $3M, pre-money $80M (highlighted); 2023 Series B $25M.
Presentation choice: Shows how valuations and the next round put the current raise in context.
When it does not fit: Showing a price step-up the rest of the deck does not justify.
Delivery management software. Investor slide; deck date not recorded in the source file.
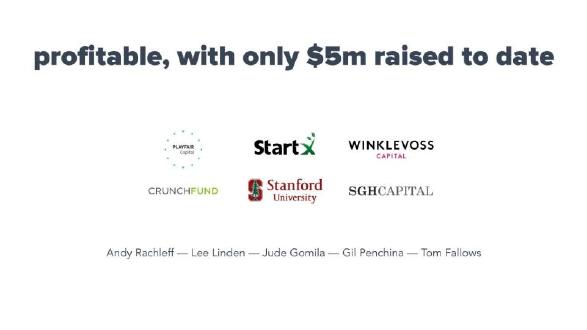
Onfleet deck, slide 18. Exact stored slide matched to this analysis.
Our analysis: Funding history used as an efficiency argument.
Evidence and limitation: Amount tied to an outcome; no rounds, dates or definition of profitable.
What a founder can adapt: Support the profitability claim with dated figures elsewhere in the deck.
Supporting analysis
What the deck claims: "profitable, with only $5m raised to date"; logos of Playfair Capital, StartX, Winklevoss Capital, CrunchFund, Stanford University, SGH Capital; five named angels.
Presentation choice: Shows how one line can make prior funding persuasive.
When it does not fit: An efficiency claim with no financial slide behind it.
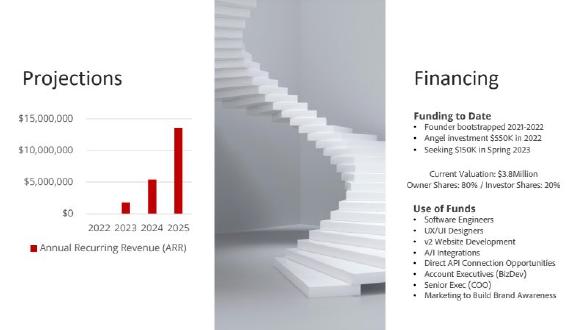
Early-stage marketplace raising in spring 2023. Projections and financing slide.
Mio Marketplace deck, slide 13. Exact stored slide matched to this analysis.
Our analysis: A clear list undermined by a valuation line that does not reconcile.
Evidence and limitation: Closed and sought money kept separate; 20% of $3.8M is about $760K against $550K invested, unexplained; projections without current revenue.
What a founder can adapt: Explain the angel round's price, or leave valuation off the slide.
Supporting analysis
What the deck claims: "Founder bootstrapped 2021-2022"; "Angel investment $550K in 2022"; "Seeking $150K in Spring 2023"; "Current Valuation: $3.8Million"; "Owner Shares: 80% / Investor Shares: 20%".
Presentation choice: Shows why ownership and valuation must agree with amounts raised.
When it does not fit: Ownership percentages and valuations that the reader cannot reconcile.
Whether rounds are dated and add up, whether investors and valuations are shown, and whether the money is tied to results.
Example
Rounds dated
Adds up
Investors named
Valuations
Tied to results
Giraffe360
Yes
Yes
Yes
No
No
Rokoko
Yes
Unclear (first column)
Partly
Yes, rising
No
Onfleet
No
Total only
Yes
No
Yes (profitable)
Mio Marketplace
Yes
Yes
No
Yes, unreconciled
No
Key Takeaways
Give the total raised and the rounds that make it up; check that they add up.
Date each round and name the lead investors.
Tie the money to what it achieved: revenue, product, profitability.
Show past valuations only if they are consistent with the new round's price.
Separate money closed from money sought.
Present your funding to date
Answer these before adding funding history to your deck.
Total. How much have you raised in total, and of what type (equity, notes, grants, loans)?
Rounds. What are the year, stage, amount and lead investor of each round? Do they add up to the total?
Results. What did each round, or the total, pay for?
Follow-on. Have existing investors put in more money?
Valuation. If you show past prices, do they reconcile with ownership and with the new round?
Copyable framework: "We have raised [total] in [type] across [n] rounds, led by [investors]. It took us to [result]. [Existing investor] is following on in this round."
Illustrative example 1 — written by us
Before: "$2M raised to date."
After: "$2M in equity: $0.5M pre-seed (2022), $1.5M seed (2023, led by [fund]). It took us to $600K ARR; our seed lead is following on."
What improved: Our illustrative rewrite; figures are invented for the example. It adds rounds, dates, a result and follow-on investment.
The question this guide answers
Founders ask whether to show previous funding on their deck, and how. Our ask-slide guides cover the size of the new round, use of funds, runway, deal terms, the cap table and bridge rounds. None is about presenting the money already raised: how to lay out past rounds, whether to show past valuations, and how to make prior funding work as evidence for the new round rather than a number the investor has to dig for.
This differs from the cap table, which shows who owns what today, and from deal terms, which describe the new round. Funding history answers a different question: how much capital has this company consumed to get here, and who backed it along the way?
How we chose and read the examples
We searched saved slide text in the teardown library for "raised to date", "funding to date", "funding history" and "prior funding". That returned about fifty slides. We left out listed companies and SPAC presentations, slides that mention only an industry's funding, and slides where amounts are placeholders. We kept four slides that present funding history four different ways: a round-by-round timeline, a history with valuations, a one-line efficiency claim, and a short list beside a current valuation.
The examples are Giraffe360 (property imaging hardware), Rokoko (motion capture, July 2022 investor deck), Onfleet (delivery management software) and Mio Marketplace (an early-stage marketplace raising a small round in spring 2023). All four were private at the time of their decks. Each slide was rendered from the original deck at full size and read in full; Mio's small financing text was enlarged at higher resolution. We did not check any funding figure against outside records such as company filings or funding databases.
A complete round-by-round timeline: Giraffe360
Giraffe360's slide 10 is titled "Funding", with the subheading "Over € 5.7 million in equity raised to date from reputable venture capital and angel investors". A timeline has three dated points. In 2016, a pre-seed round of €0.5M from Koha Capital. In 2019, a seed round of €1.5M from Change Ventures, Hoxton Ventures, Plug and Play and angel investors. In 2020, a pre-Series A of €3.7M from Hoxton Ventures, LaunchHub Ventures, Hardware Club and Change Ventures. Rows on the left label each line: Year, Stage, Amount, Investors.
The arithmetic works: 0.5 + 1.5 + 3.7 = 5.7, so the headline total matches the rounds. That matters more than it seems. An investor who adds up the rounds and gets a different number starts to wonder what else is loose. The slide also says "equity", which tells the reader that grants or loans, if any, are not included.
The repeat investors are the quietest strong point. Hoxton Ventures and Change Ventures appear in both 2019 and 2020. Existing investors putting more money in is one of the few signals of conviction a deck can show. Giraffe360 lets the logos imply it; one line, "Hoxton and Change Ventures followed on in 2020", would say it outright.
What the slide does not do is connect the money to results. The reader learns that the company raised €5.7M over four years but not what it produced. A short line under each round ("seed: first 100 cameras shipped", for instance; our illustration, not Giraffe360's figure) would turn a funding history into a record of capital efficiency.
A history with valuations: Rokoko
Rokoko's slide 15, headed "Fundraising history", in a deck dated July 2022, has four columns. "2019: Funding to date $7M, Pre-money valuation > $20M, Lead investor: North-East Venture, VF Venture, Kickass Capital." "2021: Series A $3M, Pre-money valuation $40M, Lead investor: VF Venture." "2022: Strategic round $3M, Pre-money valuation $80M", highlighted in green as the current round. "2023: Series B $25M", with no valuation.
This is the most informative layout of the four. A reader can see a rising price, from above $20M to $40M to $80M pre-money, which doubles at each step, and a plan for the round after this one. Putting the next round on the slide tells the investor how the current strategic round fits: it is a bridge to a larger Series B, not the final round before profitability.
Two points need care. First, the 2019 column is labelled "Funding to date $7M", which reads as a cumulative total, while the next two columns are single rounds. A reader adding them gets $13M raised by mid-2022 if the 2019 figure is cumulative ($7M + $3M + $3M), but cannot be sure. Labelling the first column "Seed and earlier, 2016 to 2019" and adding a running total would remove the doubt.
Second, showing past valuations sets a reference point. An $80M pre-money for the strategic round invites the question of what changed since the $40M Series A a year earlier. If the deck answers that elsewhere with revenue or customer growth, the valuations help; if not, they hand the investor a question. Founders should show past prices only when they are ready to defend the step-up, and should never show a valuation that falls between rounds without explaining why.
Funding as an efficiency claim: Onfleet
Onfleet's slide 18 has one line of text: "profitable, with only $5m raised to date". Below it are investor logos (Playfair Capital, StartX, Winklevoss Capital, CrunchFund, Stanford University and SGH Capital) and five named individuals: Andy Rachleff, Lee Linden, Jude Gomila, Gil Penchina and Tom Fallows.
This is the strongest framing of the four, because it ties the amount raised to a result. "$5M raised" alone is a fact; "profitable on $5M" is an argument that the company does not need money to survive and that new capital will go to growth. For an investor, that changes the risk of the round.
The limits are what the slide leaves out. It gives no rounds, dates or amounts per investor, and no definition of "profitable" (monthly, annual, on what measure). The source PDF carries no reliable date, so we cannot say at what stage this claim was made. The claim is only as strong as the financial slides that support it; a founder using this line should make sure the profit figures appear elsewhere in the deck, with the period they cover.
A valuation line that does not reconcile: Mio Marketplace
Mio Marketplace's slide 13 combines a revenue projection chart with a "Financing" panel. Under "Funding to Date" it lists: "Founder bootstrapped 2021-2022", "Angel investment $550K in 2022" and "Seeking $150K in Spring 2023". Below that: "Current Valuation: $3.8Million" and "Owner Shares: 80% / Investor Shares: 20%". A "Use of Funds" list follows. The chart shows annual recurring revenue projected from about $2M in 2023 to about $13.5M in 2025, with nothing for 2022.
The funding list itself is honest and readable: it says the founders paid for the first year, names the one outside round, and separates closed money from money sought. That separation is worth copying. Decks that fold a target into "raised to date" mislead.
The trouble is the valuation line. If investors hold 20% of a company worth $3.8M, their stake is worth about $760K ($3.8M x 0.2), against $550K invested. That could mean the angels bought in at a lower price, about $2.75M post-money if $550K bought exactly 20%, and the company now claims a step-up. Or the 20% could include other holders, or the valuation could be the founders' own estimate. The slide does not say which. An investor will ask, and an unclear answer on price early in a conversation costs more than leaving the line off.
There is a second gap. A $150K raise is small next to projected revenue of $2M in 2023, and the slide does not show current revenue. The reader cannot tell whether the projection rests on existing sales. Funding history is most persuasive next to actual results, not projections.
What to include
The total raised, as one number, with its type: equity, convertible notes, grants, loans. If you mix types, list them separately. A grant is not the same as an equity round, and an investor will want to know which money carries ownership.
Each round: year, stage name, amount and lead investor. Check that the rounds add up to the total. If the total includes founder money, say so; if it excludes grants, say so.
What each round achieved, in a few words. The point of funding history is to show what you did with the money. Revenue reached, product shipped, or a profitability milestone, as Onfleet shows, makes the history an argument rather than a list.
Follow-on investment. If existing investors put money into later rounds or this one, say so in words; logos alone leave the reader to spot it.
Money closed versus money sought. Keep commitments for the current round separate from money already in the bank, as Mio does.
Whether to show past valuations
Past valuations are optional, and they cut both ways. Shown well, as on Rokoko's slide, a rising series tells the investor that earlier backers kept paying more. Shown carelessly, they create questions about price before you have made your case.
Show them when the step-ups are consistent with the progress your deck demonstrates and with the price you are asking now. Leave them off when they are flat or falling, when they came from convertible notes without a priced round (where a cap is not a valuation), or when you cannot reconcile them with ownership percentages. If you show ownership, check the arithmetic: investors' share times valuation should be at least in line with what they put in, or you should explain the difference.
Where it goes and how much space it needs
Funding history usually sits on or just before the ask slide, so the reader sees past capital and the new round together. A single line, like Onfleet's, can also sit on the traction or team slide when the point is efficiency. A full timeline earns its own slide only when the history is part of the argument: repeat investors, rising prices, or notable backers.
If you have raised very little, say that too. "Bootstrapped to $400K revenue" is a funding history, and often a strong one.
What these examples can and cannot show
These four slides show different ways to present money already raised. We did not check any amount, valuation or investor against outside records, and we cannot say how investors responded to these decks. Where we calculate a figure, such as Mio's implied investor stake, we show the calculation and say what the slide leaves unexplained; we do not claim the company made an error.
The lesson is about presentation: funding history works when it adds up, is dated, names who invested, and is tied to what the money produced.
Common mistakes
Rounds that do not add up. Check that the total matches the sum of rounds.
Mixing money types. List grants, loans and equity separately.
Target counted as raised. Keep money sought apart from money closed.
Unreconciled valuations. Ownership times valuation should match what investors paid, or be explained.
Money with no result. Say what the capital achieved.
Diagnostic checklist
Total raised with type.
Each round dated with amount and lead.
Rounds add up to the total.
Result tied to the money.
Valuations shown only if consistent.
Frequently asked questions
Should I show how much I have already raised on my pitch deck?
Yes. Investors will ask. Show the total, the rounds and what the money achieved.
Should I include past valuations?
Only if they rise consistently and agree with ownership and the new round's price.
Do grants count as funding to date?
List them, but separately from equity, since they carry no ownership.
What if I have raised nothing?
Say you are bootstrapped and show what you built with your own money.
How we chose these examples
Corpus: published pitch deck teardowns on StartupFundraising.com. Founder-uploaded private decks are excluded.
Selection (2026-10-01): we searched extracted slide text for "raised to date", "funding to date", "funding history" and "prior funding" (about fifty slides), excluded listed-company and SPAC presentations, industry funding figures and placeholder amounts, and kept four slides presenting funding history four different ways.
Review: the four slides were rendered from the source decks at full size on 2026-10-01 and read in full against company, deck and page number; Mio Marketplace's financing text was enlarged at higher resolution (editorial model review, with AI assistance in drafting). Sums and the implied Mio stake were recalculated. No funding figure was checked against outside records. No person has yet completed a human editorial review of this draft.