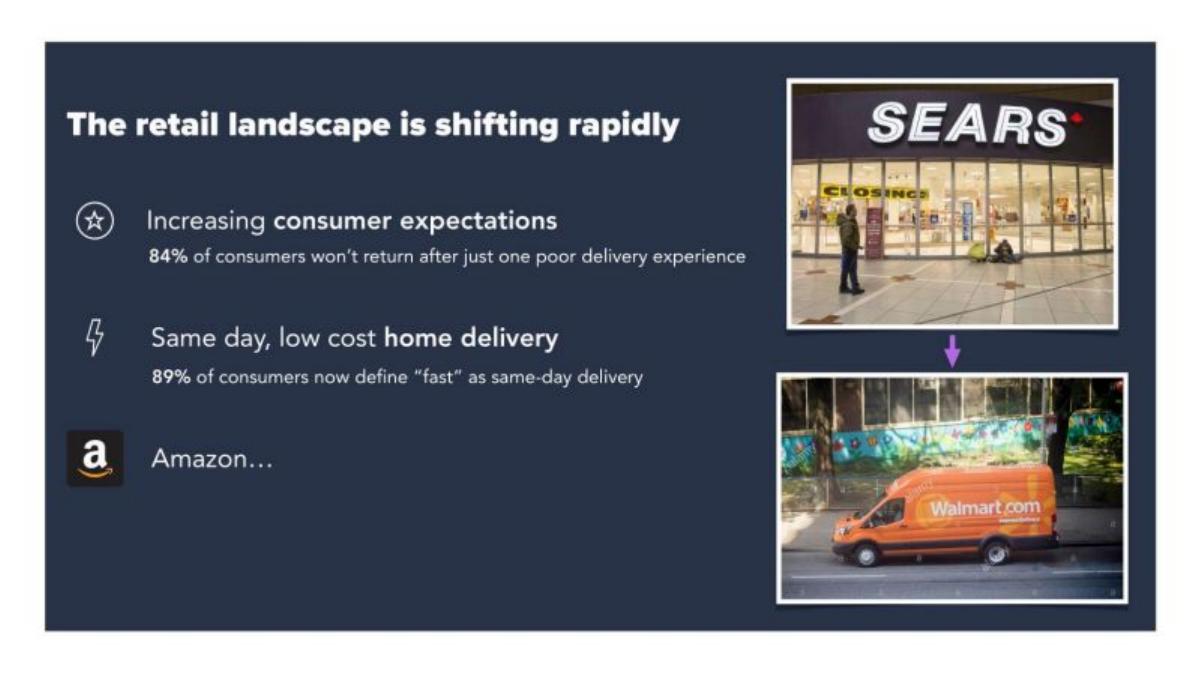
Onfleet’s Series A pitch deck is a textbook example of how to present a mature SaaS product that has moved beyond the 'idea' phase into aggressive scaling. By 2020, the company had already powered over 50 million deliveries and tracked 200 million miles across 90 countries. The deck leans heavily on these massive data points to justify their position as the dominant 'Operating System' for a fragmented industry. While the specific financial figures in this public version are redacted, the growth trends—specifically the doubling of revenue year-over-year and the steady increase in MRR per logo—…
Key takeaways
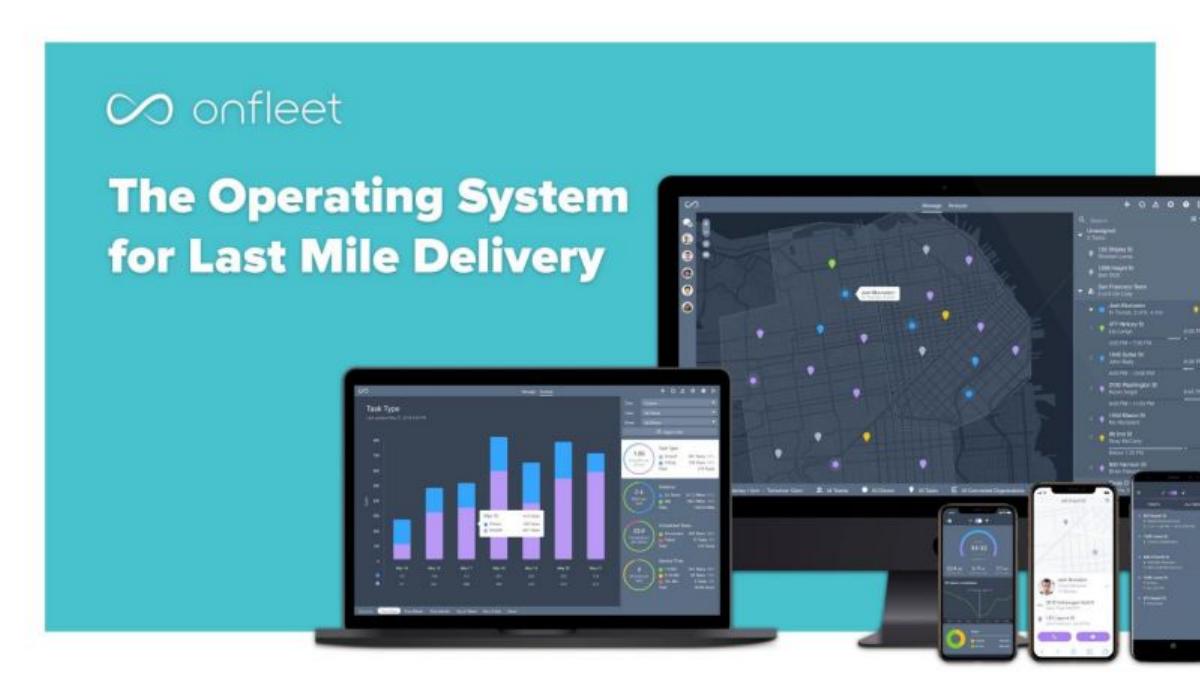
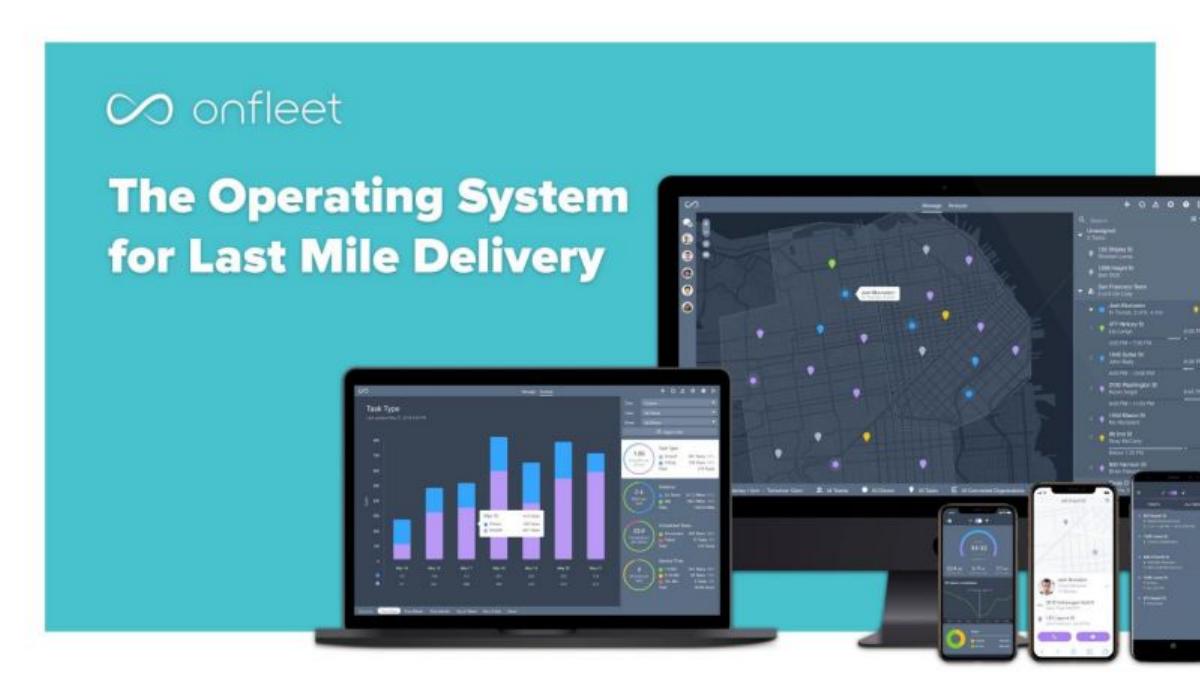
- The company positions itself as the 'Operating System for Last Mile Delivery,' suggesting a foundational role in the logistics stack (Slide 1).
- Onfleet demonstrates massive scale with 50m+ deliveries powered and 200m+ miles tracked at the time of the raise (Slide 5).
- The platform shows global versatility, operating in over 1,000 cities across 90+ countries (Slide 5).
- A significant data moat is highlighted, with 250m miles of proprietary high-resolution location data used to train ML models (Slide 7).
- The deck identifies a 'fragmented, sleepy industry' dominated by manual dispatch or legacy incumbents like Descartes and Workwave (Slide 8).
- Traction is validated by a roster of 800 retailers and delivery businesses, including Gap, Kroger, and Sweetgreen (Slide 6).
- Appendix C shows a consistent upward trend in MRR per logo from Q1 2018 through April 2020, indicating successful upselling or moving upmarket.
- The founding team brings strong academic and industry pedigree from Stanford, Carnegie Mellon, IBM, and Michigan (Slide 10).
The Operating System for Last-Mile Delivery
Onfleet’s Series A deck, which helped secure $14 million in 2020, is a masterclass in presenting a 'utility' SaaS. The company does not spend time explaining why delivery is important; instead, it focuses on the sheer scale of their existing operations and the sophistication of their technology. By framing themselves as an 'Operating System,' they move the conversation away from being a simple tool and toward being an essential infrastructure component for any business that moves physical goods.
Slide 1-3: The Vision and Product Scope
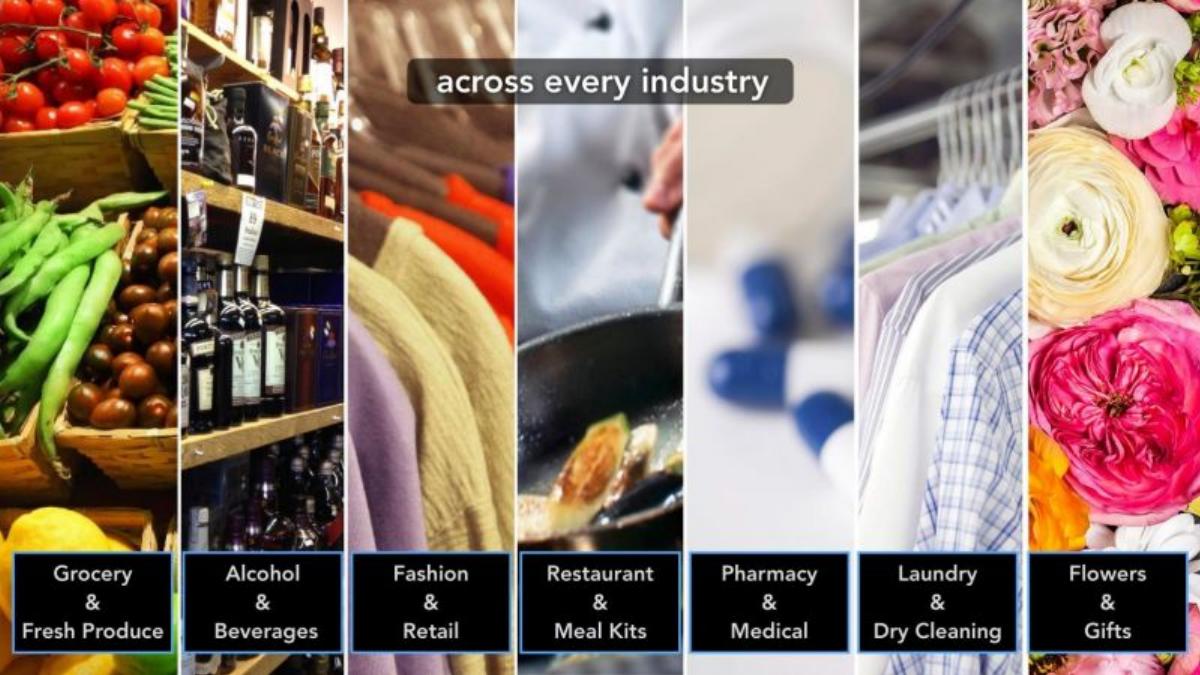
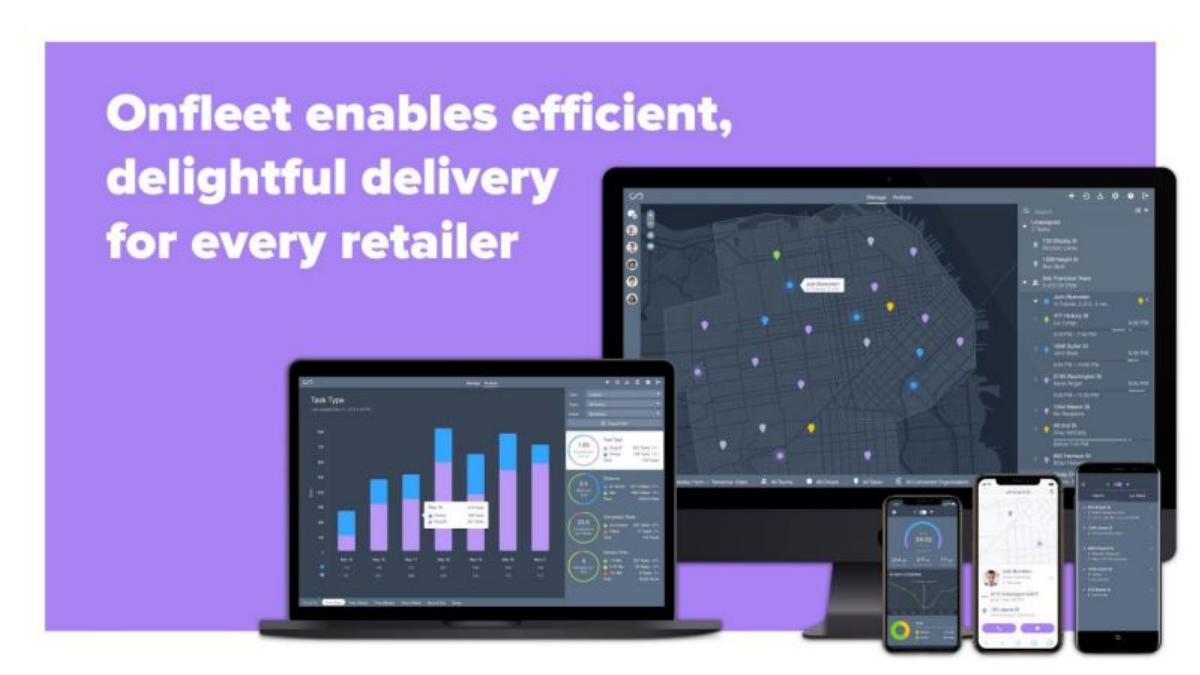
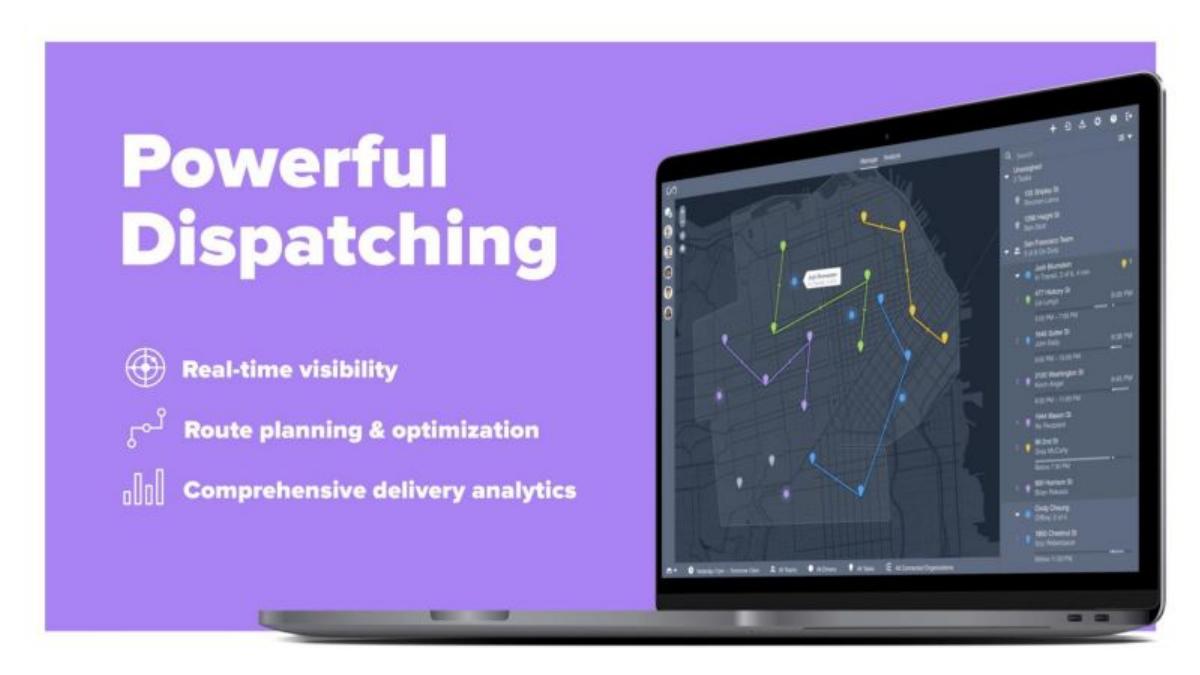
The deck opens with a bold claim on Slide 1 : 'The Operating System for Last Mile Delivery.' The visual shows the software across multiple form factors—desktop, tablet, and mobile—signaling a complete end-to-end solution. Slide 2 immediately addresses market size and versatility by showing a collage of industries. By listing everything from 'Grocery & Fresh Produce' to 'Flowers & Gifts,' Onfleet tells investors that their Total Addressable Market (TAM) isn't just one niche; it is the entire retail economy. Slide 3 reinforces this, stating they enable 'efficient, delightful delivery for every retailer,' again using product mockups to show the UI's cleanliness and depth.
Slide 4: The Driver Experience
Slide 4 focuses on the 'Intuitive Driver Apps.' In last-mile logistics, the driver's interface is often the weakest link. Onfleet highlights four key features: Online & offline tracking, streamlined communications, proof of delivery, and driver analytics. The inclusion of 'offline tracking' is a subtle but critical technical detail for logistics investors, acknowledging the reality of 'dead zones' in urban and rural delivery routes.
Slide 5-6: Massive Scale and Social Proof
Slide 5 is the 'Traction' slide, and it is formidable. It lists '50m+ deliveries powered,' '200m+ miles tracked,' '1000+ cities,' and '90+ countries.' For a Series A, these are high-water mark numbers that suggest the product is already globally battle-tested. Slide 6 follows up with a logo wall of 800 retailers. The presence of household names like Gap and Kroger alongside high-growth startups like Sweetgreen and Drizly proves that the platform scales from small delivery businesses to massive enterprise retailers.
Slide 7: The Data Moat
Slide 7 is perhaps the most important slide for a technical or institutional investor. It claims 'Over 250m miles of proprietary high-resolution location data trains ML models used in ETA and optimization algorithms.' This is Onfleet’s 'unfair advantage.' In a world where anyone can build a basic routing app, Onfleet argues that their massive historical dataset allows them to predict ETAs and optimize routes better than any new entrant could. It transforms the company from a software play into an AI/data play.
Slide 8: The Competitive Landscape
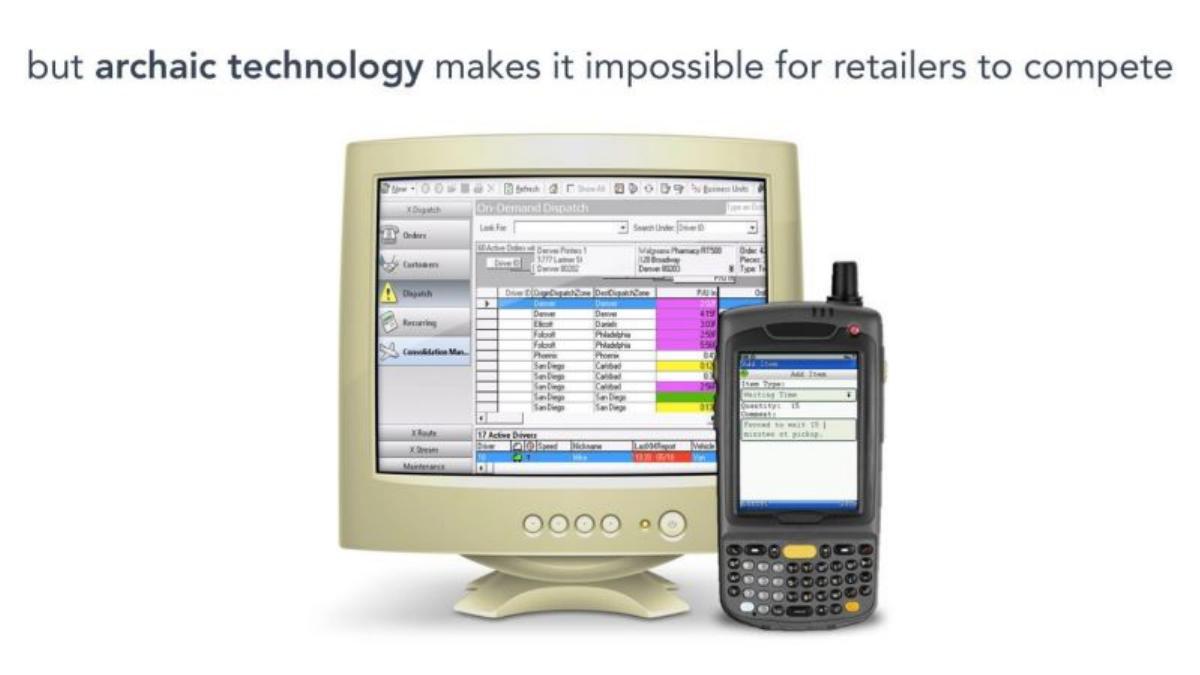
Slide 8 defines the 'why now.' It describes the industry as 'fragmented' and 'sleepy.' It pits Onfleet against two main enemies: the status quo (Excel and manual dispatch) and legacy incumbents (Descartes, Workwave, CXT). By labeling incumbents as 'sleepy,' Onfleet positions itself as the agile, modern alternative that is easier to implement and more powerful to use.
Slide 9-10: Growth and Team
Slide 9 is titled 'Doubling Revenue YoY.' While the specific chart is redacted in this version, the headline tells the story. Investors at the Series A stage are looking for the 'T2D3' (triple, triple, double, double, double) growth path, and Onfleet is signaling they are on track. Slide 10 introduces the 'Founding Team.' The pedigree is high, featuring David Vetrano (CTO), Mikel Cármenes-Cavia (VP Engineering), and Khaled Naim (CEO). Their backgrounds include Stanford Engineering and Business, Carnegie Mellon, IBM, and the University of Michigan, providing the necessary 'founder-market fit' credibility.
Appendix Slides: Granular Metrics
The appendix slides (11-13) provide the 'receipts' for the claims made earlier. Appendix A lists a comprehensive set of 21 different segments they serve, including 'Cannabis,' '3PL,' and 'Construction.' Appendix C is particularly revealing; it shows 'MRR per Logo' from Q1 2018 to April 2020. The bar chart shows a consistent, stair-step increase in how much each customer pays per month. This is a vital metric because it proves that Onfleet is either moving upmarket to larger customers or successfully upselling their existing base—both are indicators of a healthy SaaS business. Appendix D mentions '2020 Pipeline Stats,' though the content is redacted, it suggests the company had a clear view of its future growth at the time of the pitch.
What Works in this Deck
The Data Moat: Explicitly stating the number of miles tracked and how that data improves the product (Slide 7) creates a compelling argument for long-term defensibility. · Vertical Agnosticism: By showing they work for pharmacies, laundromats, and grocery stores, they prove the product is a horizontal platform, which usually commands higher valuations than niche tools. · Global Footprint: Operating in 90+ countries (Slide 5) at the Series A stage is rare and suggests a highly scalable, self-serve or low-touch onboarding process. · MRR per Logo Growth: Showing that customers are paying more over time (Appendix C) is the best way to prove product value and 'stickiness.'
What is Missing
The Ask: The provided slides do not include a specific 'Ask' slide detailing how much they are raising (though we know from the catalogue it was $14M) or how they plan to spend the capital. · Unit Economics: While MRR per logo is shown, there is no mention of Customer Acquisition Cost (CAC) or Lifetime Value (LTV) ratios, which are standard for Series A SaaS decks. · Churn/Retention: The deck shows new growth and increasing revenue per logo, but it doesn't explicitly show net revenue retention or churn rates. · Roadmap: The deck focuses heavily on what has been built and the current scale, but it lacks a 'Future' slide showing where the product goes next (e.g., autonomous vehicle integration, warehouse management, etc.).
Founder Lessons
Lead with Scale: If you have processed millions of transactions, make that the centerpiece of your deck. Onfleet uses '50m+ deliveries' as a shield against any questions about product-market fit. · Define the Moat Early: Don't just say you have a better algorithm; explain why it's better. Onfleet’s use of 250m miles of data to train ML models is a concrete explanation of technical superiority. · Show, Don't Just Tell, Versatility: Instead of saying 'we work for many industries,' Onfleet used a visual collage (Slide 2) and a detailed list (Appendix A). This makes the claim feel real. · Use Appendices for the 'Nitty Gritty': Keep the main deck high-level and visionary, but put the granular charts (like MRR per logo) in the appendix to satisfy the analytical investors during the Q&A phase.
Frequently asked questions
- What is Onfleet's primary value proposition according to the deck?
- Onfleet positions itself as the 'Operating System for Last Mile Delivery.' The deck emphasizes that the platform enables 'efficient, delightful delivery for every retailer' by providing intuitive driver apps, real-time tracking, and advanced route optimization. It aims to replace manual processes (like spreadsheets) and outdated legacy software with a modern, data-driven SaaS solution.
- How does Onfleet demonstrate its competitive advantage or 'moat'?
- The core moat is data. Slide 7 explicitly states that Onfleet has over 250 million miles of proprietary high-resolution location data. This data is used to train machine learning models for ETA prediction and optimization algorithms. This creates a flywheel effect: more deliveries lead to better data, which leads to better optimization, attracting more customers.
- Which industries does Onfleet serve?
- The deck highlights extreme vertical diversity. Slide 2 and Appendix A list sectors including Grocery & Fresh Produce, Alcohol & Beverages, Fashion & Retail, Restaurant & Meal Kits, Pharmacy & Medical, Laundry & Dry Cleaning, Flowers & Gifts, and even Cannabis and Construction. This breadth suggests the software is a horizontal solution for a vertical problem.
- What does the traction look like for Onfleet at the Series A stage?
- The traction is substantial. By the 2020 Series A, they had powered over 50 million deliveries and were tracking over 200 million miles. They served 800+ retailers and were active in 90+ countries. Furthermore, Slide 9 claims they were doubling revenue year-over-year, and Appendix C shows that the average revenue per customer (MRR per logo) was steadily increasing.
- Who are the key competitors identified in the pitch?
- Onfleet categorizes its competition into two groups on Slide 8. The first is 'Manual dispatch or in-house development,' represented by icons for paper, pencils, and Excel. The second is 'Legacy incumbents,' specifically naming Descartes, Workwave Route Manager, and CXT Software. Onfleet frames the industry as 'fragmented' and 'sleepy,' positioning themselves as the modern disruptor.