OnFarm’s seed deck is remarkably brief, consisting of only seven slides. Despite the lack of a traditional team slide, competition matrix, or detailed financial projections, the company successfully raised $1,200,000 in 2012. The deck leans heavily on 'show, don't tell' principles, featuring a prominent product mockup on every slide and lead-generating traction metrics like $30k MRR and 3 million daily data readings. By anchoring the pitch in a massive $24 billion market opportunity and showcasing partnerships with industry giants like John Deere and Rain Bird, OnFarm positioned itself as the…
Key takeaways
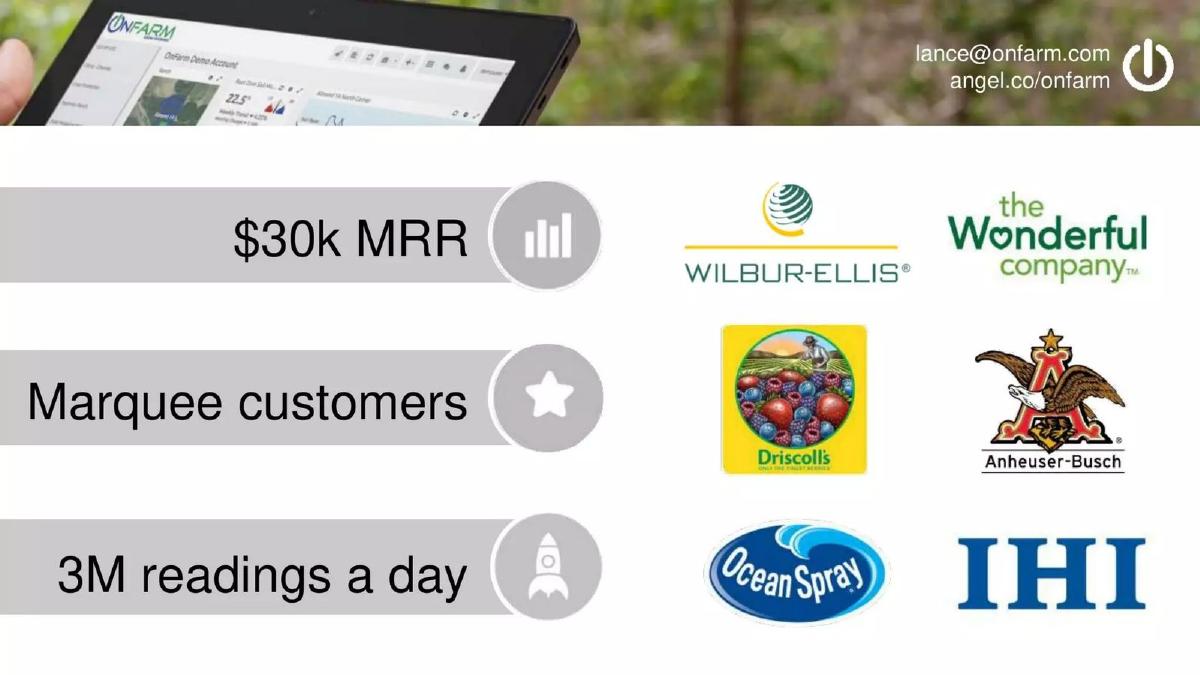
- The deck leads with traction, highlighting $30k MRR and 3 million readings per day on Slide 2.
- OnFarm establishes immediate credibility by displaying logos of marquee customers like Anheuser-Busch, Ocean Spray, and Driscoll's on Slide 2.
- The macro-problem is framed as a global food security issue, citing a need for 70% more food for 2 billion more people on Slide 3.
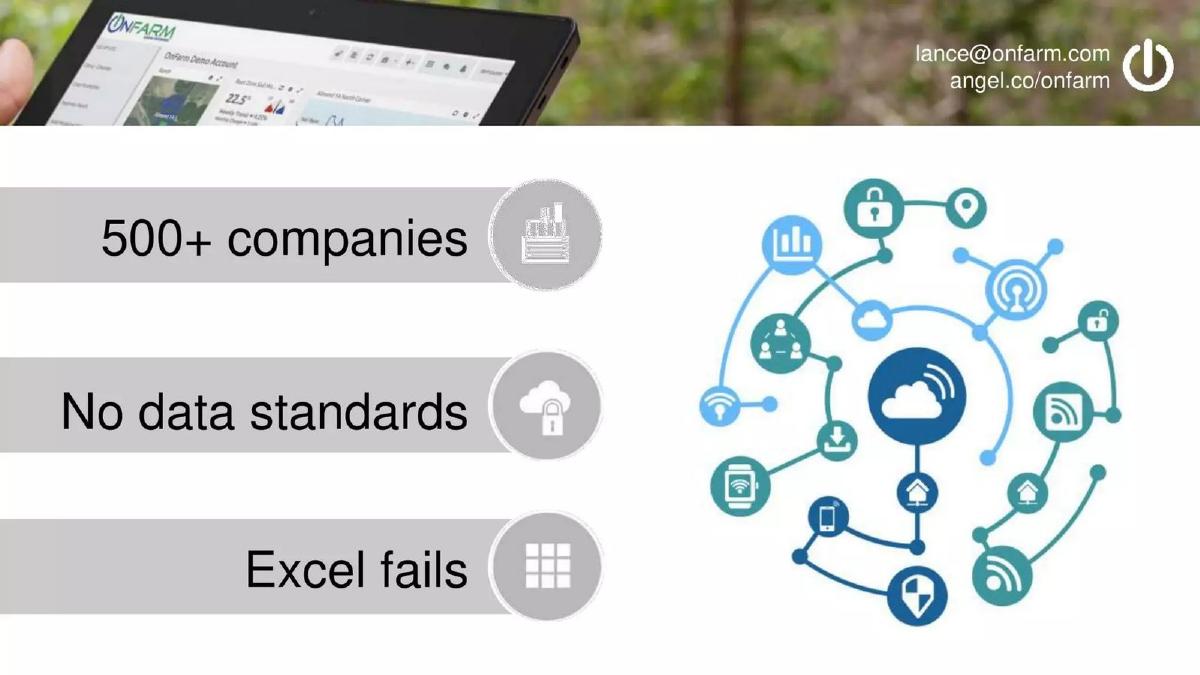
- The technical problem is identified as a lack of data standards among 500+ companies where 'Excel fails' on Slide 4.
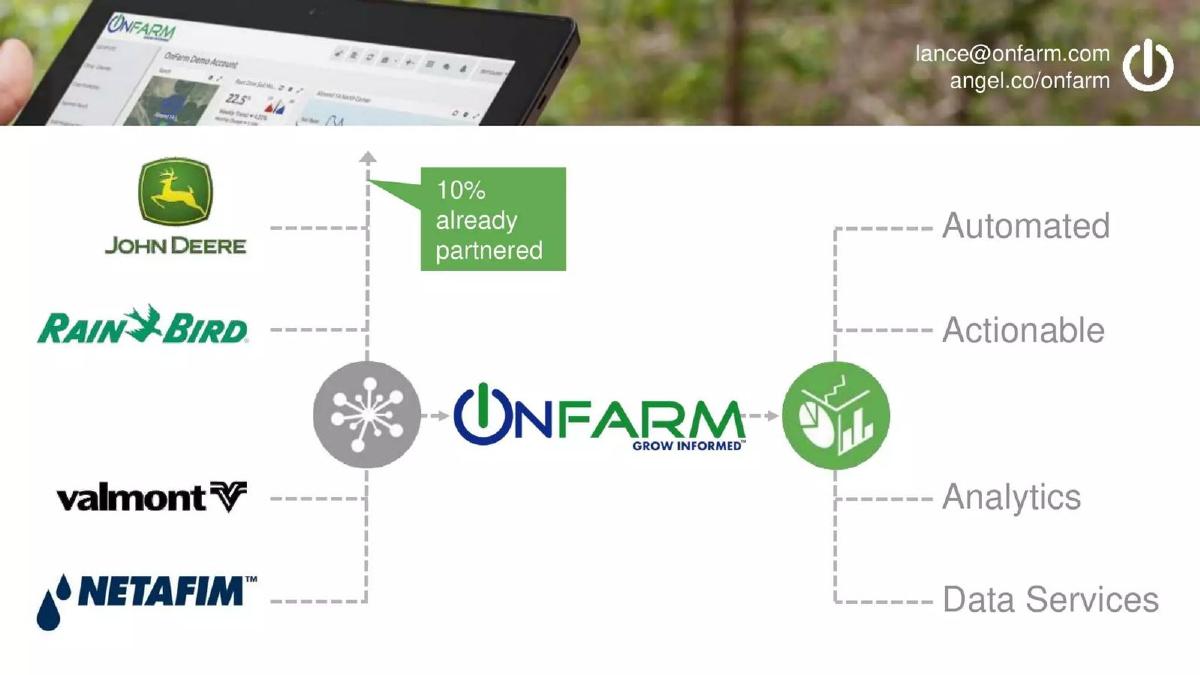
- OnFarm positions itself as an integration layer, claiming 10% of the market is already partnered, including John Deere and Netafim on Slide 5.
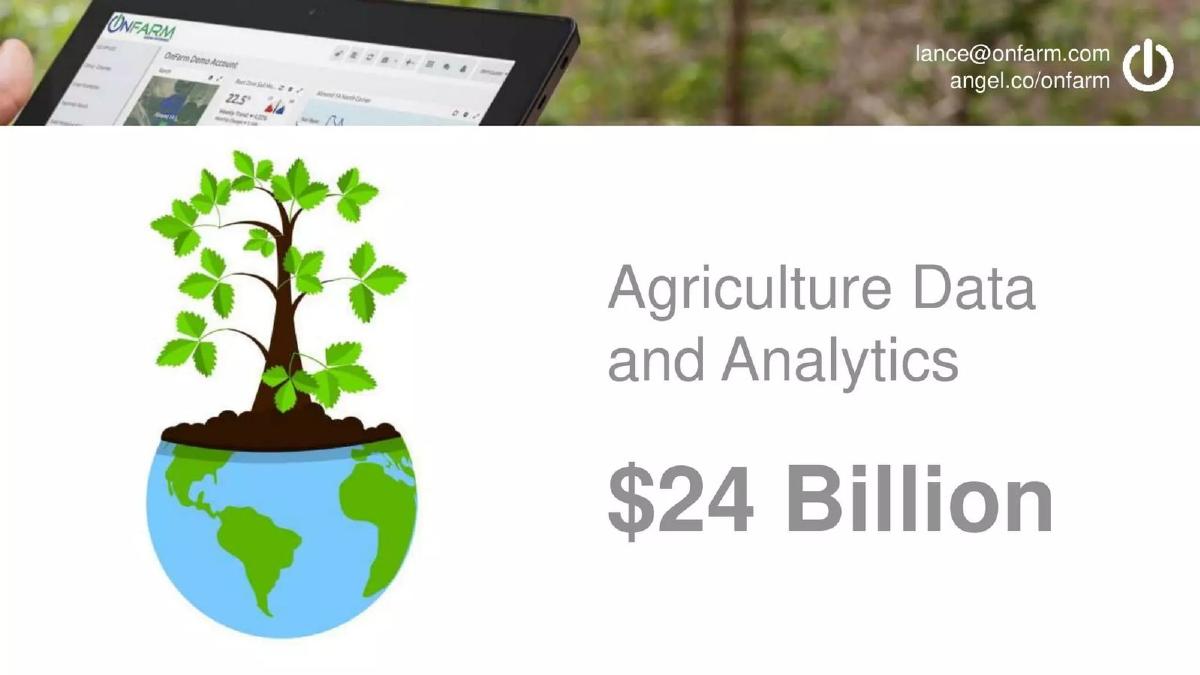
- The total addressable market for agriculture data and analytics is valued at $24 billion on Slide 6.
- The deck completely omits a team slide, a detailed business model, and a specific funding ask.
- A consistent visual motif of a tablet displaying the dashboard is used across all seven slides to emphasize product readiness.
The 7-Slide Seed Strategy
The OnFarm pitch deck from 2012 is an anomaly in the world of fundraising. While modern founders are often told to prepare 15 to 20 slides covering everything from unit economics to go-to-market strategies, OnFarm secured $1.2 million using just seven slides. This deck is a masterclass in minimalism, relying on the strength of its early traction and the gravity of the problem it solves. It doesn't explain how the technology works; it explains why the technology is inevitable.
Slide 1: The Vision Statement
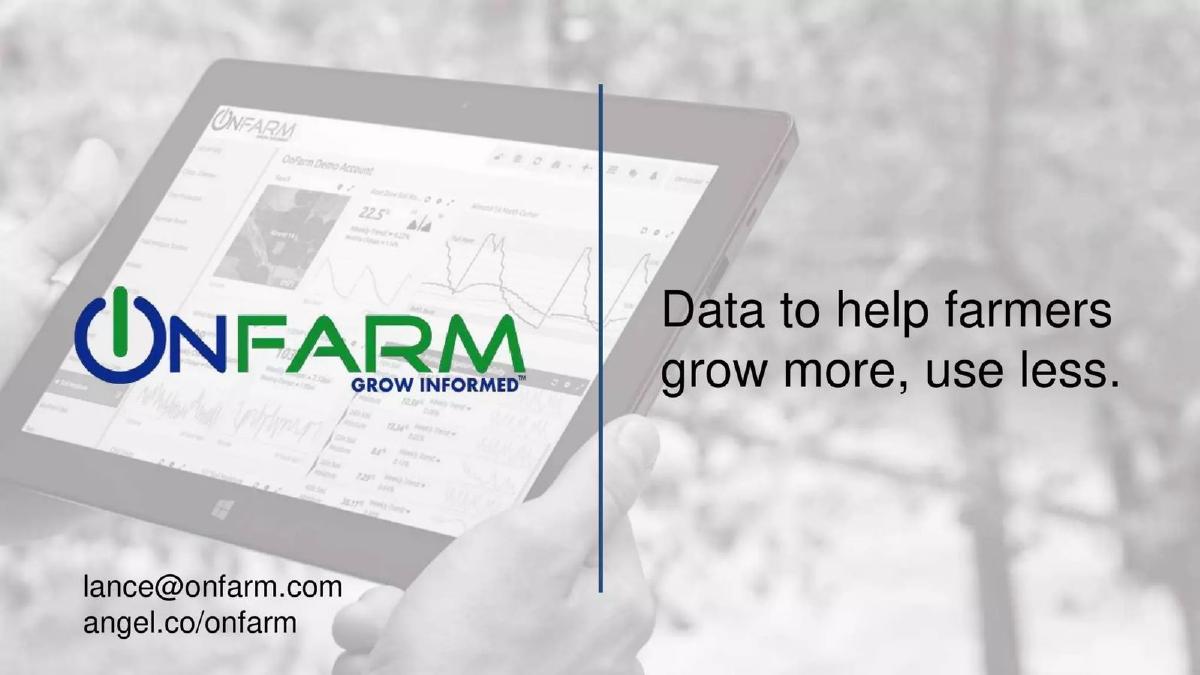
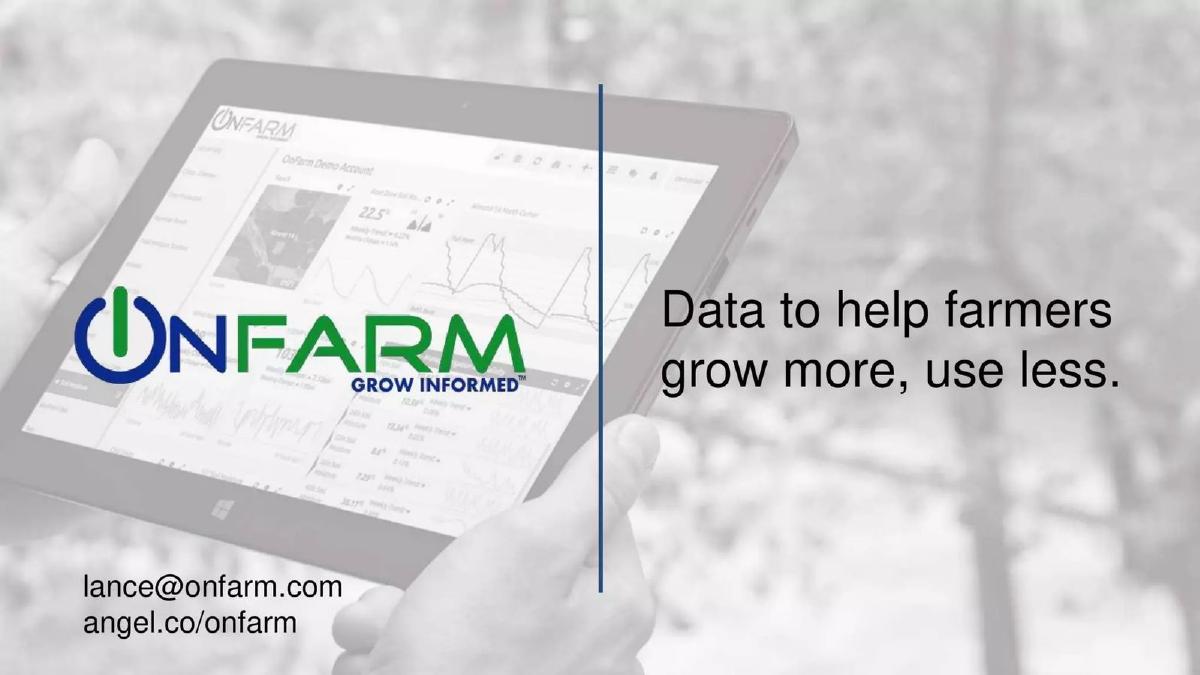
The cover slide sets a professional tone immediately. It features a high-resolution image of a tablet displaying the OnFarm dashboard, held in a field environment. The tagline, "Data to help farmers grow more, use less," is a concise value proposition that addresses both the economic (grow more) and environmental/efficiency (use less) concerns of the industry. Notably, the slide includes a direct email for the founder and a link to their AngelList profile, signaling transparency and a call to action from the very first second.
Slide 2: Traction and Social Proof
Most decks wait until slide 10 to show traction; OnFarm puts it on slide 2. This is a high-confidence move. The slide lists three key metrics: "$30k MRR," "Marquee customers," and "3M readings a day." By 2012 standards, $30,000 in monthly recurring revenue for a seed-stage ag-tech startup was significant. The right side of the slide is a 'wall of logos' featuring heavy hitters: Wilbur-Ellis, The Wonderful Company, Driscoll's, Anheuser-Busch, Ocean Spray, and IHI. This immediately answers the question of whether large enterprises will buy this product.
Slide 3: The Macro Problem
Slide 3 pivots to the 'Why Now?' and the global scale of the opportunity. It uses a graphic of a globe made of people to highlight three staggering statistics: "2B more people," "70% more food," and "85% from ag-tech." This frames OnFarm not just as a dashboard for farmers, but as a critical piece of infrastructure for global food security. It connects the micro-task of sensor monitoring to the macro-necessity of feeding a growing population.
Slide 4: The Technical Gap
Slide 4 identifies the specific market friction. It notes there are "500+ companies" in the space but "No data standards." The punchline is "Excel fails." This is a powerful way to describe the competition. Instead of listing other startups, OnFarm identifies the current manual process (Excel) as the primary enemy. The graphic on the right shows a fragmented ecosystem of clouds, mobile devices, and sensors, implying that OnFarm is the central hub that connects these disparate nodes.
Slide 5: The Solution and Ecosystem
Slide 5 illustrates how OnFarm sits in the middle of the agricultural value chain. On the left, it shows hardware and irrigation giants like John Deere, Rain Bird, Valmont, and Netafim. A green callout box claims "10% already partnered." The diagram shows data flowing from these hardware providers through OnFarm to produce four outputs: "Automated, Actionable, Analytics, and Data Services." This slide effectively communicates that OnFarm is a platform, not just a tool, and that it has already begun the hard work of technical integration with industry incumbents.
Slide 6: Market Size
Slide 6 is a standard TAM (Total Addressable Market) slide but kept extremely simple. It features a graphic of a plant growing out of a globe and a single large figure: "Agriculture Data and Analytics $24 Billion." There is no breakdown of SAM (Serviceable Addressable Market) or SOM (Serviceable Obtainable Market), which is a notable omission, but the $24 billion figure is large enough to justify venture-scale returns.
Slide 7: The Product Close
The final slide returns to the imagery of the first slide—the tablet in the field—but makes the dashboard the focal point. The logo and tagline "GROW INFORMED" are centered. It repeats the contact information. This brings the presentation full circle, ending on the product itself rather than a 'Thank You' slide, which is a better use of visual real estate.
What Works in This Deck
The primary strength of this deck is its signal-to-noise ratio. Every slide serves a specific purpose: validation, problem, market, or solution. By leading with $30k MRR and a list of world-class customers, the founders effectively neutralized the skepticism that often meets early-stage ag-tech companies. The consistent use of the product mockup on every slide reinforces that this is not vaporware; it is a functional, deployed solution.
The partnership slide (Slide 5) is particularly effective. In agriculture, hardware is king. By showing logos like John Deere and Rain Bird, OnFarm positioned itself as a collaborator rather than a disruptor. This is a crucial distinction for investors who fear the long sales cycles and entrenched interests of the farming industry. It suggests that OnFarm is riding the wave of existing hardware adoption rather than trying to replace it.
What is Missing
The most glaring omission is a Team Slide. In almost every fundraising context, the background of the founders is the most important factor at the seed stage. While the catalogue facts mention founder Lance Donny, the deck itself provides no context on his expertise in agriculture or software. This suggests the deck was likely used in a context where the team's background was already known or presented separately.
Additionally, there is no Business Model slide. While we know it is SaaS, the deck doesn't explain how they charge—is it per acre, per sensor, or a flat enterprise fee? There is also no Competition slide. While Slide 4 mentions 'Excel fails,' it ignores other emerging ag-tech platforms that were appearing in 2012. Finally, there is no Ask Slide. The deck doesn't state how much money is being raised or what the milestones for that capital will be. This makes the deck feel more like a high-level teaser than a complete investment memorandum.
What a Founder Should Copy
Founders should emulate the "Traction First" approach of Slide 2. If you have revenue and marquee customers, do not bury them. Putting your strongest evidence of product-market fit at the beginning of the deck changes the way investors view every subsequent slide. It moves the conversation from "Will this work?" to "How big can this get?"
Another takeaway is the visual consistency. Using the same background image (the tablet in the field) creates a cohesive brand identity throughout the short presentation. It keeps the investor focused on the product's utility in its natural environment. Lastly, the use of simple, punchy headers like "Excel fails" or "10% already partnered" is far more effective than long paragraphs of text. A pitch deck is a visual aid for a conversation, not a document meant to be read in isolation, and OnFarm understood this perfectly.
Frequently asked questions
- How did OnFarm raise $1.2M with only 7 slides?
- OnFarm focused on high-signal metrics and social proof. By showing $30k in MRR and logos like Anheuser-Busch and John Deere, they proved product-market fit and industry acceptance. For seed investors, these indicators of traction often outweigh the need for a long, descriptive deck. The brevity suggests a 'hot' round where the founders let the numbers speak for themselves.
- Is it a mistake to omit the team slide?
- Generally, yes. Investors back people at the seed stage. However, OnFarm likely used this deck as a visual aid for a live presentation or an AngelList profile (as indicated by the angel.co link on every slide) where the founder's bio was already prominent. In a standalone deck, omitting the team is a high-risk move that usually requires significant traction to overcome.
- What is the 'Excel fails' argument on slide 4?
- This is a classic 'status quo' competitor slide. OnFarm argues that while there are 500+ ag-tech companies, the lack of data standards forces farmers to use Excel, which cannot handle the scale or complexity of modern sensor data. It positions OnFarm not as another sensor company, but as the software layer that replaces manual, failing spreadsheets.
- Why is the John Deere logo so prominent on slide 5?
- John Deere is the dominant incumbent in agriculture. By showing a partnership (noted as '10% already partnered'), OnFarm signals that they aren't fighting the giants; they are integrating with them. This reduces the perceived risk of the startup being crushed by established hardware manufacturers and suggests a clear path to scale through existing ecosystems.
- What is missing from the business model explanation?
- The deck mentions it is a SaaS company (Catalogue Fact) and shows $30k MRR, but it never explains the pricing tiers, the cost of customer acquisition (CAC), or the lifetime value (LTV). It also fails to mention if there is a hardware component or if they are purely software-only, which is a critical distinction for margins in the ag-tech sector.