Agtech Market Size Slides: 6 Real Examples from Farming
How agtech startups size their market: acres × price per acre, farmers in the countries they start in, and a share of a sector forecast.
Agtech Market Slide: Acres, Farmers and What Each Pays
Farming can be counted in acres, hectares, farms and farmers, and governments publish most of those numbers. So an agtech market slide can multiply a real count by a real price. The six slides below range from a one-line acres × price sum to a map with farmer counts and no dollar figure.
TL;DR
Count the acres or farmers you can serve, multiply by what each pays you a year, and name where you start. Blue White Robotics is the clearest example: 30 million acres of permanent crops × $500 a year per acre = $15B. Pollitrace names its first market, 5 million connected farmers in three countries.
Agtech market slides from real pitch decks
Each example shows the slide above its analysis and links to the full teardown. Ground-up calculations come first. Claims are as shown on the slides; comments and calculations are ours.
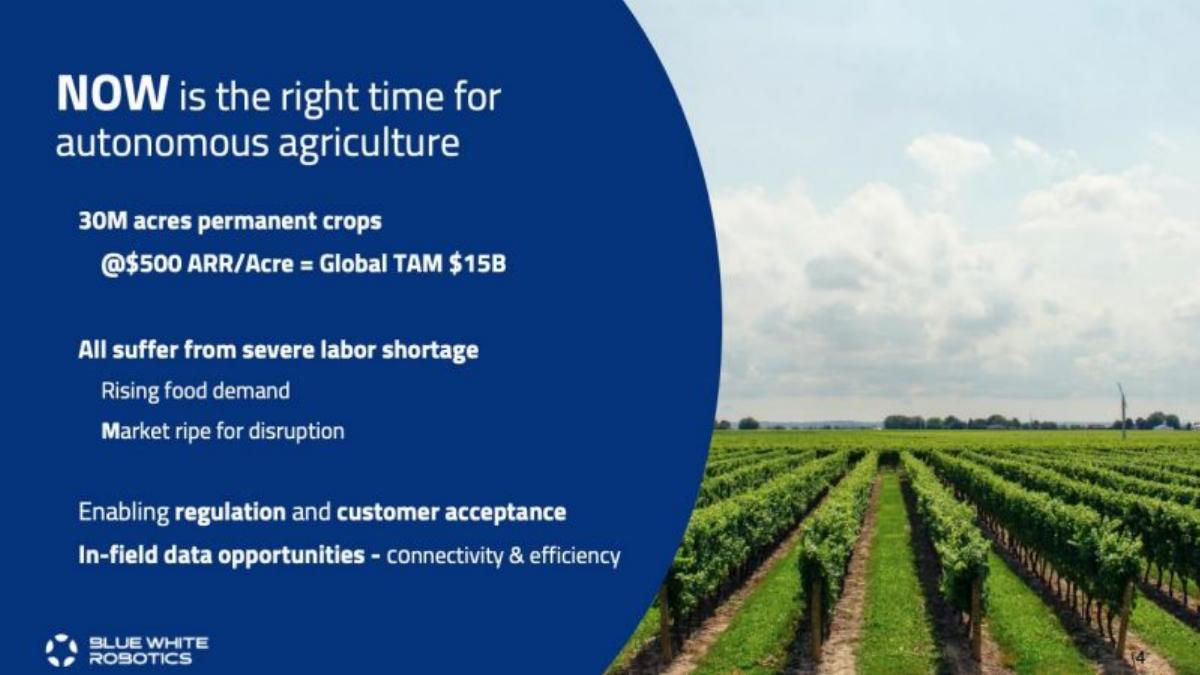
Blue White Robotics market slide — slide 4
Autonomous tractors and farm robotics.
Blue White Robotics deck, slide 4. Exact stored slide matched to this analysis.
Our analysis: Acres × yearly revenue per acre.
Evidence and limitation: A count, a yearly price per unit and the product. Our check: 30M × $500 = $15B, as shown. The slide doesn't source the acreage or say where Blue White starts.
What a founder can adapt: "[N] acres of [crop] ([source]) × $[ARR]/acre = $[X]; we start in [region]."
Supporting analysis
What the deck claims: "NOW is the right time for autonomous agriculture." "30M acres permanent crops @$500 ARR/Acre = Global TAM $15B." "All suffer from severe labor shortage. Rising food demand. Market ripe for disruption." "Enabling regulation and customer acceptance." "In-field data opportunities – connectivity & efficiency."
Presentation choice: One line investors can check and challenge.
When it does not fit: Leaving out the first region.
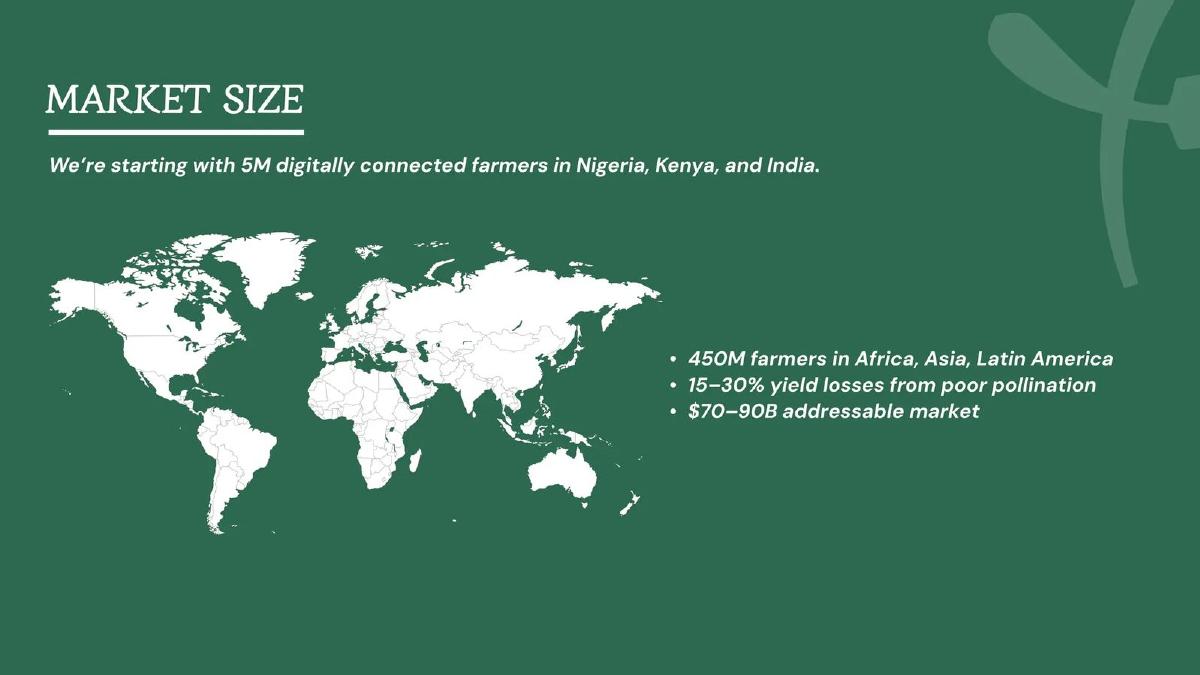
Pollitrace deck, slide 5. Exact stored slide matched to this analysis.
Our analysis: Starting farmers inside a wider base, plus a range.
Evidence and limitation: A first market, a wider farmer count, the problem size and a range. Our calculation: $70–90B ÷ 450M farmers is about $155–200 per farmer. The slide doesn't say whether that is crop value lost or what farmers would pay Pollitrace.
What a founder can adapt: "Start: [N] farmers in [countries] × $[price] = $[X]; wider base [M] farmers."
Supporting analysis
What the deck claims: "Market Size." "We're starting with 5M digitally connected farmers in Nigeria, Kenya, and India." "450M farmers in Africa, Asia, Latin America." "15–30% yield losses from poor pollination." "$70–90B addressable market."
Presentation choice: The first market is named; the dollar basis isn't.
When it does not fit: Lost crop value presented as spend on your product.
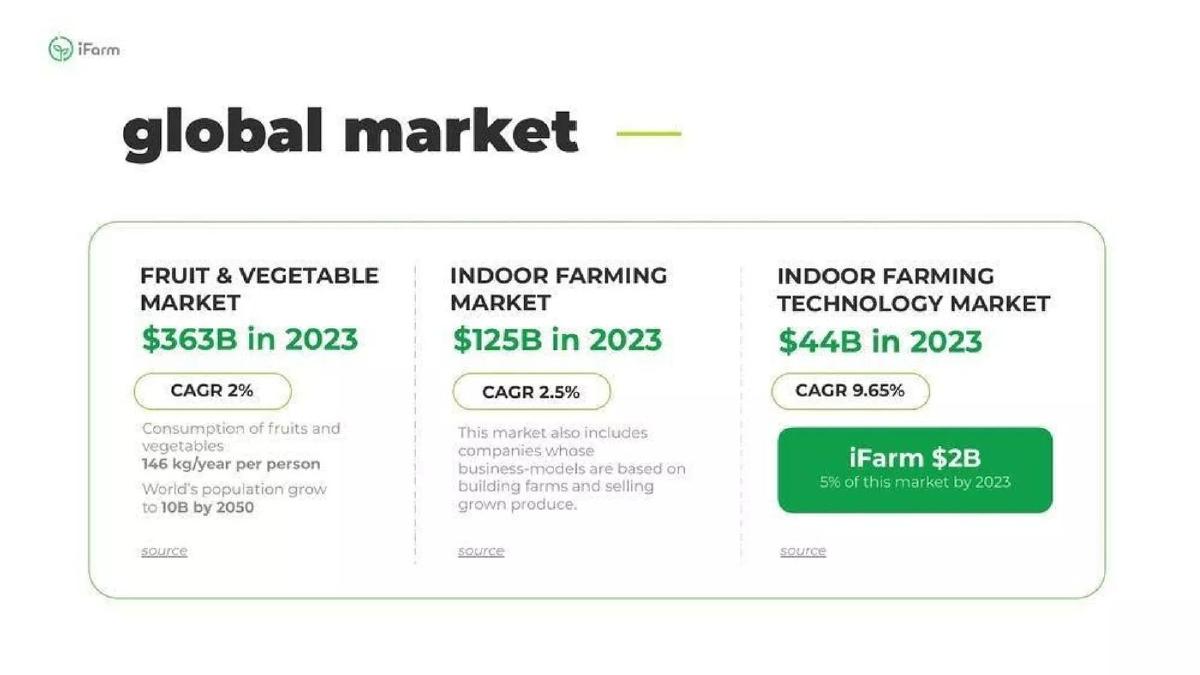
iFarm deck, slide 3. Exact stored slide matched to this analysis.
Our analysis: Produce › indoor farming › indoor tech, plus a share.
Evidence and limitation: Three nested markets with growth rates and a share target for the narrowest one. Our calculation: 5% of $44B is $2.2B, which the slide shows as $2B. It doesn't show how the 5% would be reached.
What a founder can adapt: "[Sector] $[X] › [segment] $[Y] › [your market] $[Z]; target [%] = $[W] by [year] via [N] customers."
Supporting analysis
What the deck claims: "Global market." "Fruit & vegetable market: $363B in 2023, CAGR 2%. Consumption of fruits and vegetables 146 kg/year per person. World's population grow to 10B by 2050." "Indoor farming market: $125B in 2023, CAGR 2.5%. This market also includes companies whose business-models are based on building farms and selling grown produce." "Indoor farming technology market: $44B in 2023, CAGR 9.65%." "iFarm $2B: 5% of this market by 2023."
Presentation choice: The target sits in the market iFarm sells into.
When it does not fit: A share target with no customer count behind it.
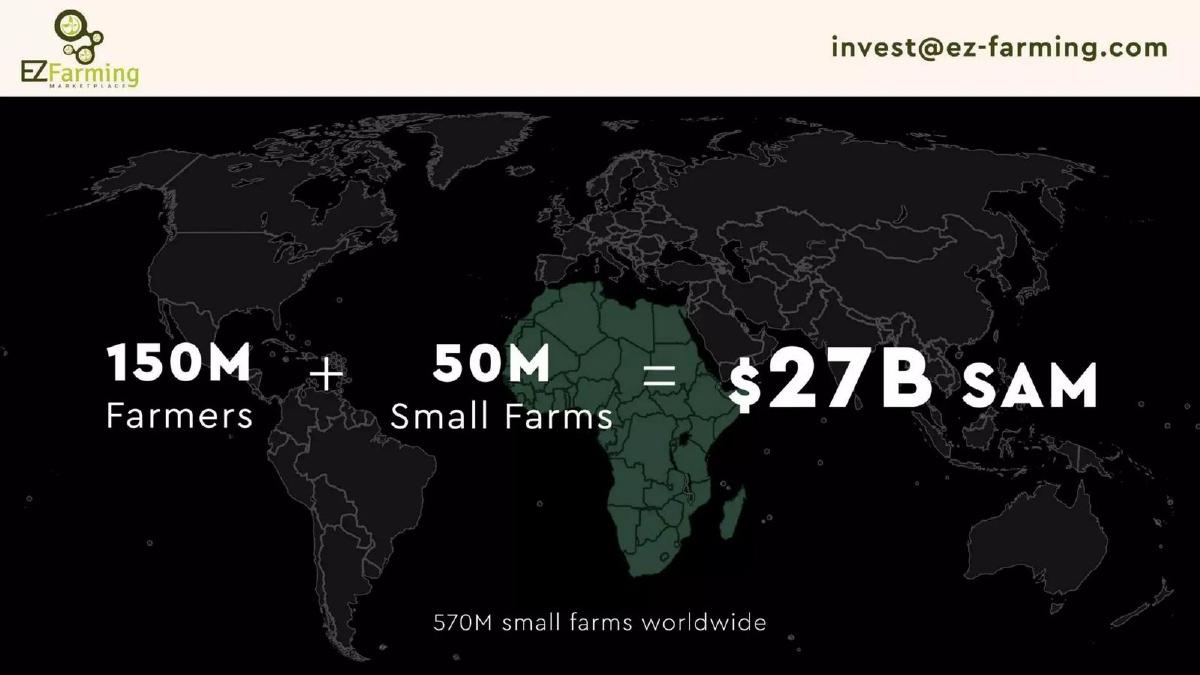
EZ Farming deck, slide 3. Exact stored slide matched to this analysis.
Our analysis: Counts added together, no price.
Evidence and limitation: Counts, a global total and a SAM. The slide adds farmers and farms, which are different units and may overlap, and doesn't give the price per unit. Our calculation: $27B ÷ 200M is $135 each, if the two counts were added.
What a founder can adapt: "[N] small farms in [region] ([source]) × $[price] = $[X]."
Supporting analysis
What the deck claims: "150M Farmers + 50M Small Farms = $27B SAM." "570M small farms worldwide." The map highlights Africa.
Presentation choice: Starts from real units; the sum mixes them.
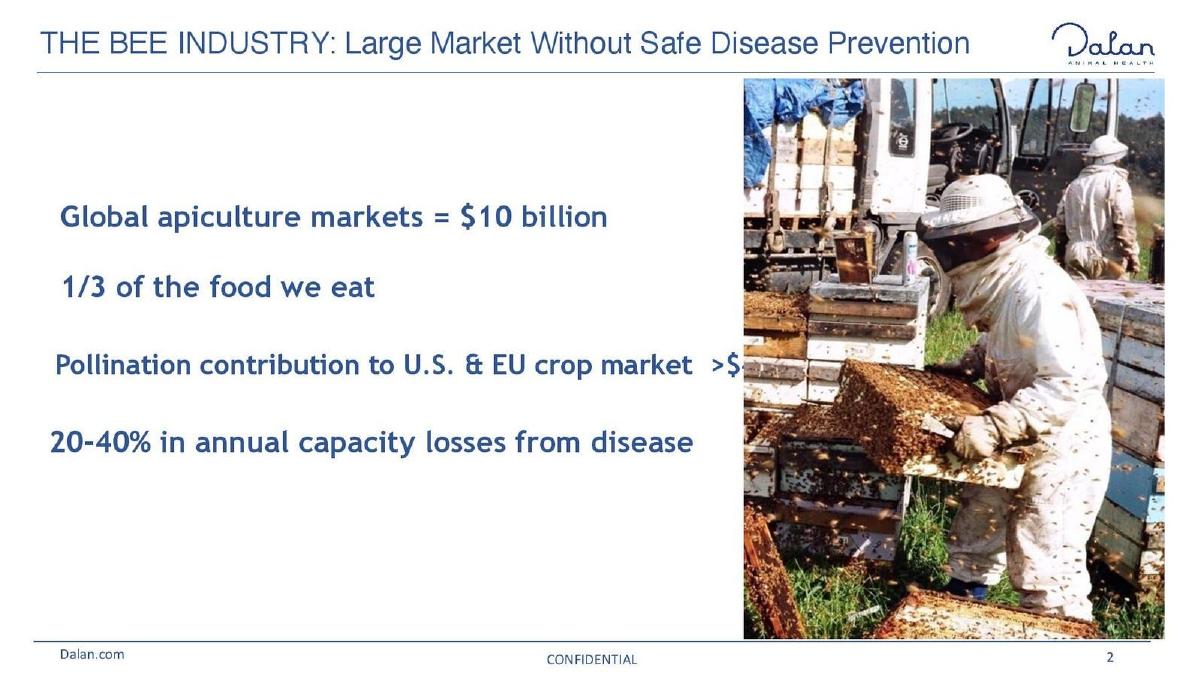
Dalan Animal Health deck, slide 2. Exact stored slide matched to this analysis.
Our analysis: Sector total with problem context.
Evidence and limitation: A sector total, the losses Dalan addresses and pollination value, with the last figure unreadable on the slide. No hive count, price per hive or sources are shown.
What a founder can adapt: "[N] managed hives ([source]) × $[price per hive] = $[X]."
Supporting analysis
What the deck claims: "The bee industry: Large market without safe disease prevention." "Global apiculture markets = $10 billion." "1/3 of the food we eat." "Pollination contribution to U.S. & EU crop market >$" (the figure is cut off at the edge of the photo on the slide). "20-40% in annual capacity losses from disease."
Presentation choice: Shows why the problem matters; doesn't size what beekeepers would pay.
When it does not fit: Letting a photo cover a key figure.
Precision farming tools for smallholders, Nigeria.
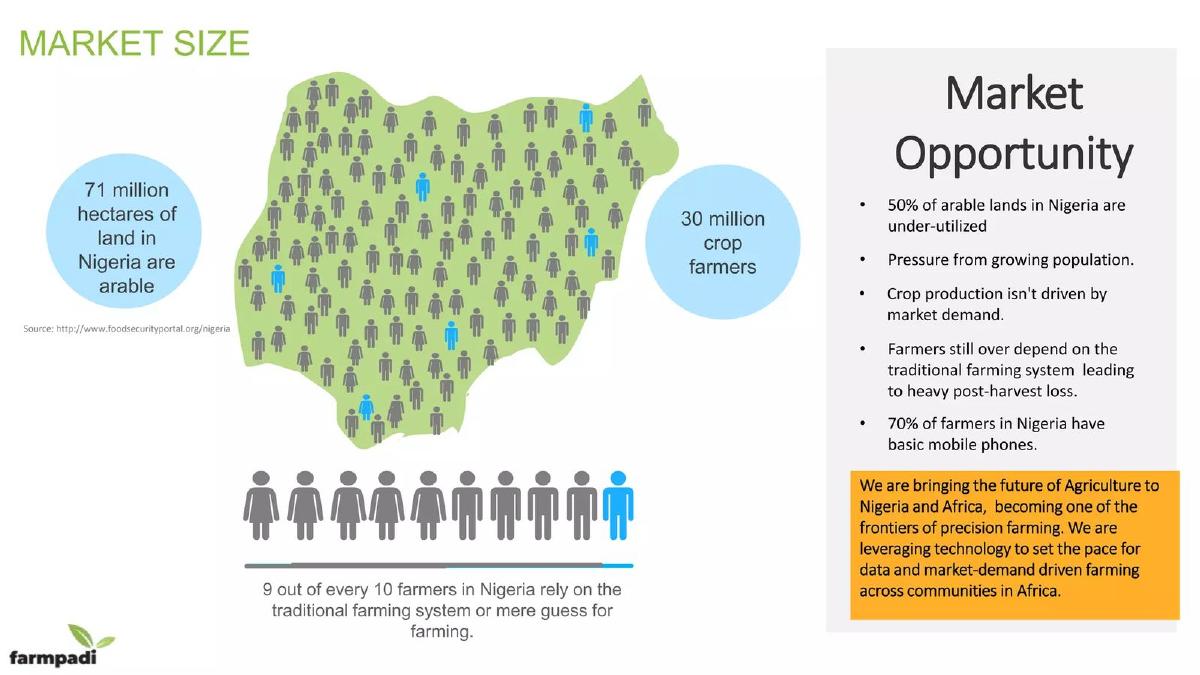
Farmpadi deck, slide 6. Exact stored slide matched to this analysis.
Our analysis: Country counts without a price.
Evidence and limitation: Weaker example. It names the country and gives land and farmer counts with a source link, and says 70% have basic phones (our calculation: about 21 million). It has no price and no dollar market size.
What a founder can adapt: "[N] farmers with phones in [country] × $[price] = $[X]."
Supporting analysis
What the deck claims: "Market Size." "71 million hectares of land in Nigeria are arable." "30 million crop farmers." "9 out of every 10 farmers in Nigeria rely on the traditional farming system or mere guess for farming." "Market Opportunity: 50% of arable lands in Nigeria are under-utilized. Pressure from growing population. Crop production isn't driven by market demand. Farmers still over depend on the traditional farming system leading to heavy post-harvest loss. 70% of farmers in Nigeria have basic mobile phones."
Presentation choice: The counts are a good base; the sum is missing.
Which kind of agtech market slide answers which question.
Approach
Example
Answers
Leaves open
Acres × price per acre
Blue White Robotics
Size
Source, first region
First market + wider base + range
Pollitrace
Where to start
Dollar basis
Nested markets + share
iFarm
Target in its market
How to reach it
Counts added, no price
EZ Farming
Scale
Price, units
Sector total + problem
Dalan
Why it matters
Hives, price
Country counts only
Farmpadi
Base
Dollar size
Key Takeaways
Count acres, farms or farmers, with a source.
Multiply by yearly revenue per acre or farmer.
Name the crops and countries you start in.
Don't add farmers and farms together.
Tie any share target to a named market.
Write your agtech market slide
Answer these before you design the slide.
Unit. Do you charge per acre, farm, farmer, hive or tonne?
Count. How many of that unit, for which crops, from what source?
Price. What does each pay you a year?
Start. Which country and crop come first?
Share. How many customers do you aim for, and by when?
Copyable framework: [N] [acres/farms] of [crop] in [region] ([source]) × $[price]/year = $[X]. First: [M] in [country] = $[Y].
Illustrative example 1 — written by us
Before: "150M Farmers + 50M Small Farms = $27B SAM."
After: "[N] small farms in [countries] ([source]) × $[price]/year = $[X]."
What improved: Our illustrative rewrite of EZ Farming's slide; bracketed text is a placeholder, not company fact.
What's different about agtech market sizing
Farm counts, crop areas and yields are published by national statistics agencies and the FAO, so the count side is checkable. The price side depends on the model: per acre for equipment and software, per farmer for apps and inputs, per tonne for marketplaces. Many farmers are smallholders who pay little, so a large farmer count can mean a small market.
What investors check
Whether the unit (acre, farm, farmer) matches how the company charges. Whether the price per unit is realistic for the farm size. Whether the crops and countries are named. Whether the figures add up.
How we read each slide
We quote the text on the slide images and mark our own arithmetic as ours. We have not checked any market figure or source. Page numbers are pages in the original deck file. All six images were already stored and were checked pixel-for-pixel against fresh renders of the decks.
Common mistakes
Mixing units. Farmers and farms aren't the same count.
Crop losses as your market. Size what farmers would pay you.
No price. A count needs a price to become a market.
Share with no plan. Tie it to a customer count.
Diagnostic checklist
One unit, matching how you charge.
Sourced count for named crops or regions.
Yearly price per unit.
First country and crop.
Customer-count target.
Frequently asked questions
How should an agtech startup size its market?
Multiply the acres or farmers you can serve by what each pays you a year, and name where you start. Blue White Robotics: 30M acres × $500 = $15B.
Can I use crop losses as my market size?
As evidence of the problem. Your market is what farmers would pay to reduce those losses.
How we chose these examples
Corpus: published pitch deck teardowns on StartupFundraising.com. Founder-uploaded private decks are excluded.
Selection (2026-09-26): we searched teardown slide text for farming and agriculture terms together with market-size wording, reviewed seven slides from the deck files and kept six.
Excluded: Crowdbotics p4 (software for many industries; crop disease is one client build), EZFarming (duplicate deck of EZ Farming), problem slides without market figures. Slides already used in other guides were not reused.
Page numbers are pages in the original deck files. All six images were already stored and were checked pixel-for-pixel against fresh renders on 2026-09-26.
Market figures and sources are quoted from the slides and not independently verified. Calculations (products, ratios, shares) are ours and marked as such.
Review: slide images were checked on 2026-09-26 and matched to company, deck and page (editorial model review). No person has yet completed an editorial review of this page. We make no claim that any slide caused a fundraising outcome.