Currency and Units on Pitch Deck Financials: How to Label
Euro charts with a dollar headline, a raise in one currency and revenue in another, units tucked in a corner.
Currency and Units on Financial Slides: Label Every Number So It Cannot Be Misread
A number on a pitch deck is only as clear as its label. "20m" could be euros or dollars, revenue or recurring revenue, a year or a month. Founders outside the US, and founders raising from investors in another country, meet this problem first: their accounts are in one currency, their investors think in another, and the deck often mixes both. This guide uses four real financial slides to show how to label currency, scale and measure, when to convert, and what goes wrong when the label and the headline disagree.
TL;DR
Put the currency, the scale and the measure on every financial chart, and use the same currency in the headline as in the chart. Clockwork does this well: "Monthly gross revenues in USD '000" tells you the currency, the unit, the period and that the figures are gross. Everphone shows the risk: its chart is labelled "in EUR millions" but its headline says "1B" with no currency and a callout says "$1B". Show your figures in the currency your accounts use, and if investors use another currency, add a converted figure with the exchange rate and date. Never mix currencies in one sentence without converting.
Four financial slides and how they label currency and units, read in full
Each slide was rendered from the original deck at full size and read in full, including axis labels. Headline figures were checked against chart values where both appear; no figure was checked against company accounts.
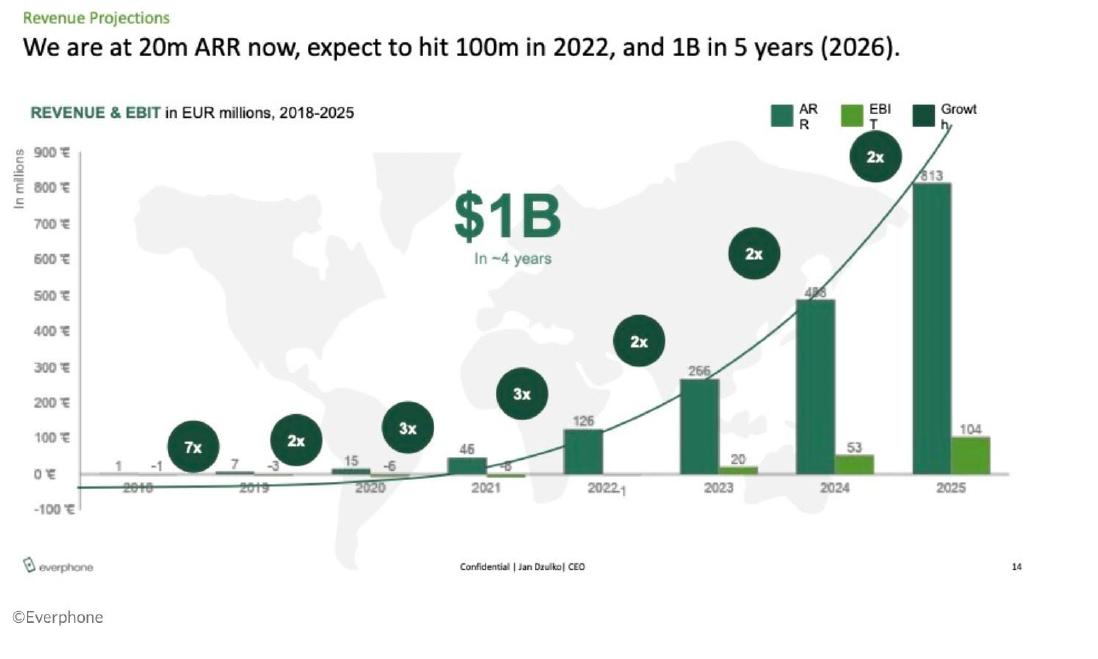
Everphone financials slide — slide 14
Company phones as a subscription. June 2021 deck; revenue projections slide.
Everphone deck, slide 14. Exact stored slide matched to this analysis.
Our analysis: Mismatched currency between headline, chart and callout.
Evidence and limitation: Headline has no currency, chart is in euros, callout is in dollars; the billion is beyond the chart's last year.
What a founder can adapt: Use euros throughout and either extend the chart to 2026 or say 2026 is beyond it.
Supporting analysis
What the deck claims: "We are at 20m ARR now, expect to hit 100m in 2022, and 1B in 5 years (2026)."; chart "REVENUE & EBIT in EUR millions, 2018-2025" with euro axis; callout "$1B In ~4 years"; 2025 bar 813.
Presentation choice: Shows how a headline and callout can contradict a correct axis label.
When it does not fit: A dollar callout on a euro chart.
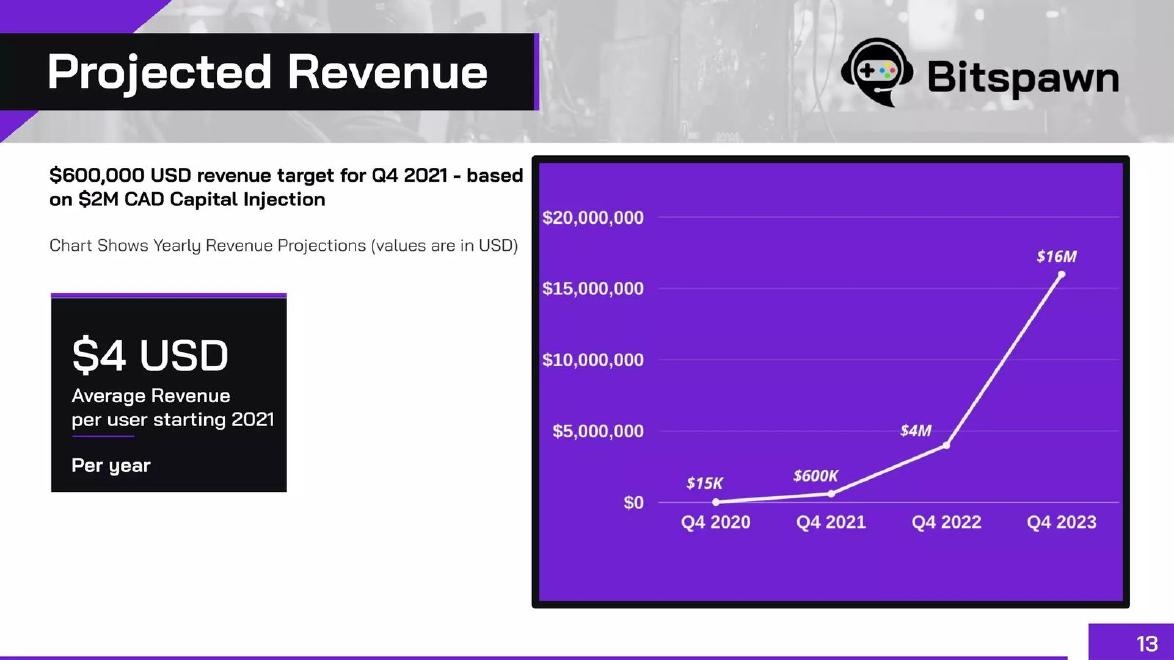
Bitspawn deck, slide 13. Exact stored slide matched to this analysis.
Our analysis: Clear labels, mixed currencies in one causal sentence.
Evidence and limitation: Every figure names its currency, but a USD target is tied to a CAD raise with no rate; quarter labels on yearly projections.
What a founder can adapt: Convert the raise into USD with the rate and date, and label points by year or by quarter.
Supporting analysis
What the deck claims: "$600,000 USD revenue target for Q4 2021 - based on $2M CAD Capital Injection"; "values are in USD"; "$4 USD Average Revenue per user starting 2021 Per year"; points $15K, $600K, $4M, $16M at Q4 2020-2023.
Presentation choice: Shows why the raise and the revenue need one currency or a stated rate.
When it does not fit: Two currencies sharing the "$" sign in one sentence.
Gig staffing. Series A deck; growth slide (printed page 7).
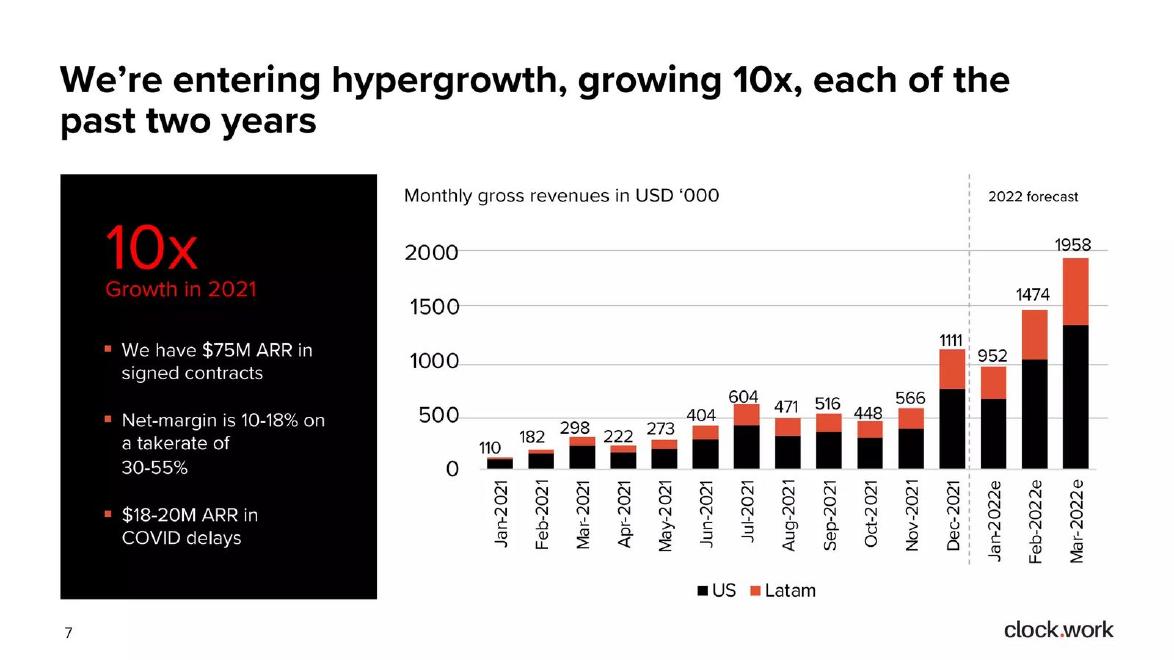
Clockwork deck, slide 8. Exact stored slide matched to this analysis.
Our analysis: Complete chart label; side-panel measures need their own definitions.
Evidence and limitation: Label gives currency, scale, period and measure; forecast marked; 10x checks (1111 / 110 ≈ 10.1). No note on Latam conversion; ARR differs from chart measure.
What a founder can adapt: Add a footnote on how Latam revenue was converted and define contracted ARR.
Supporting analysis
What the deck claims: "Monthly gross revenues in USD '000"; 110 (Jan-2021) to 1111 (Dec-2021), US and Latam; "Jan-2022e" to "Mar-2022e" under "2022 forecast"; "10x Growth in 2021"; "$75M ARR in signed contracts".
Presentation choice: Shows what a full label looks like.
When it does not fit: Placing contracted ARR beside billed revenue without saying they differ.
Whether the label is complete, whether the headline agrees with the chart, and whether conversions are explained.
Example
Currency stated
Scale and measure
Headline agrees
Main gap
Everphone
Chart only (EUR)
Millions; revenue and EBIT
No ($ callout, no currency in headline)
Mixed currencies
Bitspawn
Yes (USD and CAD)
Partly; quarter vs year unclear
Yes
No exchange rate
Libgem
Corner note (INR)
Millions; sales and EBITDA
No headline figure
Label hidden, years undated
Clockwork
Yes (USD)
Thousands; monthly gross revenue
Yes (10x checks)
No conversion note for Latam
Key Takeaways
Every chart needs currency, scale (thousands or millions) and measure (revenue, ARR, gross).
The headline must use the same currency as the chart beneath it.
Report in your accounting currency; add a converted figure for foreign investors.
State the exchange rate and the date you used.
Mark forecasts as forecasts on the chart itself.
Label every financial number
Check each financial slide against these prompts.
Currency. Is the currency written on every chart, as a code (USD, EUR, INR) where symbols could mean more than one?
Scale. Does each chart say thousands or millions?
Measure. Does the label say revenue, gross revenue, ARR or bookings, and the period?
Headline. Does the headline use the same currency and scale as the chart?
Conversion. If you converted, where are the rate and the date?
Copyable framework: "[Measure] in [currency] [scale], [period], [actual years] actual, [forecast years] forecast. Converted at [rate] on [date]."
Illustrative example 1 — written by us
Before: "We hit 20m and expect 1B by 2026." (chart in EUR millions, callout "$1B")
After: "ARR €20m today, forecast €1B in 2026 (about $1.1B at 1.10 USD/EUR, 1 June 2021). Chart: revenue in EUR millions, 2018-2020 actual, 2021-2026 forecast."
What improved: Our illustrative rewrite; the exchange rate shown is an example, not a sourced figure. Headline, chart and conversion now agree.
The question this guide answers
Founders often ask which currency to use in a pitch deck, and how to show figures when their company earns in one currency and raises in another. Our financials guides cover what to include in projections, how to show run rate and how to source a metric. None answers this narrower decision: how to label currency, scale and measure on each number, when to convert, and how to keep the headline and the chart in agreement.
The decision matters because an investor reads the headline first and the axis label last, if at all. When the two disagree, the investor either misreads the figure or notices the mismatch and starts to wonder what else is loose. A currency slip is rarely the reason an investor passes, but it is an easy reason to trust the numbers a little less.
How we chose and read the examples
We searched saved slide text in the teardown library for financial slides that name a currency, a scale such as thousands or millions, or an exchange rate. We left out presentations from listed companies, which follow reporting rules of their own, and decks where the labels were unreadable. We kept four slides from private companies that handle currency in four different ways: a chart and headline in conflicting currencies, two currencies in one sentence, a single local-currency label, and a full label with currency, unit, period and measure.
The examples are Everphone (company phones offered as a subscription, June 2021 deck), Bitspawn (esports platform), Libgem (online beverage retail; the deck is filed in our library under its "Beverages E-tailing" name) and Clockwork (staffing for gig workers, Series A deck). Each slide was rendered from the original deck at full size and read in full, including small axis labels. We checked that headline figures match the chart values where both appear. We did not check any figure against the companies' accounts.
Headline and chart in different currencies: Everphone
Everphone's slide 14 is titled "Revenue Projections". The headline reads: "We are at 20m ARR now, expect to hit 100m in 2022, and 1B in 5 years (2026)." The chart below is labelled "REVENUE & EBIT in EUR millions, 2018-2025", and its axis runs from "-100 €" to "900 €". A large callout in the middle of the chart reads "$1B In ~4 years". The company's earlier summary slide shows ARR as "€20m".
So the same slide uses no currency in the headline, euros on the axis and dollars in the callout. A reader who notices will ask whether "1B" means one billion euros or one billion dollars; at most exchange rates those differ by a meaningful amount. There is a second mismatch: the chart stops at 2025, where the tallest bar reads 813, while the headline promises 1B in 2026 and the callout says "in ~4 years". The billion is never shown on the chart that is meant to support it.
The fix is simple. Write "€20m ARR now, €100m in 2022, €1B in 2026" in the headline, change the callout to the euro figure, and either extend the chart to 2026 or say in the headline that 2026 is beyond the chart. If the euro symbol might confuse a US investor, add one converted figure in brackets with the rate used.
Two currencies in one sentence: Bitspawn
Bitspawn's slide 13, "Projected Revenue", opens with: "$600,000 USD revenue target for Q4 2021 - based on $2M CAD Capital Injection". Under it: "Chart Shows Yearly Revenue Projections (values are in USD)". A box reads "$4 USD Average Revenue per user starting 2021 Per year". The chart plots $15K, $600K, $4M and $16M at Q4 2020, Q4 2021, Q4 2022 and Q4 2023.
Bitspawn deserves credit: every dollar figure carries its currency, and the chart says plainly that it is in US dollars. That is better than most decks. The problem is the opening sentence, which ties a US-dollar revenue target to a Canadian-dollar raise. Both use the "$" sign, and the investor has to convert in their head to judge how much revenue each dollar raised is meant to produce. The slide gives no exchange rate.
There is also a smaller labelling question. The chart is described as yearly projections, but the points are labelled with a quarter ("Q4 2021"). A reader cannot tell whether $600K is the revenue for the fourth quarter or for the year ending then. The fix is to state the raise in the same currency as the revenue, with the rate ("$2M CAD, about $1.6M USD at the rate on [date]"), and to label each point either by quarter or by year, not both.
A single local-currency label: Libgem
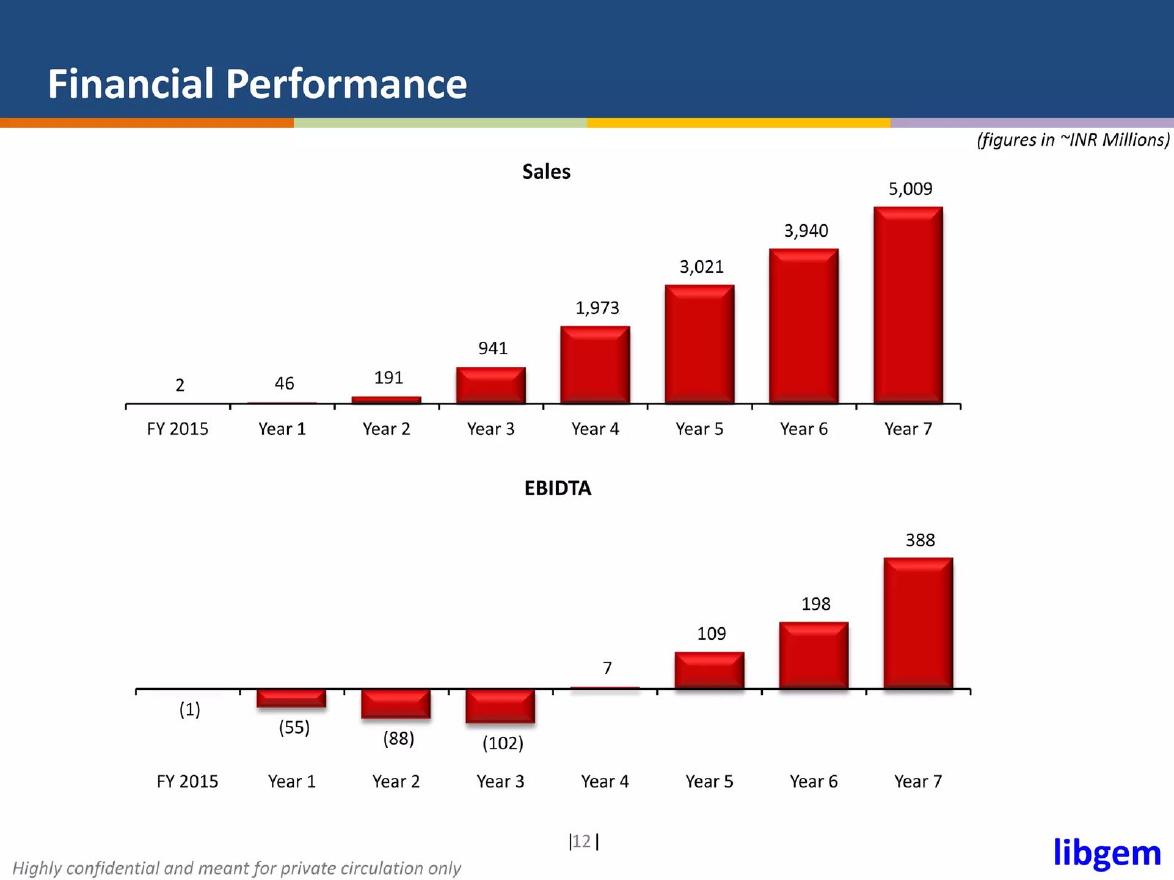
Libgem's slide 12, "Financial Performance", shows two bar charts: Sales from 2 in FY 2015 rising to 5,009 in Year 7, and EBIDTA from (1) through a low of (102) in Year 3 to 388 in Year 7. The only unit on the slide is a small italic note in the top right corner: "(figures in ~INR Millions)".
The slide does several things right. It names the currency the business actually earns in, rather than converting into dollars and hiding the exchange rate in the forecast. It shows losses in brackets, which is standard. And it uses one unit for both charts, so the two can be read together.
Three things weaken it. The unit sits in a corner, away from both charts, so a reader skimming the bars sees "5,009" with no currency. The tilde in "~INR" is not explained; it presumably means the figures are rounded or approximate, but the slide does not say. And the deck gives no US-dollar equivalent anywhere on this slide, which matters if the deck is shown to investors outside India. Note also that "FY 2015" is a real year while "Year 1" to "Year 7" are not dated, so the reader cannot tell when the forecast begins. The fix is to put "INR millions" on each chart title, add a single line such as "Year 7 sales of INR 5,009M are about $[X]M at [rate] on [date]", and date the forecast years.
A complete label: Clockwork
Clockwork's slide headed "We're entering hypergrowth, growing 10x, each of the past two years" shows a stacked bar chart labelled "Monthly gross revenues in USD '000". Bars run from 110 in Jan-2021 to 1111 in Dec-2021, split into US and Latam. A dashed line separates three further bars marked "Jan-2022e", "Feb-2022e" and "Mar-2022e" under the heading "2022 forecast". A side panel says "10x Growth in 2021", "We have $75M ARR in signed contracts", "Net-margin is 10-18% on a takerate of 30-55%" and "$18-20M ARR in COVID delays".
This is the strongest label of the four. In five words it gives the currency (USD), the scale ('000), the period (monthly) and the measure (gross revenues). Forecast months are marked twice, with an "e" and with a dashed line. The "10x" claim checks against the chart: 1111 in December divided by 110 in January is about 10.1.
Two gaps remain, and both are about measures rather than currency. First, the chart shows gross revenue while the side panel talks about net margin and ARR from signed contracts, which are different measures. A reader could easily set "$75M ARR" against monthly revenue of about $1.1M and be confused; the panel should say that ARR here means contracted, not yet billed. Second, part of the revenue comes from Latin America. The slide does not say whether that revenue was earned in dollars or converted, or at what rate. For a company with revenue in several currencies, one footnote ("Latam revenue converted at monthly average rates") answers the question before it is asked.
Which currency should you use?
Use the currency your accounts are kept in as the main figure. That is the number that will appear in your financial statements and in due diligence, and every converted number in the deck should be traceable back to it. Converting everything into dollars when your business earns in euros or rupees means your deck figures will not match your accounts, and an investor checking them later will have to work out why.
Add a converted figure when your investors think in another currency. You do not need to convert every number; converting the two or three figures that matter most (current revenue, the forecast headline and the raise) is usually enough. Write the rate and the date next to the conversion, or once in a footnote that applies to the whole deck. If your forecast assumes a rate, say which one, because a currency move can change a forecast as much as sales can.
Raise in one currency and spend in another? Show the raise in the currency investors will wire, and the use of funds in the currency you will spend, with the rate between them. Bitspawn's slide shows why: without the rate, the reader cannot judge the revenue target against the capital.
What a full label contains
A complete label answers four questions: which currency, what scale, what period and which measure. "Monthly gross revenues in USD '000" answers all four. "Revenue (EUR m, annual, audited 2023, forecast 2024-26)" answers all four and adds which years are actual. A label that answers fewer than four leaves the reader to guess.
Put the label in the chart title or directly on the axis, not in a corner note. Use the same label wording on every financial slide, so that a reader moving from the traction slide to the forecast does not wonder whether the unit has changed. If you use a symbol such as "$", make sure it cannot mean two currencies: Canadian, Australian and US dollars all use it, so write "USD" or "CAD" at least once on each slide.
The headline is part of the label. A headline written in words ("We are at 20m ARR") should use the same currency and scale as the chart beneath it. Read your headline out loud with the currency included; if it sounds wrong, the chart probably disagrees with it.
What these examples can and cannot show
These four slides show common ways currency and unit labels go right and wrong. They do not show how investors reacted to any of them, and we have no evidence that a labelling slip affected any of these companies' fundraising. We also cannot tell, from the slides alone, which currency each company's accounts were kept in, so where we say a company earns in a given currency we are reading the slide, not its accounts.
The lesson is about clarity, not about which currency is best. A deck in euros, rupees or Canadian dollars can be perfectly clear; a deck in US dollars can be confusing. What matters is that every number carries its label, that labels agree across the slide and the deck, and that conversions show their rate and date.
Common mistakes
Headline in another currency. Match the headline to the chart.
Ambiguous "$". Write USD, CAD or AUD at least once per slide.
Hidden unit note. Put currency and scale in the chart title or axis.
Conversion without a rate. Give the rate and date next to any converted figure.
Mixed measures side by side. Define ARR, gross and net when they sit together.
Diagnostic checklist
Currency on every chart.
Scale and measure on every chart.
Headline matches chart currency.
Conversions show rate and date.
Forecasts marked on the chart.
Frequently asked questions
Should a non-US startup show its pitch deck in US dollars?
Show your accounting currency as the main figure and add US-dollar equivalents for the key numbers, with the rate and date.
Which exchange rate should I use?
Use one stated rate, such as the rate on a named date or an average for the period, and use it consistently.
Is the "$" sign enough?
Not if your audience might read it as another dollar. Write the currency code at least once on each slide.
Do I need to label thousands and millions on every chart?
Yes. A bar reading 1,111 means nothing until the reader knows whether it is thousands or millions.
How we chose these examples
Corpus: published pitch deck teardowns on StartupFundraising.com. Founder-uploaded private decks are excluded.
Selection (2026-10-01): we searched extracted slide text for financial slides naming a currency, scale or exchange rate, excluded listed-company presentations and unreadable slides, and kept four private-company slides handling currency in four different ways.
Review: the four slides were rendered from the source decks at full size on 2026-10-01 and read in full against company, deck and page number; headline figures were checked against chart values where both appear (editorial model review, with AI assistance in drafting). No figure was checked against company accounts. No person has yet completed a human editorial review of this draft.