How fintech startups plan to reach customers: bank and software partnerships, embedded distribution, brokers and super-app partners.
Fintech Go-to-Market Slide: Partnerships, Embedded Distribution and Acquisition Cost
Winning customers one by one is expensive in financial services, so many fintechs reach them through someone else: a bank, an accounting or payroll tool, a brokerage, or a super-app. This guide compares seven real fintech go-to-market slides, from a phased plan that opens with its acquisition-cost problem to a slide that shows four partner logos and nothing else.
TL;DR
Name the partner or channel, say why the partner benefits, and show what it does to acquisition cost. Cent Capital states the problem ($1,450 average acquisition cost, 37% retention) and then a three-phase partner plan. Numeral gives each channel a rationale and a partner benefit. Partner logos without the terms or the partner's reason to promote you leave investors guessing.
Fintech go-to-market slides from real pitch decks
Each example shows the slide above its analysis and links to the full teardown. Slides that explain the channel and the partner's incentive come first. Claims are as shown on the slides; comments are ours.
Cent Capital go to market slide — slide 7
AI personal finance co-pilot for consumers.
Cent Capital deck, slide 7. Exact stored slide matched to this analysis.
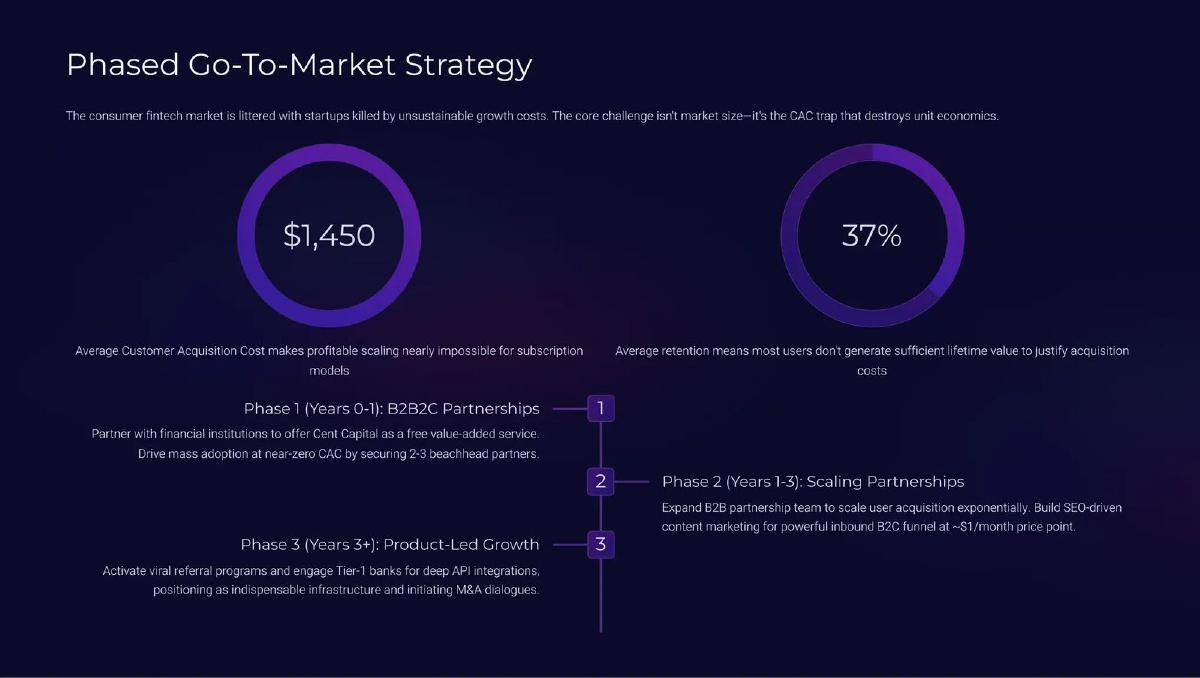
Our analysis: Problem first, then a partner plan.
Evidence and limitation: It names the industry problem, then shows how each phase avoids it. The $1,450 and 37% figures have no source on the slide, and "near-zero CAC" assumes partners that aren't yet signed.
What a founder can adapt: "Industry CAC $[X] ([source]); via [partner type] ours is $[Y]; [N] partners signed."
Supporting analysis
What the deck claims: "Phased Go-To-Market Strategy." "The core challenge isn't market size—it's the CAC trap that destroys unit economics." "$1,450 Average Customer Acquisition Cost makes profitable scaling nearly impossible for subscription models." "37% Average retention." "Phase 1 (Years 0-1): B2B2C Partnerships — Partner with financial institutions to offer Cent Capital as a free value-added service. Drive mass adoption at near-zero CAC by securing 2-3 beachhead partners." "Phase 2 (Years 1-3): Scaling Partnerships" with SEO-driven content "at ~$1/month price point." "Phase 3 (Years 3+): Product-Led Growth."
Presentation choice: Investors see the plan is designed around acquisition cost.
When it does not fit: Industry figures without a source.
Payment automation software for fintechs and businesses in Europe.
Numeral deck, slide 13. Exact stored slide matched to this analysis.
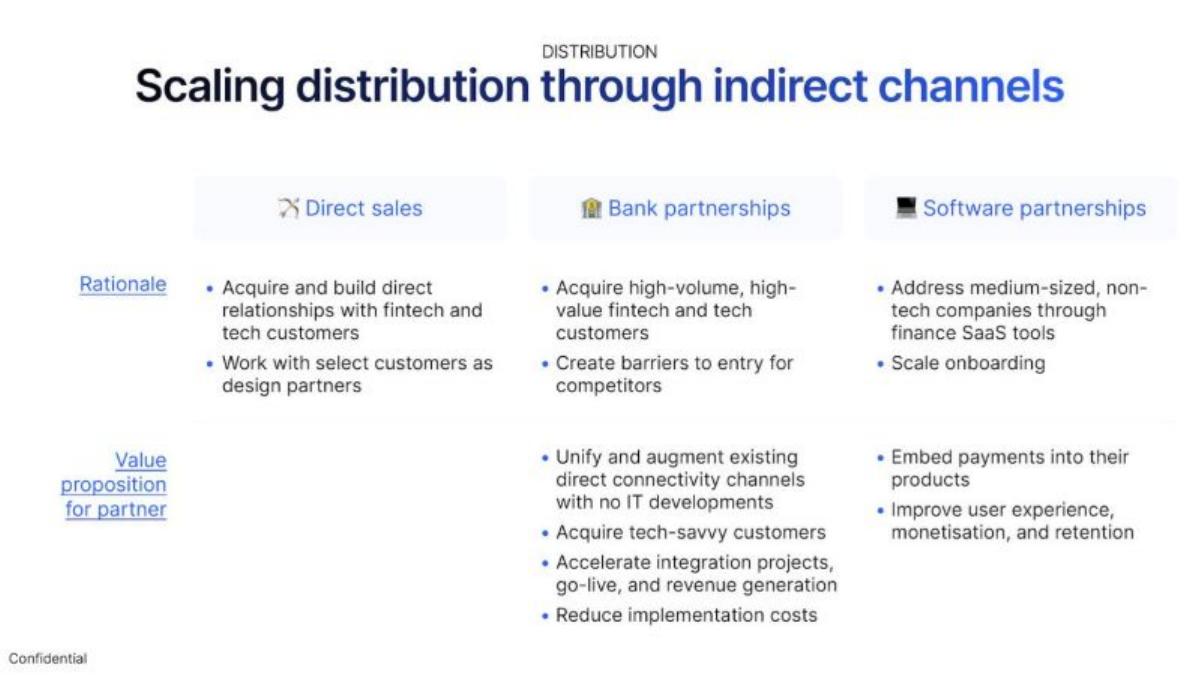
Our analysis: Channels with partner incentives.
Evidence and limitation: Each channel gets a target customer, a reason and, for partners, what the partner gains. It doesn't name any partner or say which channels are live.
What a founder can adapt: "[Channel]: reaches [segment]; partner gains [benefit]; live with [N] partners."
Supporting analysis
What the deck claims: "Scaling distribution through indirect channels." Three columns. "Direct sales — Acquire and build direct relationships with fintech and tech customers; Work with select customers as design partners." "Bank partnerships — Acquire high-volume, high-value fintech and tech customers; Create barriers to entry for competitors," with a value proposition for the bank: "Unify and augment existing direct connectivity channels with no IT developments … Reduce implementation costs." "Software partnerships — Address medium-sized, non-tech companies through finance SaaS tools," value for partner: "Embed payments into their products; Improve user experience, monetisation, and retention."
Presentation choice: Answers the question investors ask about partnerships: why would they promote you?
When it does not fit: Partner channels without the partner's reason to join.
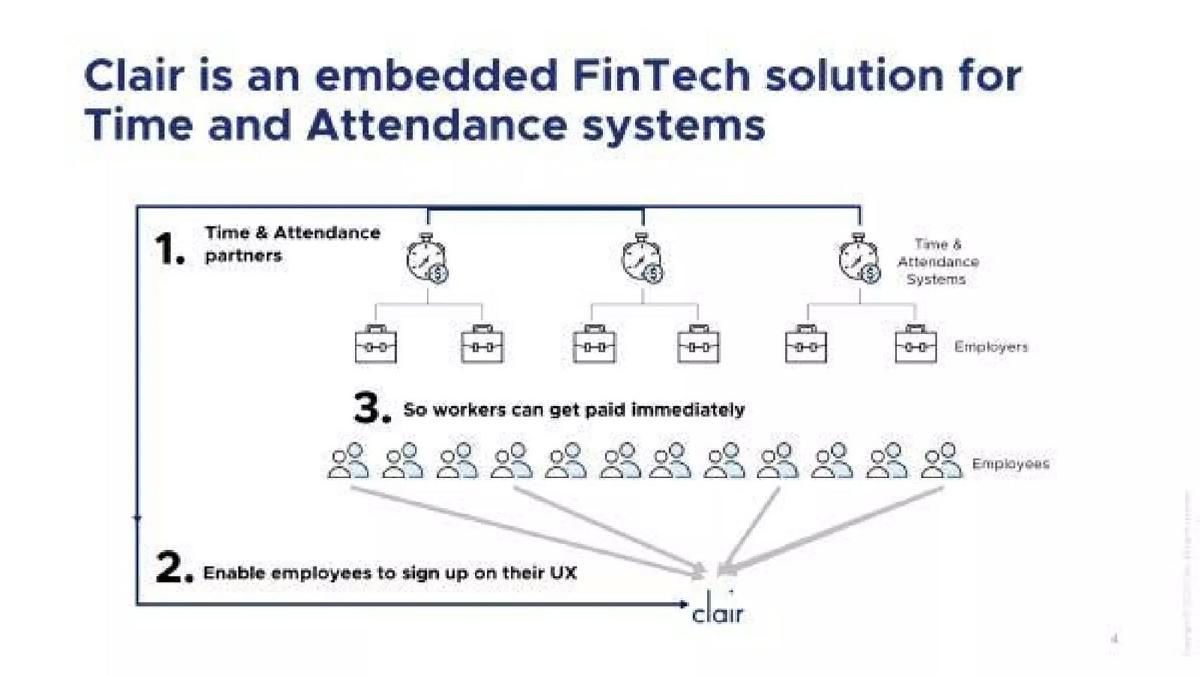
Evidence and limitation: It shows one partner reaching many employers and their employees, which is why embedded distribution can lower acquisition cost. The slide doesn't name partners or give sign-up rates; the deck covers partners and incentives on its next slide.
What a founder can adapt: "[N] [platform] partners → [M] employers → [K] eligible workers; [X]% sign up."
Supporting analysis
What the deck claims: "Clair is an embedded FinTech solution for Time and Attendance systems." "1. Time & Attendance partners" (each serving several employers). "2. Enable employees to sign up on their UX." "3. So workers can get paid immediately."
Presentation choice: Investors can see the multiplier: one partner, many employers, many workers.
When it does not fit: A distribution diagram without any numbers.
Embedded working-capital loans for small businesses.
Defacto deck, slide 9. Exact stored slide matched to this analysis.
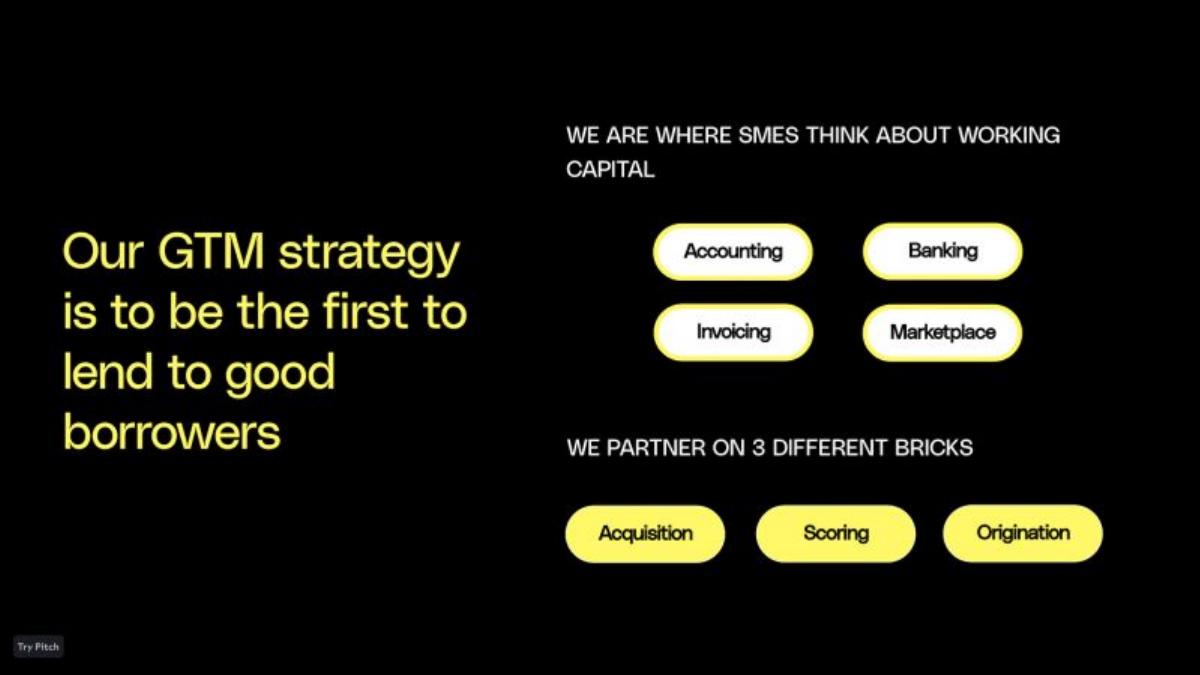
Our analysis: Where the product appears, no numbers.
Evidence and limitation: It names where the loan offer appears and what partners contribute. It gives no partner names, volumes or cost figures.
What a founder can adapt: "Embedded in [N] [accounting/invoicing] platforms; [X] SMEs reached; [Y]% take a loan."
Supporting analysis
What the deck claims: "Our GTM strategy is to be the first to lend to good borrowers." "We are where SMEs think about working capital: Accounting, Banking, Invoicing, Marketplace." "We partner on 3 different bricks: Acquisition, Scoring, Origination."
Presentation choice: Clear channel logic, but investors can't size it.
When it does not fit: Channel types with no named partner.
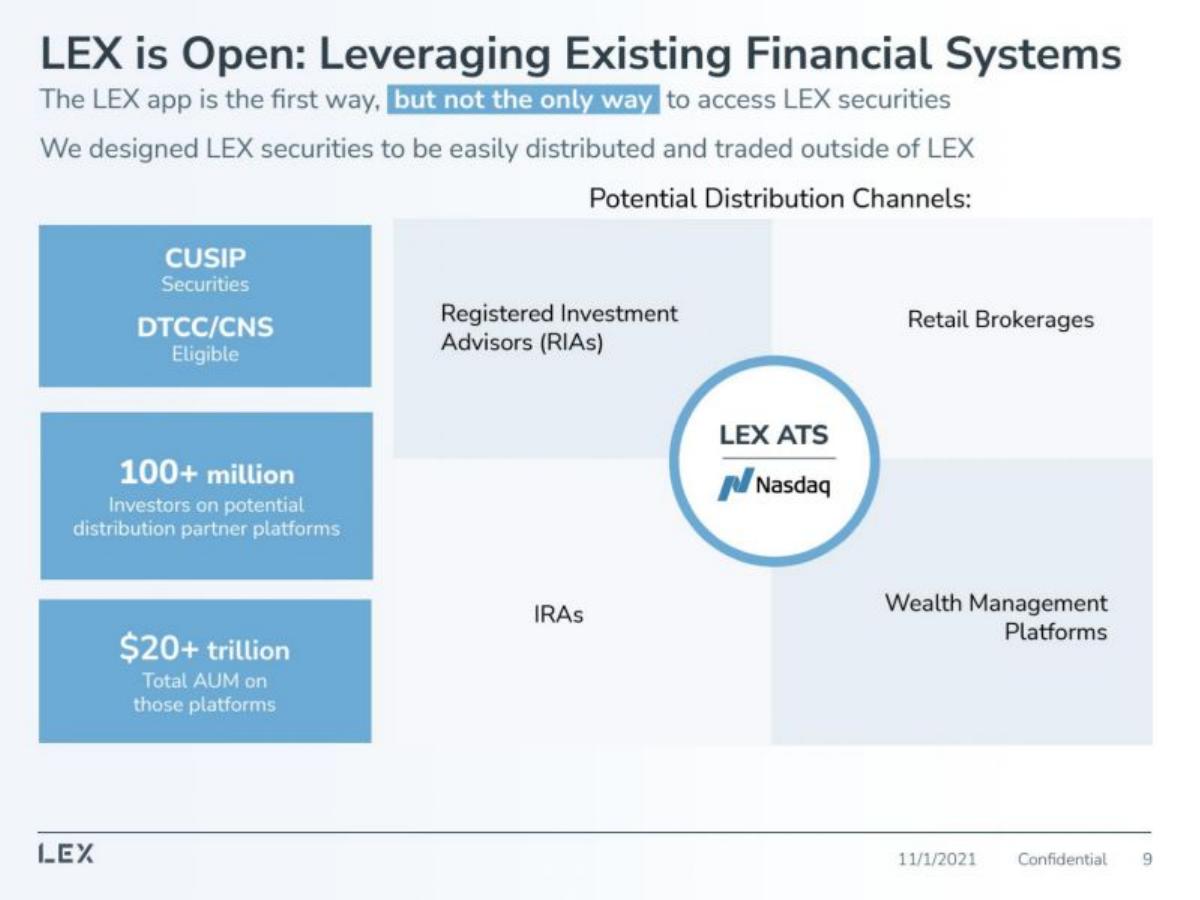
Platform for investing in shares of individual commercial buildings.
LEX deck, slide 9. Exact stored slide matched to this analysis.
Our analysis: Distribution enabled, not yet signed.
Evidence and limitation: It explains why other platforms can carry its securities (standard settlement eligibility). The channels and reach figures are labelled "potential", so none are live on this slide.
What a founder can adapt: "Tradeable via [N] brokerages today; [M] in discussion."
Supporting analysis
What the deck claims: "LEX is Open: Leveraging Existing Financial Systems." "The LEX app is the first way, but not the only way to access LEX securities." "CUSIP Securities; DTCC/CNS Eligible." "100+ million Investors on potential distribution partner platforms." "$20+ trillion Total AUM on those platforms." "Potential Distribution Channels: Registered Investment Advisors (RIAs), Retail Brokerages, IRAs, Wealth Management Platforms."
Presentation choice: Honest labelling of potential channels, but reach isn't customers.
When it does not fit: Using partner platforms' total AUM as your reach.
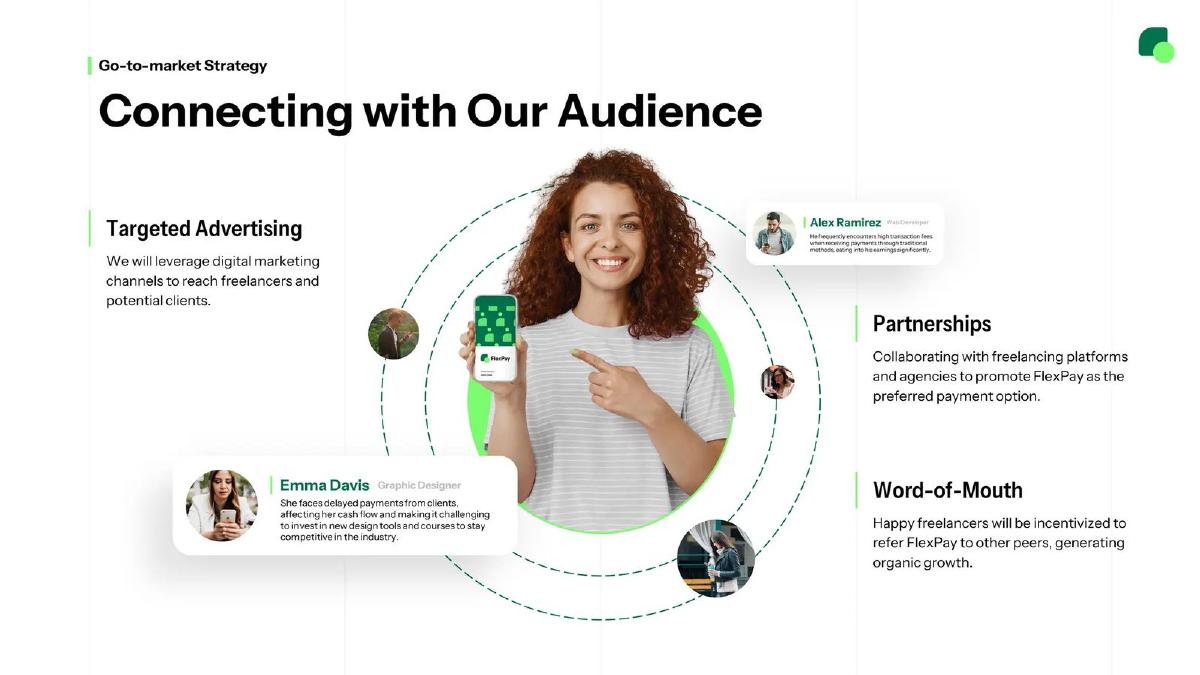
FlexPay deck, slide 9. Exact stored slide matched to this analysis.
Our analysis: Generic channels.
Evidence and limitation: Weaker example. It lists three standard channels with no cost, partner name or referral incentive.
What a founder can adapt: "Referral: $[X] credit per referral; [Y]% of sign-ups from referrals."
Supporting analysis
What the deck claims: "Go-to-market Strategy — Connecting with Our Audience." "Targeted Advertising — We will leverage digital marketing channels to reach freelancers and potential clients." "Partnerships — Collaborating with freelancing platforms and agencies to promote FlexPay as the preferred payment option." "Word-of-Mouth — Happy freelancers will be incentivized to refer FlexPay to other peers."
Presentation choice: The same three bullets could appear in almost any deck.
When it does not fit: Advertising, partnerships and word of mouth with no specifics.
Which kind of fintech go-to-market slide answers which question.
Approach
Example
Answers
Leaves open
Acquisition-cost problem, phased plan
Cent Capital
Why partners first
Sources; signed partners
Channels with partner incentives
Numeral
Why partners join
Named partners
Embedded diagram
Clair
One-to-many reach
Numbers
Where the product appears
Defacto
Placement and roles
Names and volumes
Potential channels
LEX
How distribution is possible
Live channels
Generic channels
FlexPay
Little
Costs and specifics
Logos only
Pluang
Who
What they deliver
Key Takeaways
Say who reaches the customer for you.
Explain what the partner gets.
Address acquisition cost directly.
Separate live partners from potential ones.
Logos alone aren't a channel.
Write your fintech go-to-market slide
Answer these before you design the slide.
Channel. Who reaches the customer for you: a bank, software, marketplace, app, or your own marketing?
Partner incentive. What does the partner gain: revenue share, retention, lower cost?
Status. Which partners are live, signed or only in discussion?
Cost. What does a customer cost through this channel, and how do you know?
Copyable framework: We reach [customer] through [partner type]; partners gain [benefit]. Live: [names]; in discussion: [N]. Acquisition cost [X] ([measured/planned]).
Illustrative example 1 — written by us
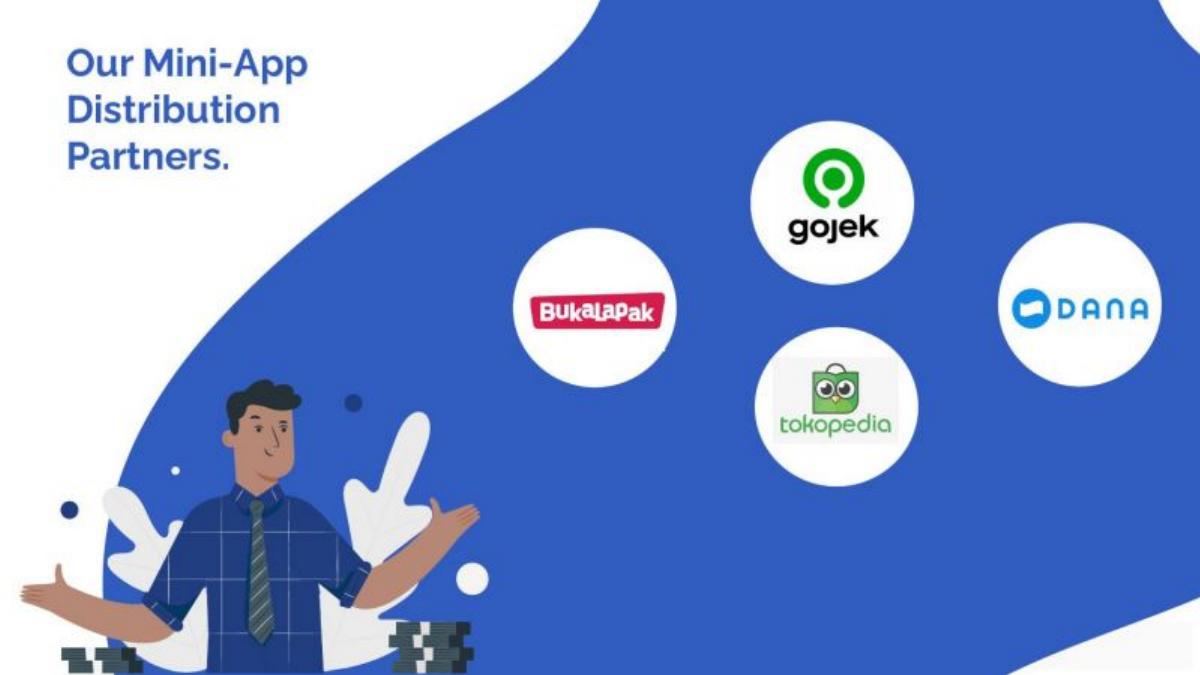
Before: "Our Mini-App Distribution Partners." [four logos]
After: "Mini-apps live in [partners]; [X]% of new accounts in [period]; [revenue share] terms."
What improved: Our illustrative rewrite of Pluang's slide; bracketed text is a placeholder, not company fact.
What's different about fintech go-to-market
Financial products need trust, and consumers rarely switch on impulse, so direct acquisition can cost more than a customer is worth. Fintechs often borrow distribution from companies that already hold the relationship: banks, accounting and payroll software, marketplaces, brokerages or super-apps. Investors then look at whether those partners have a reason to promote you and whether the deals are signed.
What investors check
Which channel reaches the first customers. Why each partner benefits. Whether partners are live, signed or only possible. What the plan does to acquisition cost and retention, and where those figures come from.
How we read each slide
We quote the text on the slide images. We have not checked any partner, cost or retention figure. Six pages were rendered from the original deck files in our library; Clair's page was already in our stored image set and was reused.
Common mistakes
Logos without results. Say what each partner delivers.
No partner incentive. Explain why partners promote you.
Potential shown as live. Label signed and potential partners.
Unsourced cost figures. Say where acquisition cost comes from.
Generic channels. Give one specific number per channel.
Diagnostic checklist
Channel named.
Partner incentive explained.
Live vs potential partners labelled.
Acquisition cost addressed.
Frequently asked questions
How should a fintech startup show its go-to-market on a pitch deck?
Name the channel, say why partners benefit and address acquisition cost. Numeral lists bank and software partnerships with what each partner gains; Cent Capital starts from a $1,450 average acquisition cost and plans partners to avoid it.
Are partner logos enough for a fintech distribution slide?
No. Pluang shows Gojek, Tokopedia, Bukalapak and DANA but not what they deliver. Add users or share of new accounts from each, and the terms.
How we chose these examples
Corpus: published pitch deck teardowns on StartupFundraising.com. Founder-uploaded private decks are excluded.
Selection (2026-09-26): we searched fintech teardowns for go-to-market, distribution and acquisition headings, rendered eleven candidate decks with neighbouring pages, and kept seven.
Excluded: Amplify (its distribution page shows a product stack, not channels), IRAengine (a product flow), OLB and Holdbar (no go-to-market content on the pages checked).
Clair's page was already in our stored image set and was reused. The other six were rendered from the original deck PDFs and stored with the existing slide-image workflow. All seven decks were confirmed as published teardowns on 2026-09-26.
Costs, retention, reach and partners are quoted from the slides and not independently verified.
Review: slide images were checked on 2026-09-26 and matched to company, deck and page (editorial model review). No person has yet completed an editorial review of this page. We make no claim that any slide caused a fundraising outcome.