Cannabis and Hemp Market Size Slides: 7 Real Examples
How cannabis, hemp and cannabinoid startups size their market: patients × spend, legal states and countries, category comparisons and drug indications.
Cannabis Market Slide: Legal Markets, Patients and What They Spend
A cannabis market depends on the law. What counts is the legal market in the places where you're licensed, now and after the next legal change. That puts a state, province or country on the slide, and usually a date. The seven slides below range from a sourced patient forecast to a single headline for a whole country.
TL;DR
Name the legal market you can sell into, count the patients or consumers there, and show what each spends, now and after the next legal change. Aphria is the clearest example: Health Canada's projection of 40,000 to 400,000 medical patients, and sales from $150 million to $1.4 billion. Flower One and Canndescent show a single state as the first market. Cansativa sizes Germany before legalisation.
Cannabis market slides from real pitch decks
Each example shows the slide above its analysis and links to the full teardown. The clearest sizing comes first. Claims are as shown on the slides; comments and calculations are ours.
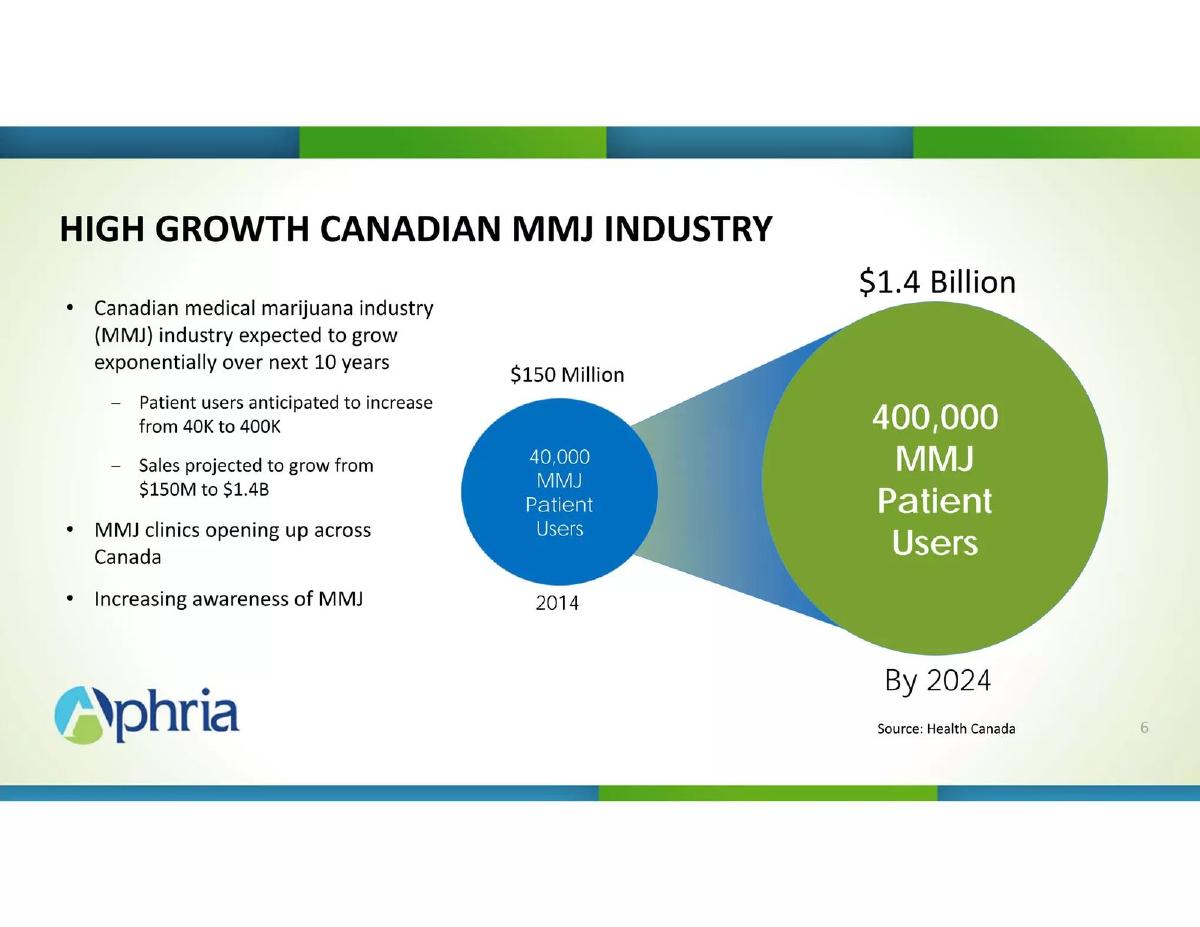
Aphria market slide — slide 6
Licensed medical cannabis producer, Canada.
Aphria deck, slide 6. Exact stored slide matched to this analysis.
Our analysis: Patients × spend, from a regulator, at two dates.
Evidence and limitation: A named country, a regulator source, patient counts and sales at two dates. Our calculations: $150M ÷ 40,000 = $3,750 per patient in 2014, and $1.4B ÷ 400,000 = $3,500 per patient in 2024, so the forecast assumes spend per patient stays roughly flat. The slide doesn't show Aphria's share.
What a founder can adapt: "[N] registered patients in [jurisdiction] ([regulator], [year]) × $[spend] = $[X]; [M] by [year] = $[Y]."
Supporting analysis
What the deck claims: "High Growth Canadian MMJ Industry." "Canadian medical marijuana industry (MMJ) industry expected to grow exponentially over next 10 years. Patient users anticipated to increase from 40K to 400K. Sales projected to grow from $150M to $1.4B." "MMJ clinics opening up across Canada." "Increasing awareness of MMJ." Chart: "40,000 MMJ Patient Users, 2014, $150 Million" to "400,000 MMJ Patient Users, By 2024, $1.4 Billion." "Source: Health Canada."
Presentation choice: Investors can check both the count and the implied spend.
When it does not fit: A forecast without the per-patient spend it implies.
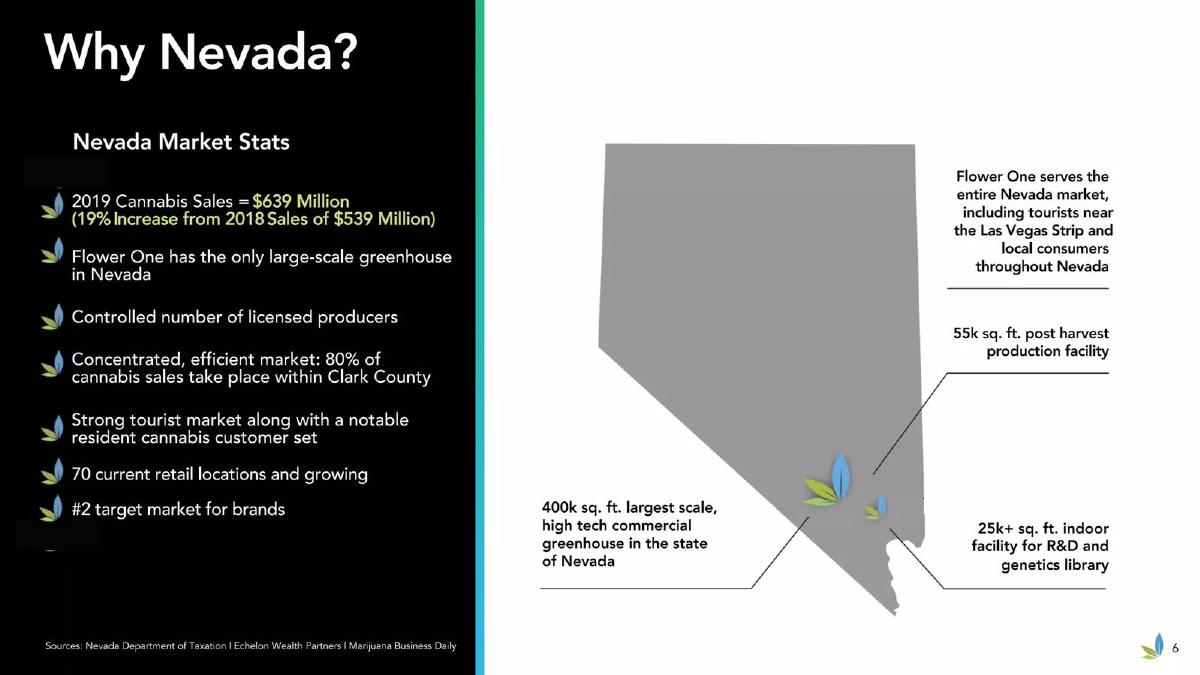
Flower One deck, slide 6. Exact stored slide matched to this analysis.
Our analysis: One state's actual sales, from the tax agency.
Evidence and limitation: One state, actual sales from the tax agency, growth, and where sales concentrate. Our checks: $639M ÷ $539M = 18.6% growth, rounded to 19%. 80% in Clark County is about $511M. The slide doesn't show Flower One's share of the $639M.
What a founder can adapt: "[State] sales $[X] in [year] ([tax agency]), up [%]; [county] is [%]; our share $[Y]."
Supporting analysis
What the deck claims: "Why Nevada?" "Nevada Market Stats: 2019 Cannabis Sales = $639 Million (19% Increase from 2018 Sales of $539 Million)." "Flower One has the only large-scale greenhouse in Nevada." "Controlled number of licensed producers." "Concentrated, efficient market: 80% of cannabis sales take place within Clark County." "Strong tourist market along with a notable resident cannabis customer set." "70 current retail locations and growing." "#2 target market for brands." Sources: "Nevada Department of Taxation | Echelon Wealth Partners | Marijuana Business Daily."
Presentation choice: Reported sales beat forecasts; the state is where the licence is.
When it does not fit: Using the national total when you can only sell in one state.
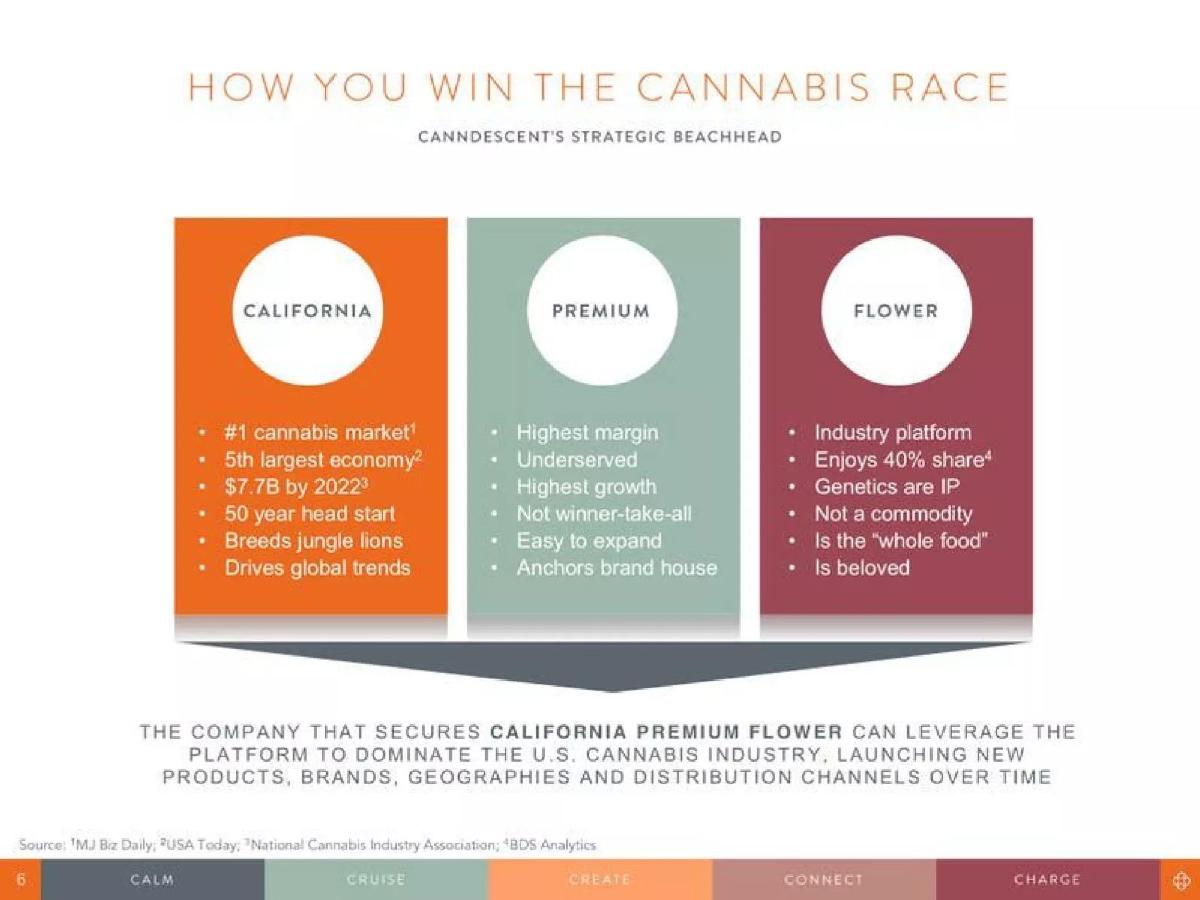
Canndescent deck, slide 6. Exact stored slide matched to this analysis.
Our analysis: State › segment › product, one figure sized.
Evidence and limitation: A state, a segment and a product with one sized figure ($7.7B) and flower's 40% share. Our calculation: 40% of $7.7B is about $3.1B for flower in California, if the share applies to that total. The premium share isn't sized.
What a founder can adapt: "[State] $[X] by [year] × flower [%] × premium [%] = $[Y]."
Supporting analysis
What the deck claims: "How you win the cannabis race. Canndescent's strategic beachhead." California: "#1 cannabis market. 5th largest economy. $7.7B by 2022. 50 year head start. Breeds jungle lions. Drives global trends." Premium: "Highest margin. Underserved. Highest growth. Not winner-take-all. Easy to expand. Anchors brand house." Flower: "Industry platform. Enjoys 40% share. Genetics are IP. Not a commodity. Is the 'whole food.' Is beloved." "The company that secures California premium flower can leverage the platform to dominate the U.S. cannabis industry." Sources: MJ Biz Daily, USA Today, National Cannabis Industry Association, BDS Analytics.
Presentation choice: The beachhead logic is clear; the premium slice isn't sized.
When it does not fit: Narrowing in words but not in numbers.
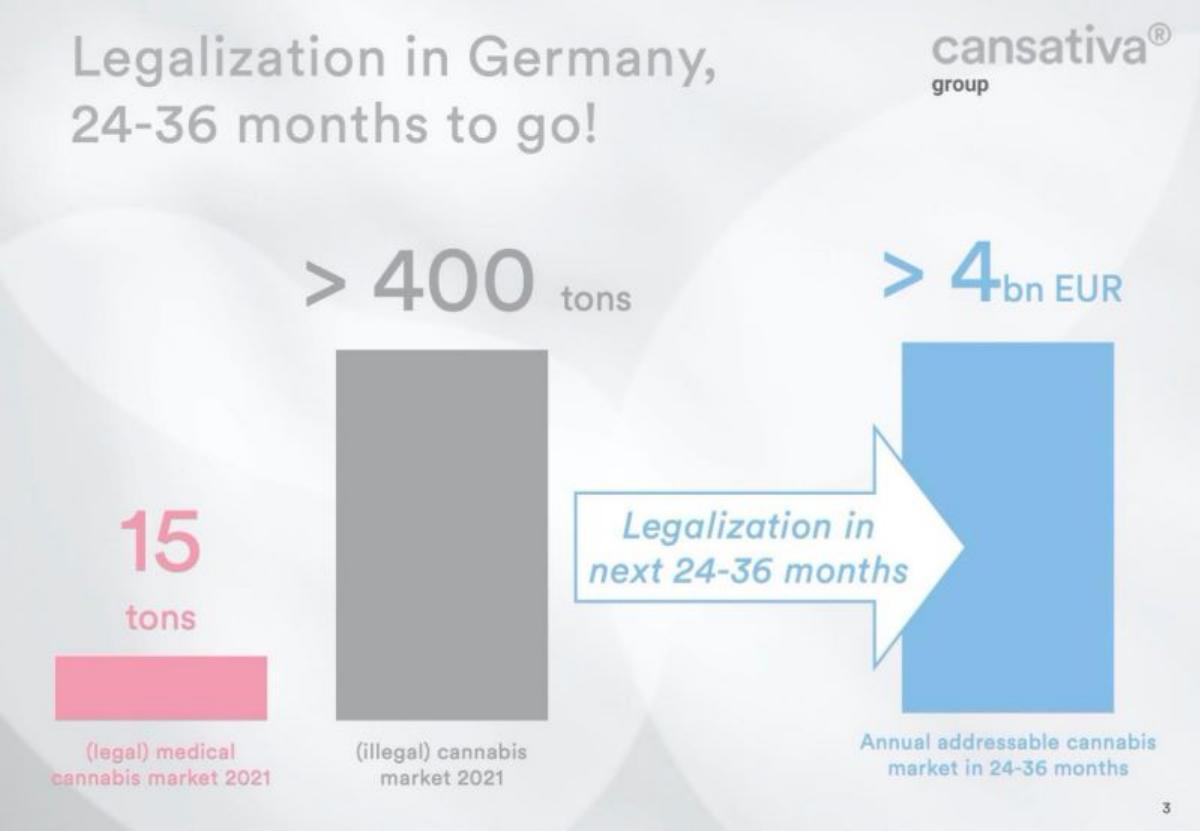
Cansativa deck, slide 3. Exact stored slide matched to this analysis.
Our analysis: Legal today vs. illegal volume, valued after a law change.
Evidence and limitation: Today's legal volume, the illegal volume and a post-legalisation value. Our calculation: €4bn ÷ 400 tons is €10 per gram. The slide labels the 400 tons illegal and doesn't say how much would move to the legal market, or give sources.
What a founder can adapt: "Legal [N] tons today; [M] tons illegal ([source]); after [law, date], [%] shifts × €[price]/g = €[X]."
Supporting analysis
What the deck claims: "Legalization in Germany, 24-36 months to go!" "15 tons: (legal) medical cannabis market 2021." "> 400 tons: (illegal) cannabis market 2021." "Legalization in next 24-36 months." "> 4bn EUR: Annual addressable cannabis market in 24-36 months."
Presentation choice: It shows the size of the change; it depends on the law passing.
When it does not fit: Treating the whole illegal market as addressable on day one.
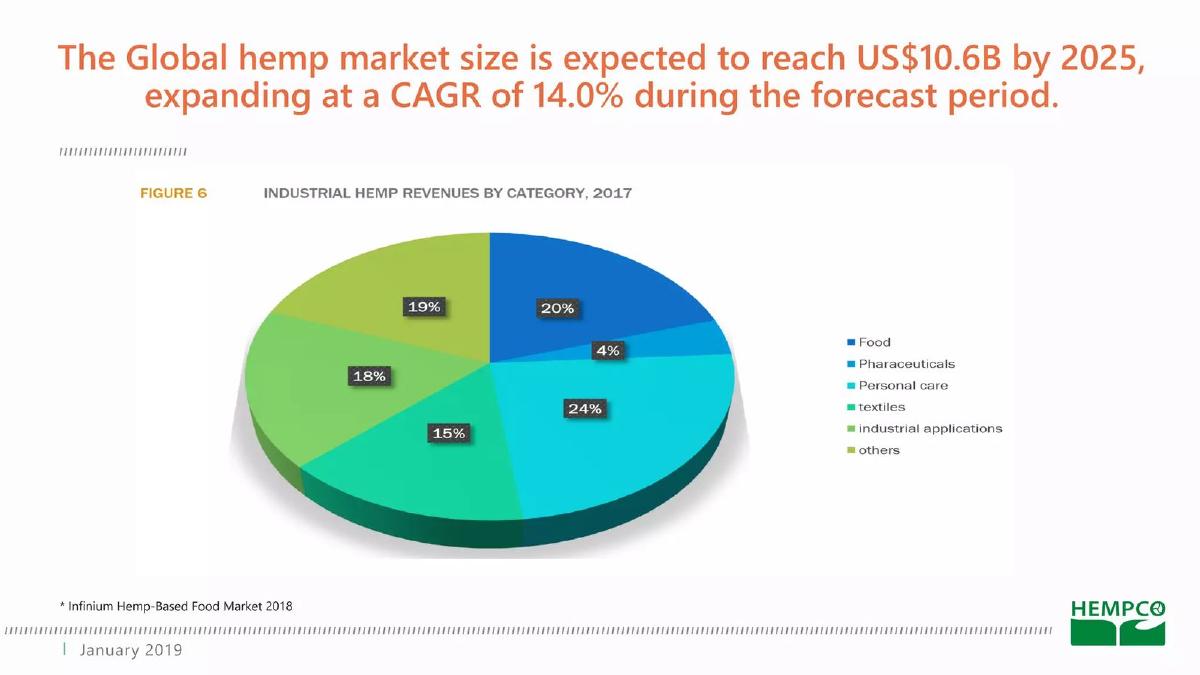
Hempco deck, slide 4. Exact stored slide matched to this analysis.
Our analysis: Global forecast with a category split.
Evidence and limitation: A forecast and a category split. Our check: the six shares add to 100%. The slide doesn't size the categories in dollars or say which ones Hempco sells into (food, from its other slides).
What a founder can adapt: "Hemp $[X] by [year]; [your category] is [%] = $[Y]."
Supporting analysis
What the deck claims: "The Global hemp market size is expected to reach US$10.6B by 2025, expanding at a CAGR of 14.0% during the forecast period." "Figure 6: Industrial hemp revenues by category, 2017": Food 20%, Pharmaceuticals 4%, Personal care 24%, Textiles 15%, Industrial applications 18%, Others 19%. Source note: "Infinium Hemp-Based Food Market 2018."
Presentation choice: The split points to a segment; the segment isn't sized.
When it does not fit: Showing the split without sizing your slice.
Nemus Bioscience deck, slide 5. Exact stored slide matched to this analysis.
Our analysis: Indication-by-indication totals for drug candidates.
Evidence and limitation: A market size per drug and indication, with stage and sources. Our calculation: the five figures add to more than $68B. These are totals for each disease area, not for cannabinoid drugs, and all five candidates are pre-clinical or research stage.
What a founder can adapt: "[Drug] for [indication]: $[X] ([source]); we target [patients] at $[price]."
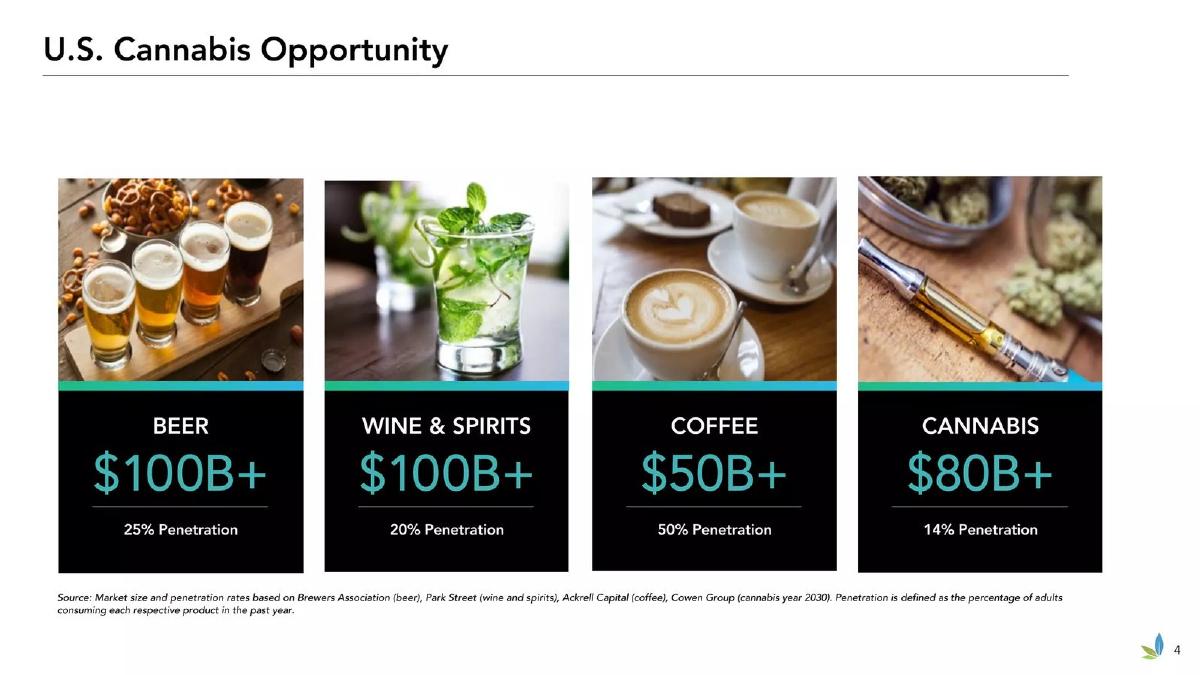
Flower One deck, slide 4. Exact stored slide matched to this analysis.
Our analysis: Category comparison with sourced penetration.
Evidence and limitation: Weaker example. It compares cannabis with other everyday products and defines penetration, with sources. The cannabis figure is a 2030 forecast while the others appear to be current, and the national total is far larger than Nevada, the state on Flower One's next slide.
What a founder can adapt: Follow with your own jurisdiction: "[State] $[X] ([source])."
Supporting analysis
What the deck claims: "U.S. Cannabis Opportunity." "Beer $100B+, 25% Penetration." "Wine & Spirits $100B+, 20% Penetration." "Coffee $50B+, 50% Penetration." "Cannabis $80B+, 14% Penetration." Source note: "Market size and penetration rates based on Brewers Association (beer), Park Street (wine and spirits), Ackrell Capital (coffee), Cowen Group (cannabis year 2030). Penetration is defined as the percentage of adults consuming each respective product in the past year."
Presentation choice: Useful context; it needs the state figure after it.
When it does not fit: Comparing a forecast against current figures without saying so.
After: "After legalisation ([date]), [%] of Germany's [N] tons moves to legal sale × €[price]/g = €[X]."
What improved: Our illustrative rewrite of Cansativa's slide; bracketed text is a placeholder, not company fact.
What's different about cannabis market sizing
Legality differs by state and country and changes over time, so a national total can overstate what a licensed producer can reach. Regulators and tax agencies publish patient registrations and sales, which gives a checkable base. Medical cannabis, adult-use cannabis, hemp and cannabinoid drugs are separate markets with different buyers and rules.
What investors check
Whether the market is legal where the company operates, and when. Whether figures come from a regulator or tax agency. Whether the slide mixes medical, adult-use and hemp. Whether illegal-market volumes are presented as addressable.
How we read each slide
We quote the text on the slide images and mark our own arithmetic as ours. We have not checked any market figure or source. Page numbers are pages in the original deck file. All seven images were already stored and were checked pixel-for-pixel against fresh renders of the decks.
Common mistakes
National totals for a state licence. Size where you can sell.
Illegal volume as addressable. Show the share that moves and when.
Mixing medical, adult-use and hemp. Keep them separate.
Adding disease totals. Size each indication on its own.
Diagnostic checklist
Jurisdiction and legal status named.
Regulator or agency source.
Patients or consumers × spend.
Market type stated.
Company share or target.
Frequently asked questions
How should a cannabis startup size its market?
Use the legal market where you can sell, from regulator or tax data, and show patients or consumers × spend. Aphria: 40,000 to 400,000 Canadian patients, $150M to $1.4B (Health Canada).
Can I include the illegal market?
As context for a law change. Say how much you expect to move to legal sale and when, rather than counting it all, as Cansativa's slide does.
How we chose these examples
Corpus: published pitch deck teardowns on StartupFundraising.com. Founder-uploaded private decks are excluded.
Selection (2026-09-26): we searched teardown slide text for cannabis, marijuana, hemp and CBD together with market-size wording, reviewed thirteen slides from the deck files and kept seven.
Excluded: CanniMed p4, p5 and p6 (highlights and patient trend without a market size), Hempco p3 (repeats p4), Trym p2 (a problem slide with a single headline), Cann p3 (product trend, not market size). Slides already used in other guides were not reused.
Page numbers are pages in the original deck files. All seven images were already stored and were checked pixel-for-pixel against fresh renders on 2026-09-26.
Market figures and sources are quoted from the slides and not independently verified. Calculations (ratios, shares, sums) are ours and marked as such.
Review: slide images were checked on 2026-09-26 and matched to company, deck and page (editorial model review). No person has yet completed an editorial review of this page. We make no claim that any slide caused a fundraising outcome.