Cybersecurity Market Slides: 10 Real Pitch Deck Examples
How security startups size their market: the whole security industry, their own category, or the cost of the attacks they stop.
Cybersecurity Market Slide: Your Category, Not the Whole Industry
Almost every security deck can quote a huge number: global security spending, or the yearly cost of cybercrime. Investors reading a cybersecurity market slide want the smaller number underneath: what buyers spend on the category you sell into, and which buyers you start with. This guide compares ten real market slides from decks tagged cybersecurity in our library, from one that narrows to a first target market to one that shows no security figure at all.
TL;DR
Start with the category you sell into and the buyers you start with, then give the larger figures as context. CyberPal goes from a "$167 B" worldwide market to "UK SMB & medium sized firms... $6.6B market size & 5.5M businesses". Awake separates information security ("$121B" to "$182B") from its own category, network detection and response ("$1.9B" to "$3.8B"), and cites its sources. Claroty sizes each industry it sells to. RackTop adds up segments of two markets without a total, Phybbit sizes the fraud rather than spending on stopping it, and Cobalt shows websites and the DevOps market but no security number. Of the four added examples, Onit sizes its primary budget and one adjacent category with 2025 and 2028 figures from IDC, Snyk lists three categories with growth rates and comparable company values, Wire narrows a $26.2B long-term market to $9B it can address now, and IriusRisk shows TAM, SAM and SOM with footnoted sources but a chart that does not match its own text.
Cybersecurity market slides from real pitch decks
Each example shows the exact slide above its analysis and links to the full teardown. The clearest slides come first; weaker ones follow for contrast. Claims are as shown on the slides; comments are ours.
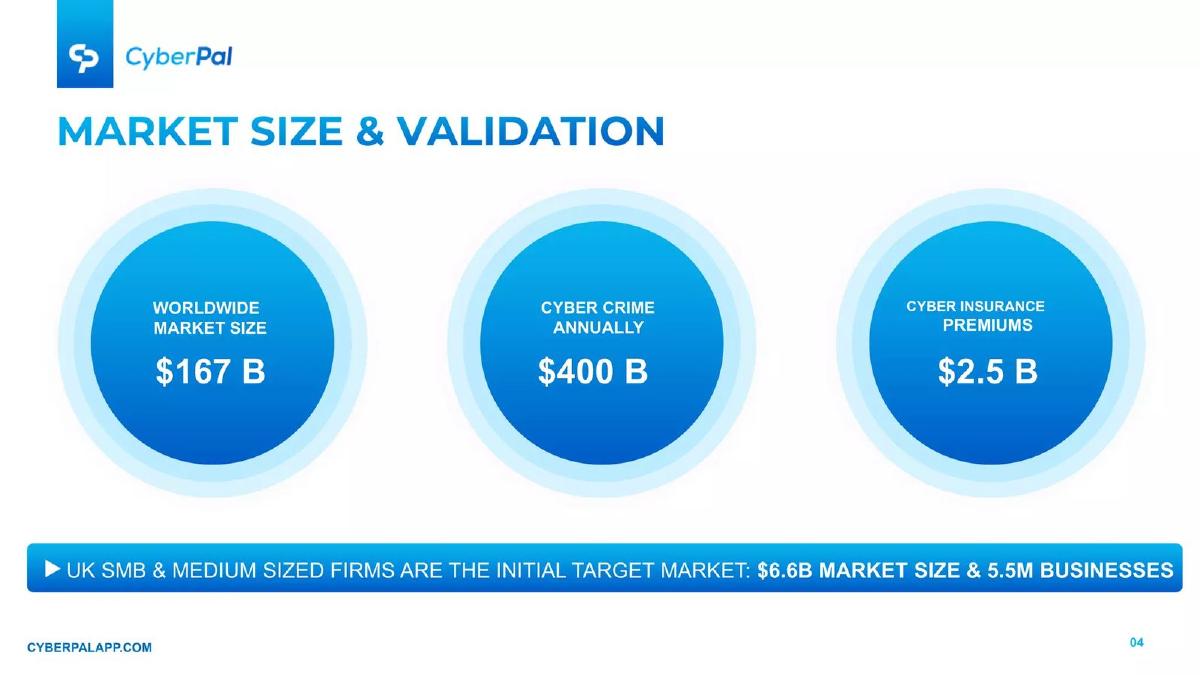
CyberPal market slide — slide 4
Security app for small and medium businesses. Slide titled "Market Size & Validation".
CyberPal deck, slide 4. Exact stored slide matched to this analysis.
Our analysis: The banner is the useful part: it names the first buyers, the country and how many there are. The three circles mix spending, crime losses and insurance, and none has a source or year. The slide doesn't say how the $6.6B was worked out.
Evidence and limitation: Three large figures and a first target market with a size and a count of businesses.
What a founder can adapt: Lead with the target market, show how the $6.6B is built (businesses × spend), and add sources.
Supporting analysis
What the deck claims: Three circles: "Worldwide market size $167 B"; "Cyber crime annually $400 B"; "Cyber insurance premiums $2.5 B". Banner: "UK SMB & medium sized firms are the initial target market: $6.6B market size & 5.5M businesses".
Presentation choice: Naming the first buyers and counting them tells an investor where sales start.
When it does not fit: Putting crime losses next to market size as if they were the same kind of number.
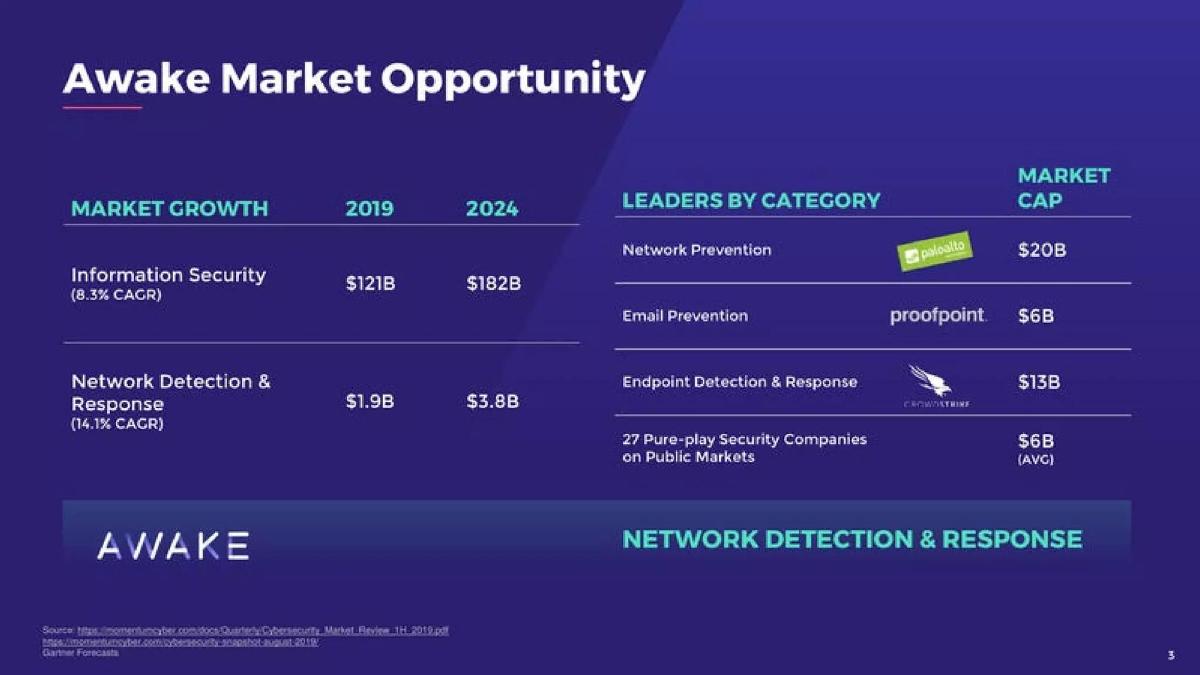
Network detection and response. Slide titled "Awake Market Opportunity".
Awake Security deck, slide 4. Exact stored slide matched to this analysis.
Our analysis: Separating the whole industry from Awake's own category, and showing the category growing faster, answers the question most security market slides skip. The public-company values suggest a category leader can be large, but that is an argument about outcomes, not about Awake's revenue. There are no buyer counts.
Evidence and limitation: Industry and category sizes for two years with growth rates, public-company values by category, and sources.
What a founder can adapt: Add how many buyers are in the category and what one spends.
Supporting analysis
What the deck claims: "Market growth 2019 / 2024": "Information Security (8.3% CAGR) $121B / $182B"; "Network Detection & Response (14.1% CAGR) $1.9B / $3.8B". "Leaders by category" with market cap: Network Prevention (Palo Alto) "$20B"; Email Prevention (Proofpoint) "$6B"; Endpoint Detection & Response (CrowdStrike) "$13B"; "27 Pure-play Security Companies on Public Markets $6B (AVG)". Sources: two Momentum Cyber reports and "Gartner Forecasts".
Presentation choice: A sourced category figure next to the industry figure shows exactly what the company sells into.
When it does not fit: Using other companies' market values as your market size.
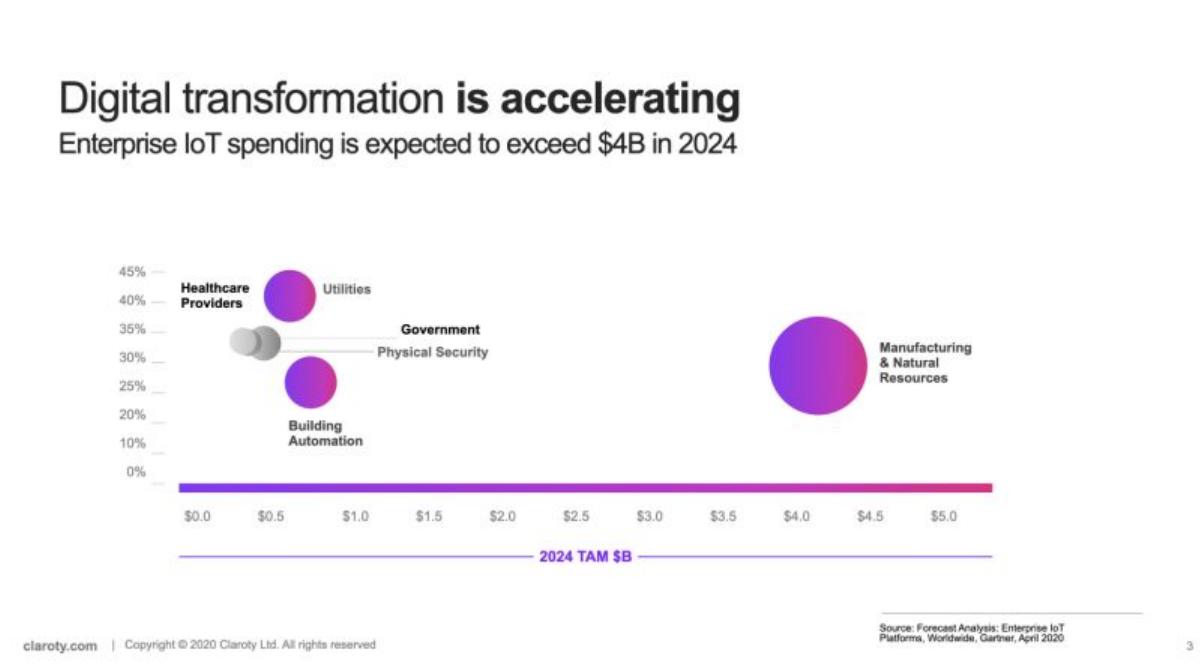
Security for industrial and connected devices (2020 deck). Slide titled "Digital transformation is accelerating".
Claroty deck, slide 3. Exact stored slide matched to this analysis.
Our analysis: Splitting the market by customer industry shows where the money is, and the source is dated. But the figure is for IoT platforms, not IoT security, so it is spending near Claroty's market rather than on it. Only the largest bubble is easy to read.
Evidence and limitation: A sourced forecast broken down by the industries Claroty sells to, with growth rates.
What a founder can adapt: Use a security-specific figure, or say what share of IoT spending goes to security.
Supporting analysis
What the deck claims: Subtitle: "Enterprise IoT spending is expected to exceed $4B in 2024". Bubble chart on "2024 TAM $B" by growth rate for Manufacturing & Natural Resources (about $4B), Healthcare Providers, Utilities, Government, Physical Security and Building Automation. Source: "Forecast Analysis: Enterprise IoT Platforms, Worldwide, Gartner, April 2020".
Presentation choice: Breaking a market down by buyer industry helps an investor see which customers to expect first.
When it does not fit: Sizing the wider technology market and leaving the security share out.
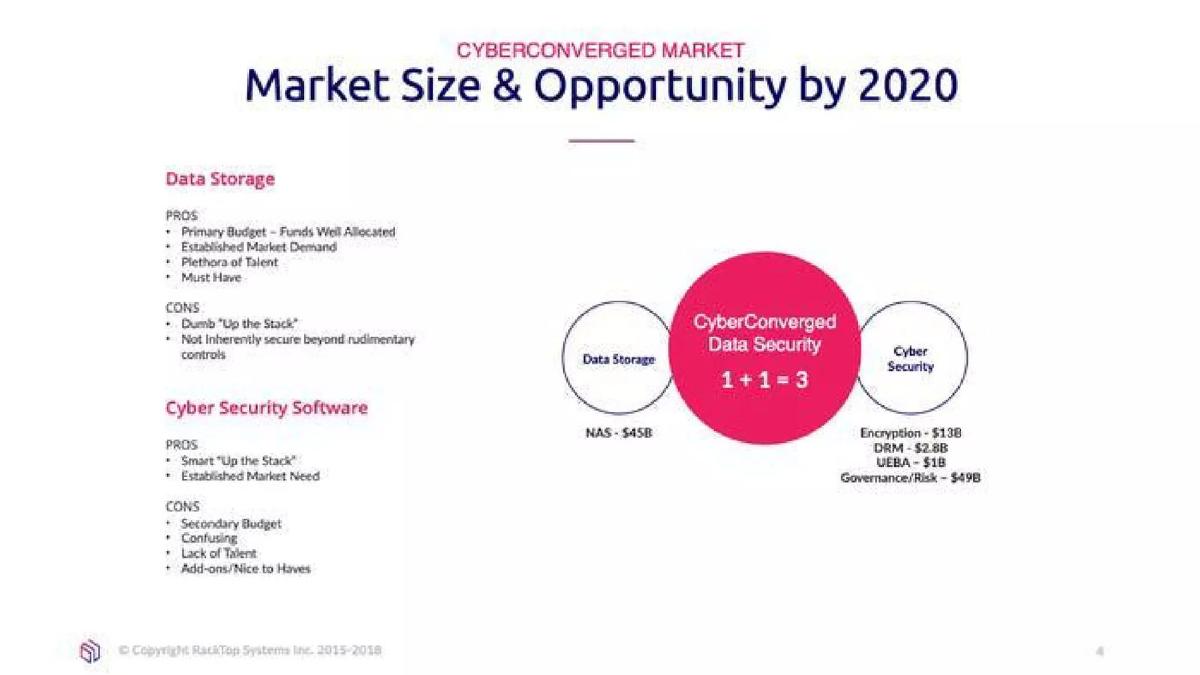
Secure data storage. Slide titled "CyberConverged Market: Market Size & Opportunity by 2020".
RackTop Systems deck, slide 5. Exact stored slide matched to this analysis.
Our analysis: Naming the specific segments is better than quoting all of security. But the slide doesn't say how much of each segment RackTop could win, or what the combined "CyberConverged" market is worth.
Evidence and limitation: Five segment sizes across two markets, with no total, source or year beyond "by 2020".
What a founder can adapt: Add the share of each segment you expect to win and one combined figure with a source.
Supporting analysis
What the deck claims: Pros and cons of "Data Storage" and "Cyber Security Software". Diagram: "Data Storage" + "Cyber Security" = "CyberConverged Data Security 1 + 1 = 3". Figures: "NAS - $45B"; "Encryption - $13B"; "DRM - $2.8B"; "UEBA - $1B"; "Governance/Risk - $49B".
Presentation choice: Listing the segments a combined product replaces shows where the budget would come from.
When it does not fit: "1 + 1 = 3" in place of a number.
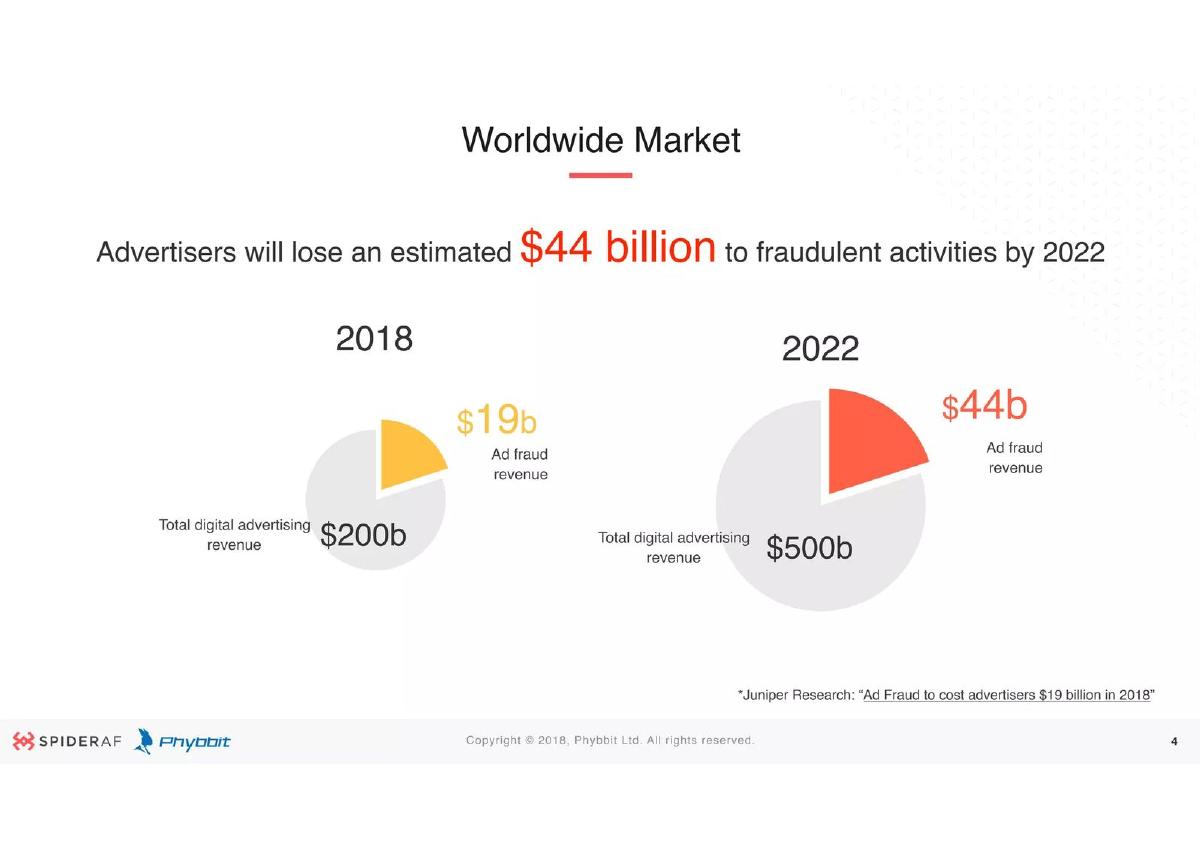
Phybbit deck, slide 4. Exact stored slide matched to this analysis.
Our analysis: The slide shows the problem is large and growing, and cites a source. But it sizes the fraud, not what advertisers spend on fraud detection, so it is closer to a problem slide than a market slide.
Evidence and limitation: Fraud losses and total ad spending for two years, with one source.
What a founder can adapt: Keep the loss figure on the problem slide and add what advertisers spend on detection.
Supporting analysis
What the deck claims: "Advertisers will lose an estimated $44 billion to fraudulent activities by 2022". Pie charts: 2018 "$19b Ad fraud revenue" of "$200b Total digital advertising revenue"; 2022 "$44b" of "$500b". Source: "Juniper Research: 'Ad Fraud to cost advertisers $19 billion in 2018'".
Presentation choice: A sourced loss figure is a strong way to show a problem.
When it does not fit: Presenting losses as the market you can sell into.
Penetration testing as a service. Slide titled "Market Trends".
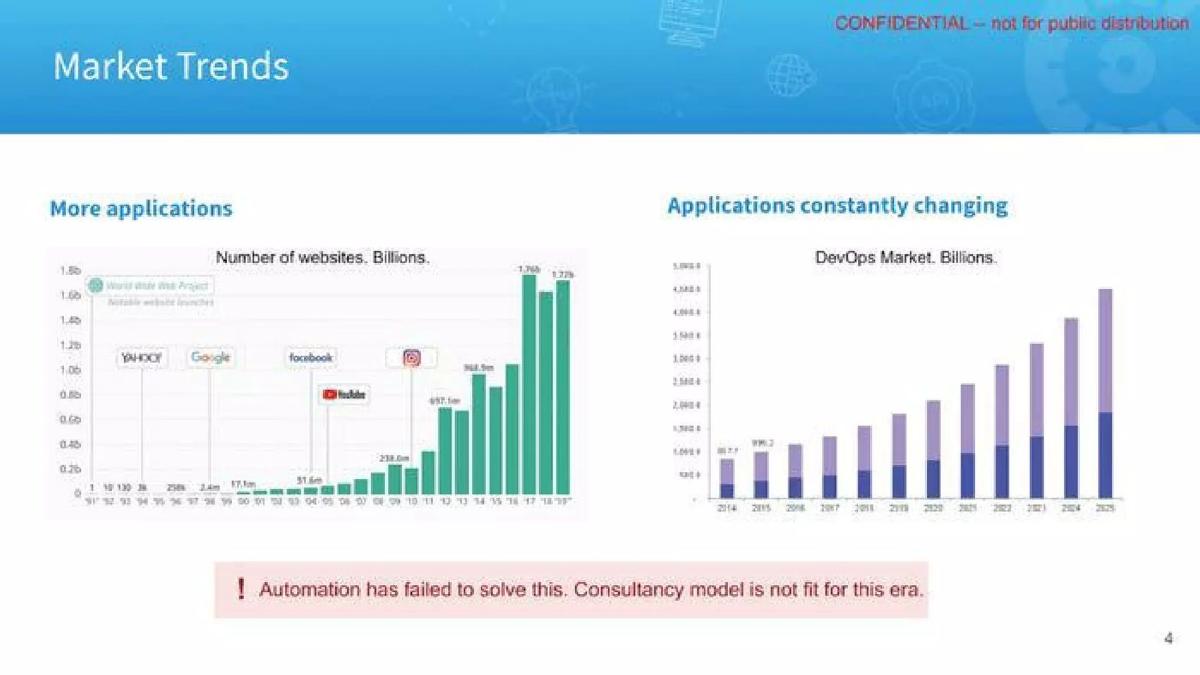
Cobalt deck, slide 4. Exact stored slide matched to this analysis.
Our analysis: The charts argue that there are more applications to test and they change more often. But neither measures spending on security testing, and the DevOps chart's axis is hard to read. The callout is a claim about competitors, not a market size.
Evidence and limitation: Two trend charts with no security figure and no source shown.
What a founder can adapt: Add what companies spend on penetration testing, with a source.
Supporting analysis
What the deck claims: "More applications": chart of "Number of websites. Billions." "Applications constantly changing": chart of "DevOps Market. Billions." from 2014 to 2025. Callout: "Automation has failed to solve this. Consultancy model is not fit for this era."
Presentation choice: Trend charts can explain why demand is growing, but they are not a market size.
When it does not fit: A market slide with no figure for the market you sell into.
Vulnerability management platform. The slide's source line cites an IDC 2024 forecast; stage not stated.
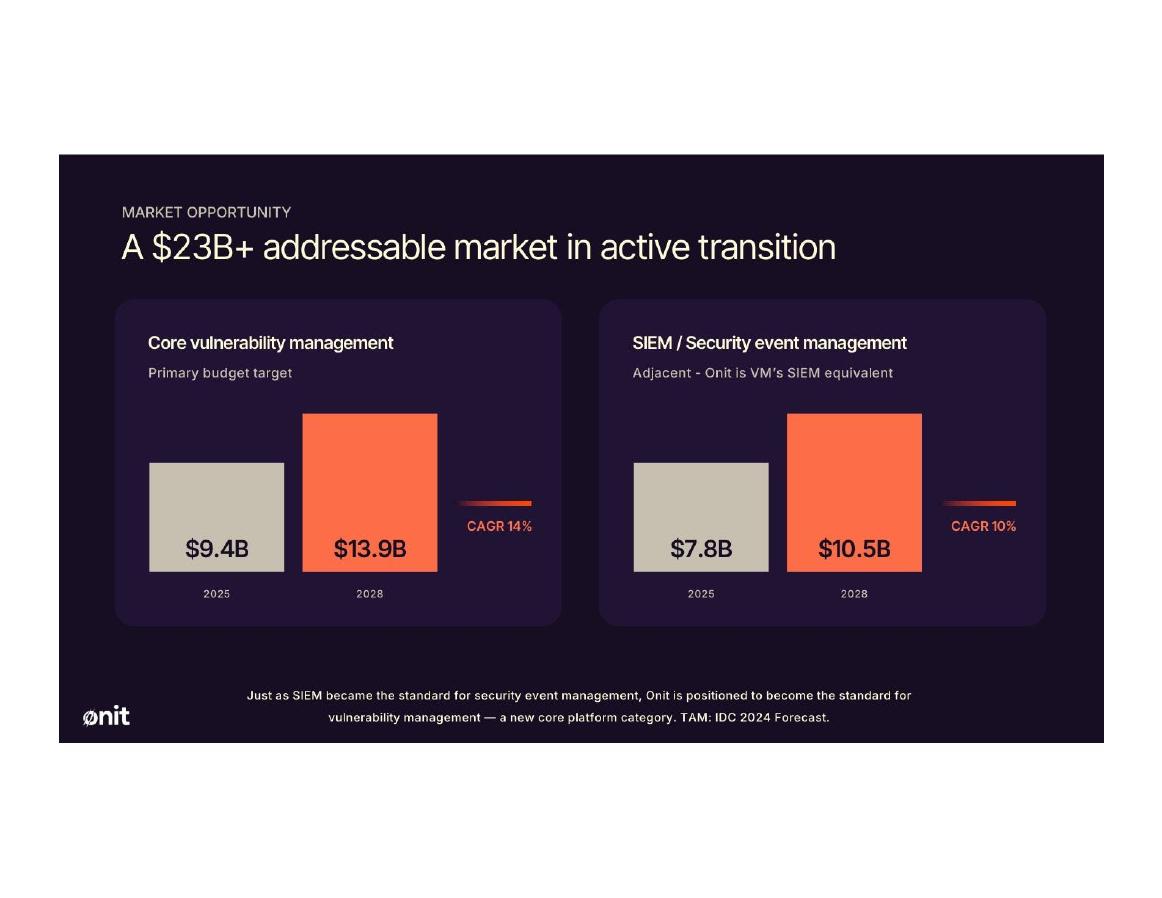
Onit Security deck, slide 7. Exact stored slide matched to this analysis.
Our analysis: It separates the budget Onit sells into from an adjacent one, though the headline adds them together.
Evidence and limitation: Two category sizes for two years with growth rates and a named forecast.
What a founder can adapt: Label your primary budget and give its size on its own; show adjacent categories separately.
Supporting analysis
What the deck claims: "Market Opportunity — A $23B+ addressable market in active transition". Core vulnerability management, "Primary budget target": $9.4B (2025), $13.9B (2028), CAGR 14%. SIEM / Security event management, "Adjacent - Onit is VM's SIEM equivalent": $7.8B (2025), $10.5B (2028), CAGR 10%. Footer: "Just as SIEM became the standard for security event management, Onit is positioned to become the standard for vulnerability management... TAM: IDC 2024 Forecast."
Presentation choice: Naming the primary budget line is what lets an investor judge whether a security product has a buyer today.
When it does not fit: The "$23B+" headline counts the adjacent SIEM budget as addressable now; use $13.9B (2028) or say the larger figure is long-term.
Developer security (finding vulnerabilities in open-source code). Early deck; the slide cites "IDC, 2018 Predictions". The why-now guide uses a different slide from this deck.
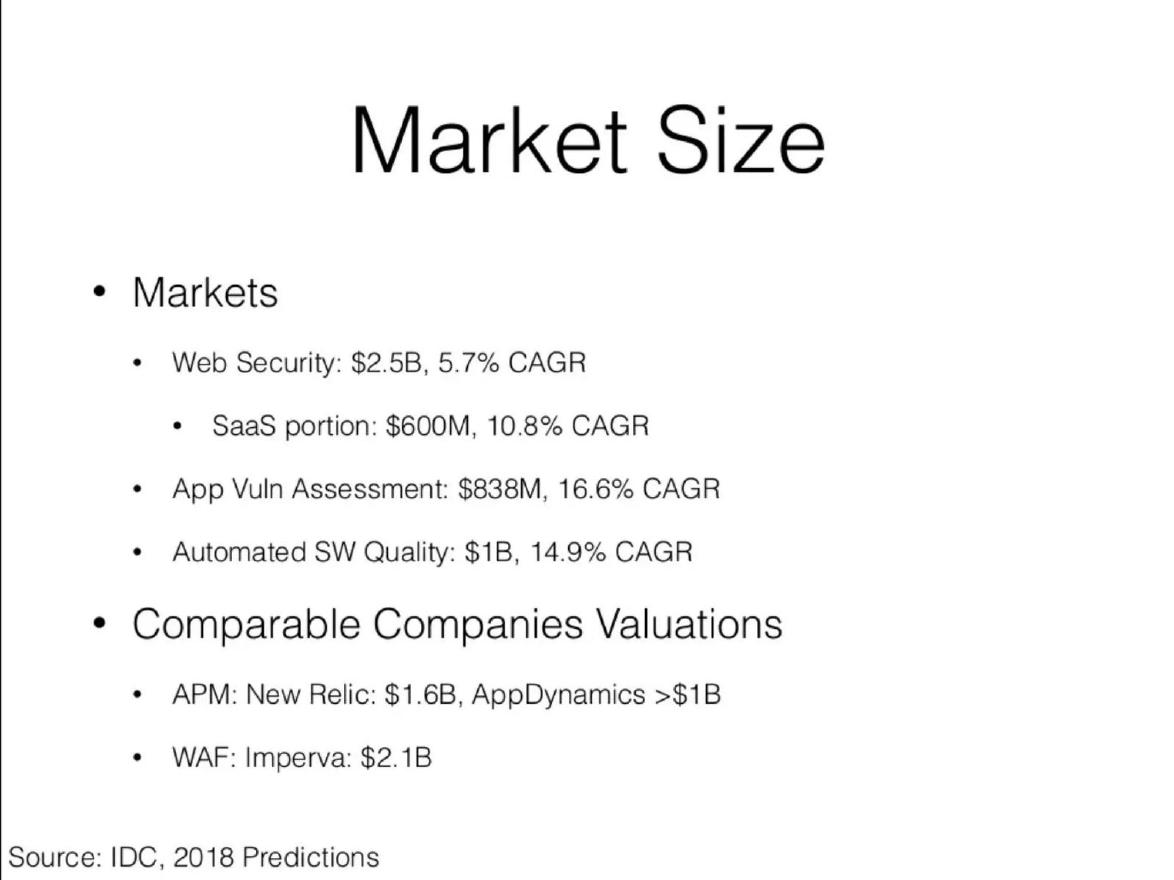
Snyk deck, slide 7. Exact stored slide matched to this analysis.
Our analysis: It sizes the specific categories it sells into, without a combined total, and uses comparable companies to show the outcome size.
Evidence and limitation: Three category sizes with growth rates and a named source, plus three company values.
What a founder can adapt: List the categories you sell into separately, each with size, growth and source.
Supporting analysis
What the deck claims: "Market Size": Web Security $2.5B, 5.7% CAGR (SaaS portion $600M, 10.8% CAGR); App Vuln Assessment $838M, 16.6% CAGR; Automated SW Quality $1B, 14.9% CAGR. "Comparable Companies Valuations": APM: New Relic $1.6B, AppDynamics more than $1B; WAF: Imperva $2.1B. "Source: IDC, 2018 Predictions".
Presentation choice: Small, specific categories with a source are more believable than one huge security figure.
When it does not fit: The slide never says which category Snyk's first product sells into, or how much of each it can win.
Secure messaging and collaboration. Slide footer "Private & Confidential, 2021".
Wire deck, slide 6. Exact stored slide matched to this analysis.
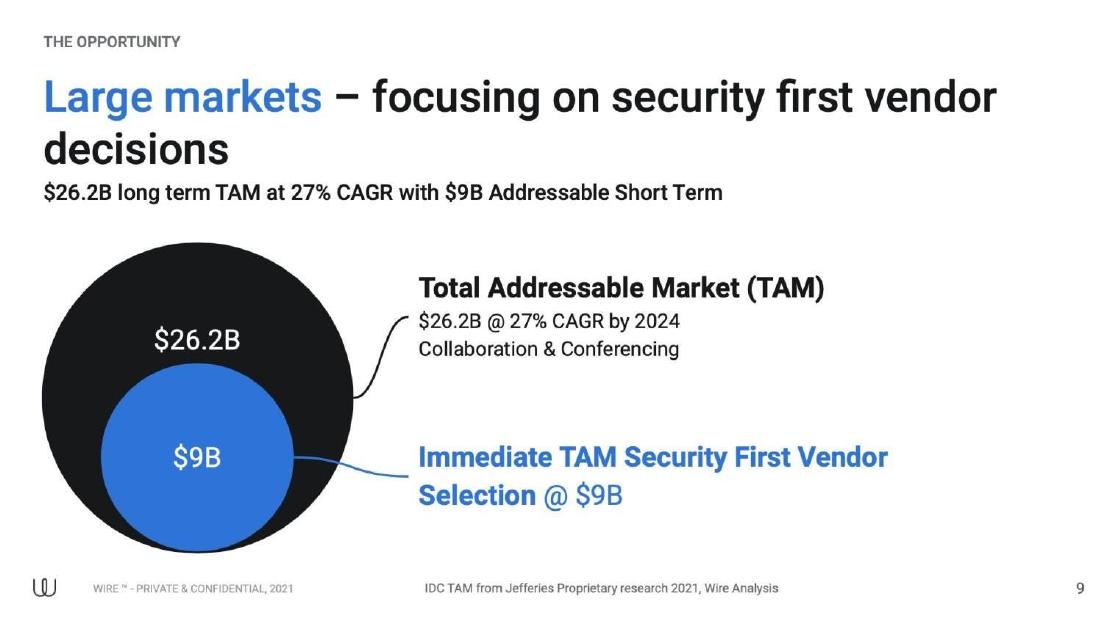
Our analysis: It narrows a broad collaboration market to the buyers who choose on security first, which is where Wire competes.
Evidence and limitation: Two figures with a growth rate, a year and a source line that includes the company's own analysis.
What a founder can adapt: Define your near-term market by the kind of buyer who picks you, and give its size separately.
Supporting analysis
What the deck claims: "The Opportunity — Large markets – focusing on security first vendor decisions": "$26.2B long term TAM at 27% CAGR with $9B Addressable Short Term". Circles: "Total Addressable Market (TAM) $26.2B @ 27% CAGR by 2024, Collaboration & Conferencing" and "Immediate TAM Security First Vendor Selection @ $9B". Source line: "IDC TAM from Jefferies Proprietary research 2021, Wire Analysis".
Presentation choice: The inner circle is defined by buyer behaviour, which explains why a security company only counts part of a larger market.
When it does not fit: The $9B comes partly from "Wire Analysis"; say how security-first buyers were counted.
Threat modeling and secure design software. Figures refer to 2023. The SaaS problem, SaaS solution and cybersecurity team guides use different slides from this deck.
IriusRisk deck, slide 9. Exact stored slide matched to this analysis.
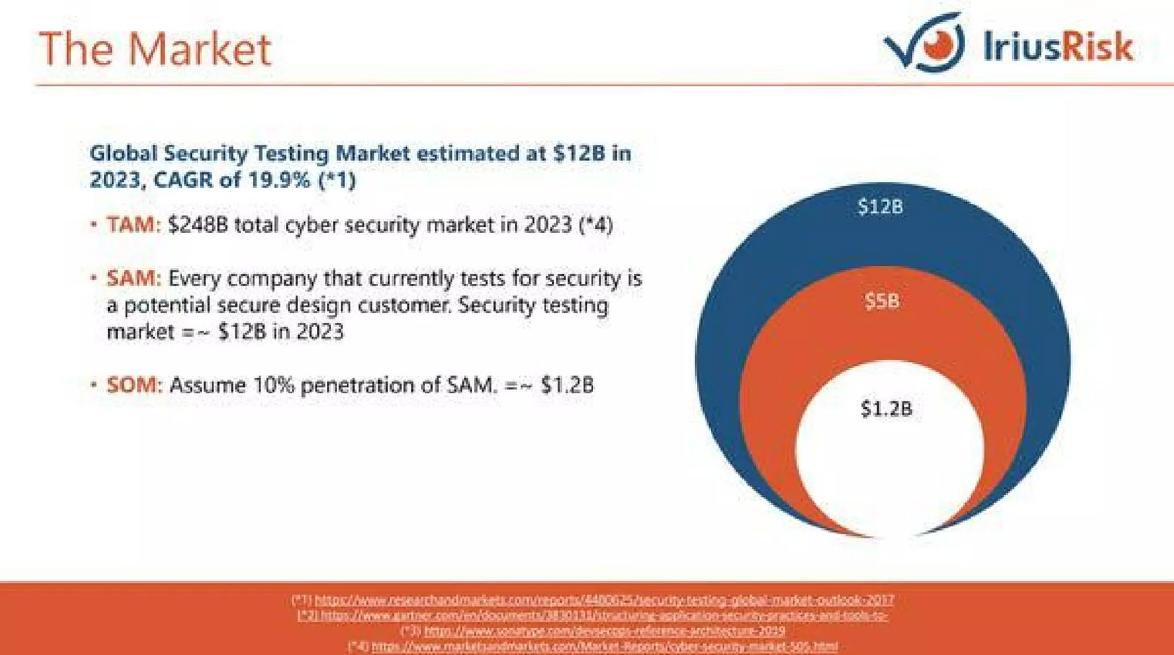
Our analysis: It defines each level in words, but the circles do not match the text: the middle ring shows $5B against a $12B SAM.
Evidence and limitation: Footnoted sources for the figures; the 10% share is an assumption.
What a founder can adapt: Make the chart and text show the same numbers, and give a reason for your share assumption.
Supporting analysis
What the deck claims: "The Market": "Global Security Testing Market estimated at $12B in 2023, CAGR of 19.9%". "TAM: $248B total cyber security market in 2023". "SAM: Every company that currently tests for security is a potential secure design customer. Security testing market =~ $12B in 2023". "SOM: Assume 10% penetration of SAM. =~ $1.2B". Circles labelled $12B, $5B and $1.2B. Four footnoted links (ResearchAndMarkets, Gartner, Sonatype, MarketsandMarkets).
Presentation choice: Shown as a contrast: sourcing is strong, but the mismatched chart and unexplained 10% share undercut it.
When it does not fit: A $248B TAM for all of cybersecurity tells an investor little about a secure-design product.
Whether an investor can see the category the company sells into and its first buyers.
Example
Business
Category sized
First buyers
Source
CyberPal
SMB security app
UK SMBs, $6.6B
5.5M UK businesses
None shown
Awake Security
Network detection
NDR, $1.9B → $3.8B
Not stated
Momentum Cyber, Gartner
Claroty
Industrial/IoT security
IoT platforms by industry
By industry
Gartner, April 2020
RackTop Systems
Secure storage
Five segments, no total
Not stated
None shown
Phybbit
Ad-fraud detection
Fraud losses, not spend
Not stated
Juniper Research
Cobalt
Penetration testing
None
Not stated
None shown
Onit Security
Vulnerability management
VM $9.4B → $13.9B (+SIEM adjacent)
Primary budget named
IDC 2024
Snyk
Developer security
Three categories, no total
Not stated
IDC 2018
Wire
Secure collaboration
$9B security-first buyers
Security-first buyers
IDC via Jefferies, own analysis
IriusRisk
Secure design
SAM $12B (chart shows $5B)
Companies that test security
Four footnoted links
Key Takeaways
Size the category you sell into, not all of security.
Name the first buyers and how many there are.
The cost of attacks is not what buyers spend on protection.
Cite a source and a year for each figure.
If you combine two markets, say how much of each you can win.
Check that your chart's figures match the text beside it.
Build your cybersecurity market slide
Start with the category and buyers, then add the larger context.
Category. Which security category do you sell into, and what do buyers spend on it?
First buyers. Who buys first, where, and how many are there?
Spend. What does one buyer spend on this each year?
Source. Where does each figure come from, and for what year?
Context. Which larger figure, if any, helps an investor see the growth?
Copyable framework: Headline: [number] [buyers] in [region] spend [amount] a year on [category] ([source], [year]). Category growing [rate] a year. Context: total security spending [amount].
Illustrative example 1 — written by us
Before: Market Trends: Number of websites. DevOps Market.
After: [number] companies in [region] buy penetration tests, spending [amount] a year ([source], [year]); [category] growing [rate].
What improved: Our illustrative rewrite; the bracketed details are placeholders, not Cobalt's facts. It replaces trend charts with spending on the service being sold.
What this guide adds
The general market slide guide covers any company. Security has a particular trap: cybercrime and fraud losses are enormous and easy to quote, but they measure damage, not spending. Investors want to know what buyers pay for the kind of product you sell.
Our library's cybersecurity tag includes network security, industrial and IoT security, testing services, ad-fraud detection, secure data storage and security for small businesses. We note each company's business in the examples.
How we read each slide
We quote the text on the stored slide images. We have not checked any market size, growth rate or loss estimate, including those the slides attribute to research firms.
Primary budget and adjacent categories
Security buyers fund products from specific budget lines, such as vulnerability management, SIEM or web security. The strongest new example names the budget it targets. Onit labels core vulnerability management its "Primary budget target" ($9.4B in 2025 to $13.9B in 2028, 14% CAGR) and SIEM "Adjacent" ($7.8B to $10.5B, 10% CAGR), and credits both to an IDC 2024 forecast. An investor can see which budget pays for Onit today and which it hopes to reach later.
Its headline still adds them together ("A $23B+ addressable market"), which counts the adjacent category as if Onit already sold into it. Snyk avoids a combined total: it lists web security ($2.5B, 5.7% CAGR, with a SaaS portion of $600M), app vulnerability assessment ($838M, 16.6% CAGR) and automated software quality ($1B, 14.9% CAGR) separately, citing "IDC, 2018 Predictions". It then adds company values (New Relic $1.6B, AppDynamics more than $1B, Imperva $2.1B) to show that companies in nearby categories have reached that size.
If you name more than one category, label which is your primary budget and give its size on its own line. Keep a combined figure for the long term, and say so.
TAM, SAM and SOM on a security slide
Nested circles are common on security market slides. They work only when each ring is defined and the numbers agree. Wire's circles are clear: a long-term TAM of $26.2B at 27% CAGR by 2024 for collaboration and conferencing, and a $9B "Immediate TAM" where buyers choose a vendor on security first, credited to IDC data from Jefferies research and Wire's own analysis. The inner ring explains why Wire, a secure messaging company, counts only part of the collaboration market.
IriusRisk shows the risk of getting the details wrong. Its text gives TAM as the $248B total cyber security market, SAM as the security testing market of about $12B, and SOM as 10% of SAM, about $1.2B. Its circles read $12B, $5B and $1.2B, so the chart's middle ring does not match the SAM in the text, and the outer ring shows the SAM figure rather than the TAM. The footnoted sources are a strength. The mismatch is the first thing a careful investor will ask about.
Check every figure on the chart against the text and the footnotes before sending the deck. A 10% share assumption also needs a reason, such as current customers or a comparable company's share.
Questions investors ask about a cybersecurity market slide
Which budget line pays for your product today? Onit names it; most slides here do not.
Is the big figure spending on protection, or the cost of attacks? Phybbit sizes fraud losses; Awake and Snyk size spending.
Where does each figure come from, and for which year? Awake, Claroty, Onit, Snyk, Wire and IriusRisk cite sources; CyberPal, RackTop and Cobalt show none.
Why is your share assumption realistic? IriusRisk assumes 10% of its SAM without a reason.
Do the numbers on the slide agree with each other? IriusRisk's circles and text give different SAM figures.
Common mistakes
Whole-industry number. Size your category, not all of security.
Losses as market. Crime and fraud losses measure damage, not spending.
Adjacent market. Say what share goes to security.
No first buyers. Name who you sell to first and how many there are.
No source. Give a source and year for each figure.
Diagnostic checklist
The category you sell into.
Your first buyers and how many there are.
What a buyer spends.
A source and year for each figure.
Losses kept separate from spending.
Frequently asked questions
What should a cybersecurity market slide show?
What buyers spend on your category and who you sell to first. CyberPal names UK small and medium firms: 5.5M businesses and a $6.6B market.
Can I use the cost of cybercrime as my market size?
No. Losses show the problem, not spending on protection. Phybbit's $44B is ad-fraud losses, not what advertisers spend on detection.
Should I show the whole security market?
Only as context next to your category. Awake shows information security at $121B and its own category at $1.9B.
How we chose these examples
Update (2026-10-01): added Onit Security p7, Snyk p7, Wire p6 and IriusRisk p9 after searching the full slide corpus for market, TAM and opportunity wording near cyber, security, threat, breach, identity and fraud terms. They appear after Cobalt. Not used: Netmaker p5 and Qubit Security p9 (deck files not retrievable), Sumo Logic p5 (log management, mostly listed incumbents), Coram AI p4 (physical security), KWESST p27 (listed company) and slides already used in other guides. The four new images were rendered from the published deck PDFs, inspected and stored on 2026-10-01 (editorial model review). No person has reviewed the additions.
Corpus: published pitch deck teardowns on StartupFundraising.com. Founder-uploaded private decks are excluded.
Selection (2026-09-27): we searched extracted slide text in decks tagged cybersecurity for market size, TAM, SAM, billion and market opportunity, kept slides with a stored image, and reviewed each match.
Kept six. All images were already stored, so no uploads were needed. Left out: Cryptsonic p4 (already in the media market guide), Cloudsmith p3 (an executive summary, already in another guide), Rain p5 (the same slide as RackTop's), Nu-Set p2 (physical locks), and slides about the problem rather than the market (CrowdSec p2, Evervault p3, DoControl p2). CyberPal's, RackTop's and Cobalt's decks appear in other guides with different slides.
Review: the stored slide images were checked on 2026-09-27 and matched to company, deck and slide number (editorial model review). No person has yet completed an editorial review of this page.
Claims are as shown on the slides; we have not verified them. We make no claim that any slide caused a fundraising outcome.