HR, Recruiting and Talent Market Size Slides: 5 Real
How HR, recruiting and workforce-training startups size their market: employers × employees × value, learners × price by country, or nested recruiting totals.
HR Market Slide: Employers, Workers and What Each Pays
HR and talent startups can count their market in people: companies of a certain size, the employees inside them, or the job seekers and learners they train. That makes a ground-up calculation possible, and investors expect one. The five slides below range from a complete employers-to-employees-to-dollars sum to a two-circle forecast.
TL;DR
Count the employers or workers you serve, multiply by what each is worth to you, and state a near-term goal as a share. Tomato Sherpa is the clearest example: 40,000 US companies with 400+ employees, 22 million employees × $800 = about $18B, and a 3-year goal of 2,000 companies (5%). CodersTrust shows the same logic by country and product, and every bar adds to its headline.
HR and talent market slides from real pitch decks
Each example shows the slide above its analysis and links to the full teardown. Ground-up calculations come first. Claims are as shown on the slides; comments and calculations are ours.
Tomato Sherpa market slide — slide 5
Employee benefit service sold through employers, US.
Tomato Sherpa deck, slide 5. Exact stored slide matched to this analysis.
Our analysis: Employers › employees × value, plus a share goal.
Evidence and limitation: Employer band, employer count, employee count, value per employee and a goal. Our checks: 22M × $800 = $17.6B, rounded to $18B; 2,000 ÷ 40,000 = 5%, matching the goal. $800 is a lifetime value, not a yearly price, so $18B is not an annual figure. No sources are shown for the counts.
What a founder can adapt: "[N] companies with [size]+ staff ([source]); [M] employees × $[yearly price] = $[X]; year-3 goal [K] companies ([%])."
Supporting analysis
What the deck claims: "Market Size: $18B." "Targeting urban markets with high concentration of corporate partners." Logos marked "(Actual partners)": LinkedIn, GoPro, 2K, Applied Materials, URS, Pandora, Workday, Adobe, HGST, OpenDNS. "Target company size: 400+ employees. Target companies in US: 40,000. Target User Population: 22,000,000 x $800 (LTV)." "$18,000,000,000 Addressable Market." "3 year goal: 2000 Corporate partners in 5 Markets – 5% Addressable Market."
Presentation choice: Every step can be checked, and the goal is tied to the count.
When it does not fit: Using lifetime value where investors expect a yearly figure without saying so.
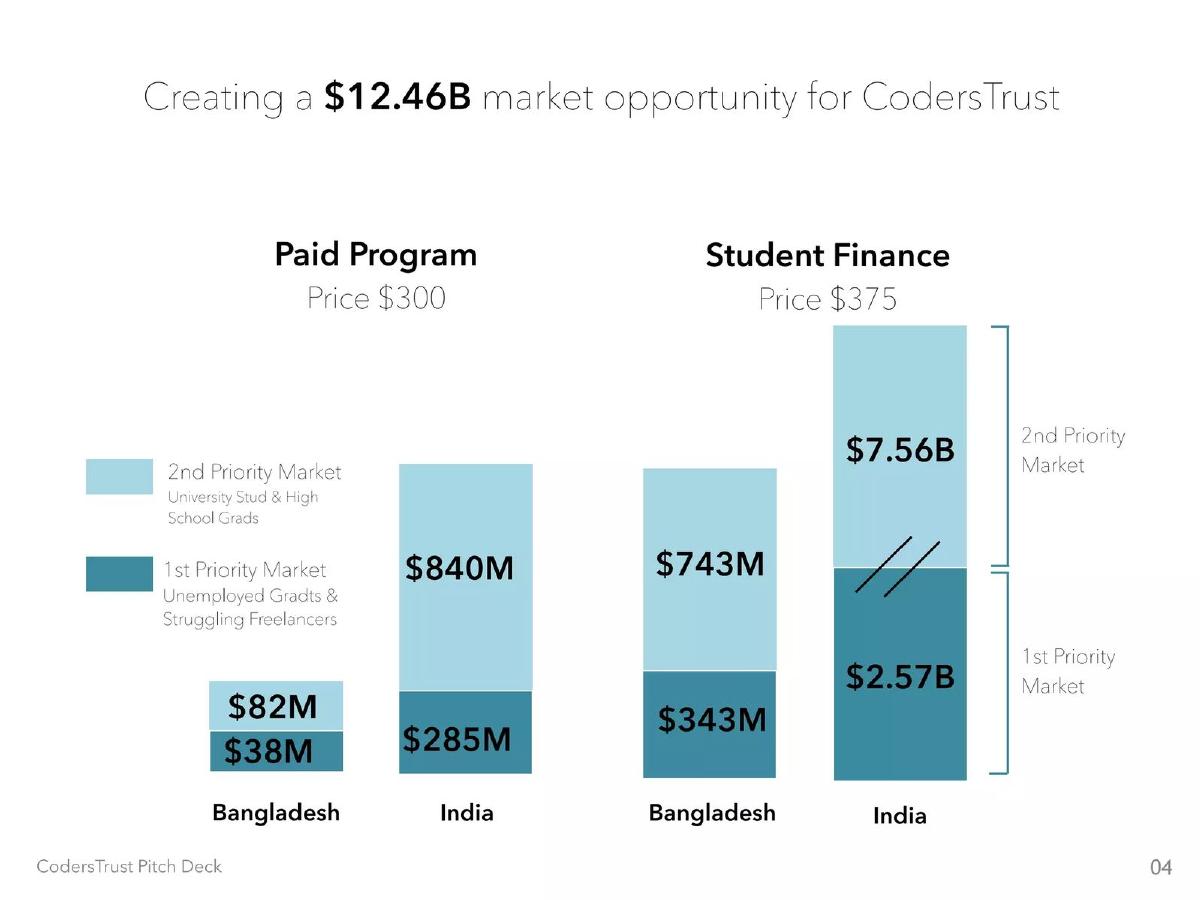
Online skills training and financing for freelancers, South Asia.
CodersTrust deck, slide 6. Exact stored slide matched to this analysis.
Our analysis: Product × country × priority, all adding up.
Evidence and limitation: Two products, two countries, two priority groups, each with a price. Our check: the eight bars add to $12.46B, matching the headline. Learner counts behind each bar are on the previous slide, not this one.
What a founder can adapt: "[Product] at $[price]: [country] first priority $[X], second $[Y]; total $[Z]."
Supporting analysis
What the deck claims: "Creating a $12.46B market opportunity for CodersTrust." "Paid Program, Price $300": Bangladesh $38M (1st priority) + $82M (2nd); India $285M + $840M. "Student Finance, Price $375": Bangladesh $343M + $743M; India $2.57B + $7.56B. "1st Priority Market: Unemployed Grads & Struggling Freelancers." "2nd Priority Market: University Stud & High School Grads."
Presentation choice: Investors can see which group and country come first.
When it does not fit: Bars that don't add to the headline.
Claire deck, slide 5. Exact stored slide matched to this analysis.
Our analysis: Recruiting › online › students.
Evidence and limitation: Three nested figures narrowing to the student segment, with a source. Our calculation: online is about 10% of recruiting services. The slide doesn't say whether $906m is students within online recruiting or within all recruiting, or what Claire charges.
What a founder can adapt: "Recruiting $[X] › online $[Y] › [segment] $[Z] ([source]); we charge $[fee] per [hire]."
Supporting analysis
What the deck claims: "Market Size." "$27 bn Recruiting Services in US & Canada." "$2.79 bn Online Recruiting." "$906 m Students." Source note: "Employment & Recruiting Industry in the US & Canada (IBISWorld, 2018)."
Presentation choice: Narrowing to students is the right move; the link between circles isn't stated.
When it does not fit: Nested circles without saying what each sits inside.
Protrainy deck, slide 5. Exact stored slide matched to this analysis.
Our analysis: Industry funnel with workforce context.
Evidence and limitation: A named industry, a three-step funnel and workforce context. Our calculations: SAM is about 72% of TAM and SOM about 11.5% of SAM. The slide doesn't show how each step is derived, or link the 17 lakh (1.7 million) engineers to the rupee figures.
What a founder can adapt: "[N] engineers × ₹[price] = TAM ₹[X]; [region] [M] = SAM; year-3 [K] = SOM."
Supporting analysis
What the deck claims: "Market Size." Funnel: "Indian Civil Engineering Market" › "Total Addressable Market ₹34.87B" › "Serviceable Addressable Market ₹25.14B" › "Serviceable Obtainable Market ₹2.89B." "India's construction sector needs skilled workers to achieve economic growth targets, with employment estimated to reach 100 million by 2030. Currently, over 80% of the workforce is unskilled." "It is estimated that 17 lakh civil engineers may seek employment by FY2029-30 — growing at a CAGR of 10.4%."
Presentation choice: The workforce figures are the base for a count; the maths isn't shown.
When it does not fit: A funnel with no derivation.
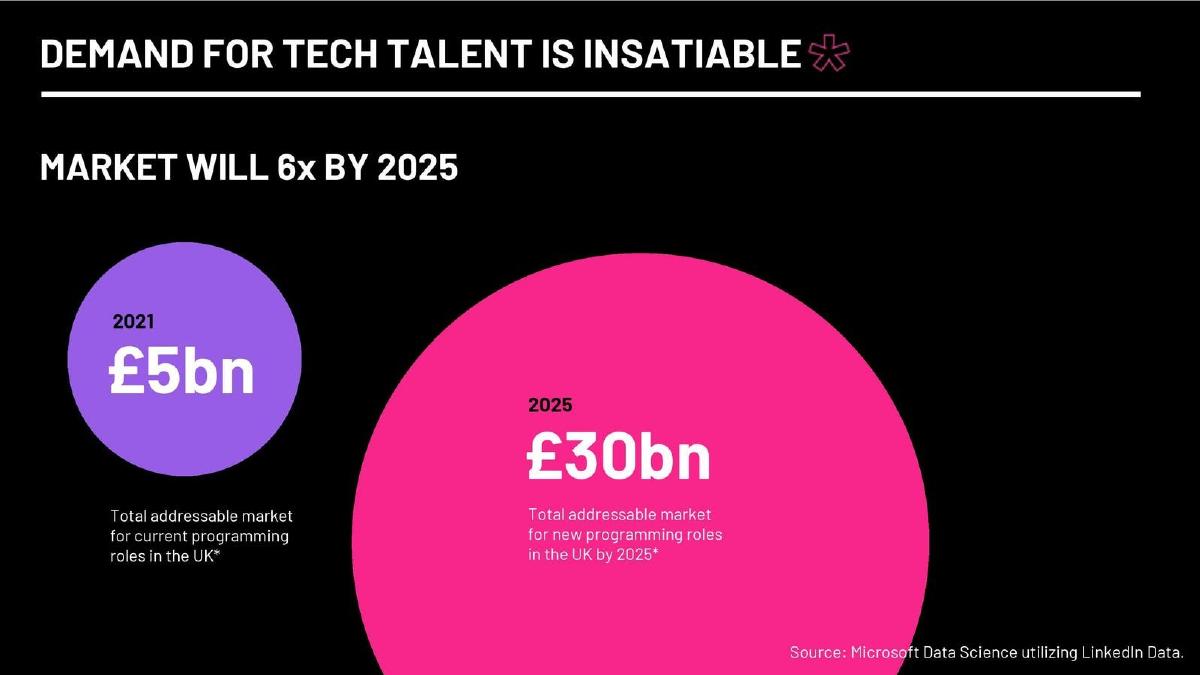
Code First Girls deck, slide 3. Exact stored slide matched to this analysis.
Our analysis: Two sourced totals and a growth claim.
Evidence and limitation: Weaker example. It names the country and the source, and £5bn to £30bn is 6x as stated. It doesn't say how roles convert to pounds (hiring fees, training fees or salaries), or how much Code First Girls earns per role.
What a founder can adapt: "[N] new roles by [year] ([source]) × £[fee per hire] = £[X]."
Supporting analysis
What the deck claims: "Demand for tech talent is insatiable." "Market will 6x by 2025." "2021: £5bn — Total addressable market for current programming roles in the UK." "2025: £30bn — Total addressable market for new programming roles in the UK by 2025." "Source: Microsoft Data Science utilizing LinkedIn Data."
Presentation choice: Growth in demand is useful context; revenue per role is missing.
When it does not fit: Totals without the unit behind them.
After: "[N] new UK programming roles by 2025 (Microsoft/LinkedIn) × £[fee per hire] = £[X]."
What improved: Our illustrative rewrite of Code First Girls' slide; bracketed text is a placeholder, not company fact.
What's different about HR market sizing
Employer counts by size band, workforce numbers and graduate figures are published, so the count side is checkable. Pricing is usually per employee, per hire or per learner. A useful slide shows which one, and who pays: the employer or the worker.
What investors check
Whether the company or worker count is sourced and matches the target size band. Whether the value per person is a yearly price or a lifetime value. Whether the parts add to the total. Whether a first-market goal is stated.
How we read each slide
We quote the text on the slide images and mark our own arithmetic as ours. We have not checked any market figure or source. Page numbers are pages in the original deck file. All five images were already stored and were checked pixel-for-pixel against fresh renders of the decks. We found five slides that size an HR or talent market clearly enough to compare, and did not pad the guide with weaker ones.
Common mistakes
Lifetime value as annual market. Say which one you're using.
Nested figures with no link. Say what each circle sits inside.
Funnels with no maths. Show how each step is derived.
Totals without a unit. Tie pounds to roles, hires or learners.
Diagnostic checklist
Sourced employer or worker count.
Price per employee, hire or learner.
Payer named.
Parts add to the total.
Near-term goal as a share.
Frequently asked questions
How should an HR startup size its market?
Count the companies in your size band and their employees, multiply by your price per employee, and set a goal as a share. Tomato Sherpa: 22M employees × $800 ≈ $18B, 3-year goal 2,000 of 40,000 companies.
Can I use total recruiting spend?
As context. Narrow to your segment and say what you charge, as Claire starts to do with students.
How we chose these examples
Corpus: published pitch deck teardowns on StartupFundraising.com. Founder-uploaded private decks are excluded.
Selection (2026-09-26): we searched teardown slide text for market-size wording together with recruiting, hiring, workforce, employees, talent and related terms, reviewed eight slides from the deck files and kept five.
Excluded: Protrainy p4 and 10KC p6 (no market figures), Maturious p5 (benefits of hiring older workers, not market size). Slides already used in other guides were not reused. We did not add weaker slides to reach a higher count.
Page numbers are pages in the original deck files. All five images were already stored and were checked pixel-for-pixel against fresh renders on 2026-09-26.
Market figures and sources are quoted from the slides and not independently verified. Calculations (sums, shares, ratios) are ours and marked as such.
Review: slide images were checked on 2026-09-26 and matched to company, deck and page (editorial model review). No person has yet completed an editorial review of this page. We make no claim that any slide caused a fundraising outcome.