How media, content and creator startups show traction: audience size next to engagement and demographics, activity per community.
Media Traction Slides: Real Pitch Deck Examples
Six traction slides from media, content and creator decks (a comedy brand, community forums, a social publishing tool, a photo app, a branded content app and a book publisher), shown in full. Audience numbers are easy to collect and easy to inflate, so investors look for three things behind them: how engaged the audience is, who it is, and whether anyone pays.
TL;DR
A media traction slide should pair audience size with engagement and, when it exists, money. Almost Friday puts followers next to weekly reach, engagement rate and audience demographics. Reddit shows posts, comments and pageviews for each community, not just subscribers. Buffer leads with 800 paying users and a $150,000 run rate before its 55,000 total users. Pixt shows monthly active users and installs with dashboard screenshots. Loot lists users, content created and a run rate. Holloway uses a past publishing experiment as proof, the weakest evidence here because it predates the company's product.
Media traction slides
Each example shows the exact stored slide above its analysis and links to the full teardown. Stronger examples first. Claims and figures are as shown on the slides; we have not verified them.
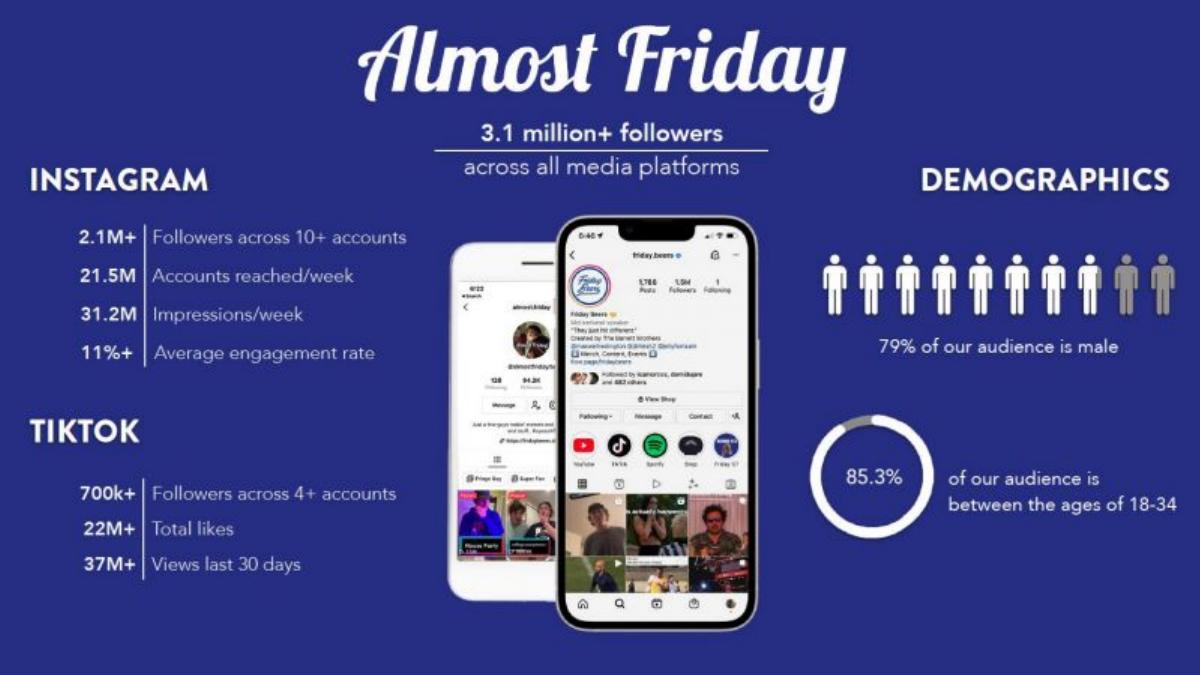
Almost Friday traction slide — slide 2
Seed (recorded). Comedy media brand on Instagram and TikTok. Platform figures, phone screenshots and demographics.
Almost Friday deck, slide 2. Exact stored slide matched to this analysis.
Our analysis: The most complete audience slide here: size, engagement and who the audience is are all visible. It has no revenue, and the follower totals combine many accounts.
Evidence and limitation: Followers, weekly reach and impressions, engagement rate and recent views, split by platform, with audience age and gender.
What a founder can adapt: Split figures by platform, add an engagement rate and one recent period, and say who the audience is.
Supporting analysis
What the deck claims: "3.1 million+ followers across all media platforms." Instagram: "2.1M+ Followers across 10+ accounts", "21.5M Accounts reached/week", "31.2M Impressions/week", "11%+ Average engagement rate". TikTok: "700k+ Followers across 4+ accounts", "22M+ Total likes", "37M+ Views last 30 days". Demographics: "79% of our audience is male", "85.3% of our audience is between the ages of 18-34."
Presentation choice: Advertisers and brand partners buy a specific audience, so demographics turn a follower count into something saleable.
When it does not fit: Adding followers across accounts without saying how much they overlap.
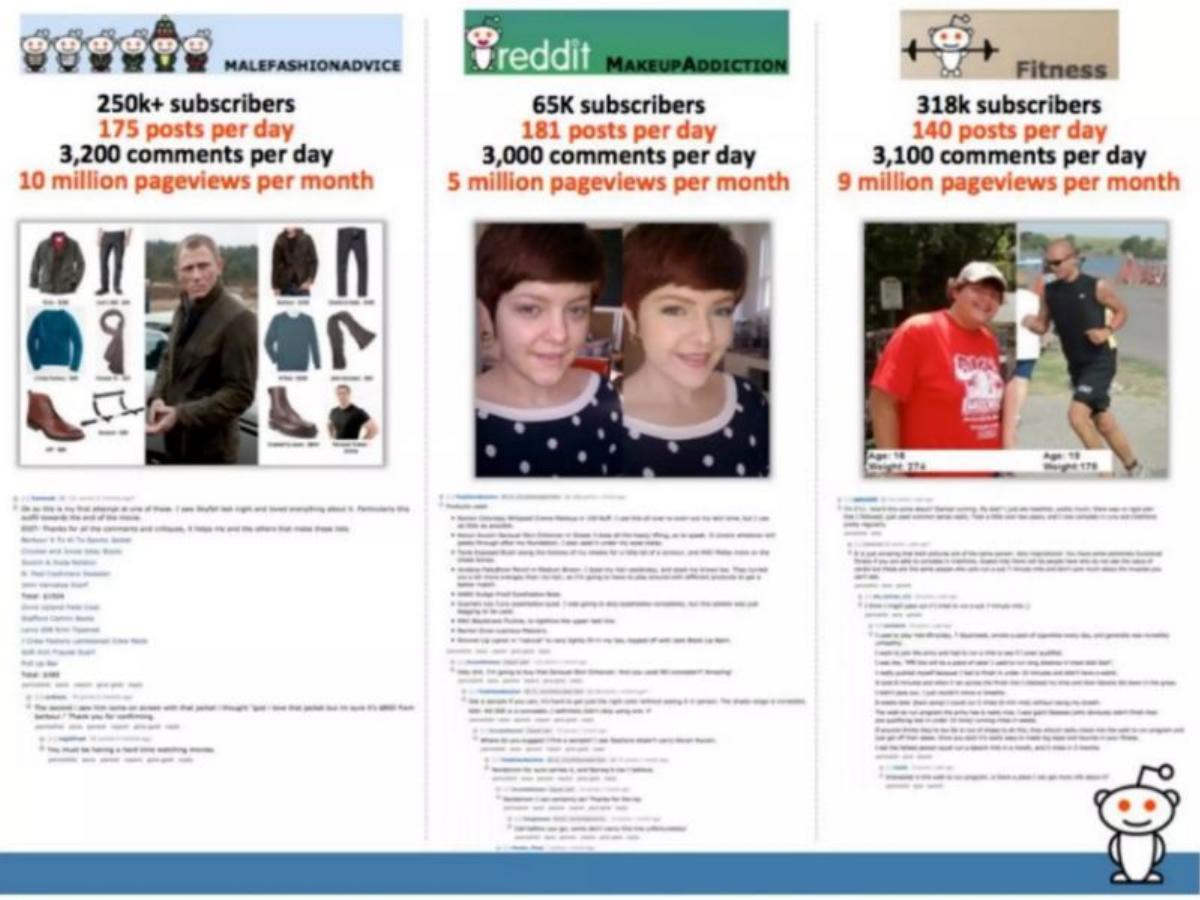
Growth stage (recorded). Online communities. Three communities side by side with screenshots.
Reddit deck, slide 6. Exact stored slide matched to this analysis.
Our analysis: Shows activity, not just membership: the smallest community has as many daily posts as the largest. The slide has no date.
Evidence and limitation: Subscribers, daily posts and comments and monthly pageviews for three named communities; no date or revenue.
What a founder can adapt: Show one or two activity measures per community or channel, alongside the member count.
Supporting analysis
What the deck claims: MaleFashionAdvice: "250k+ subscribers, 175 posts per day, 3,200 comments per day, 10 million pageviews per month." MakeupAddiction: "65K subscribers, 181 posts per day, 3,000 comments per day, 5 million pageviews per month." Fitness: "318k subscribers, 140 posts per day, 3,100 comments per day, 9 million pageviews per month."
Presentation choice: Posts and comments per day show an audience that participates, which is harder to fake than a subscriber count.
When it does not fit: Leaving out the date; audience numbers go stale quickly.
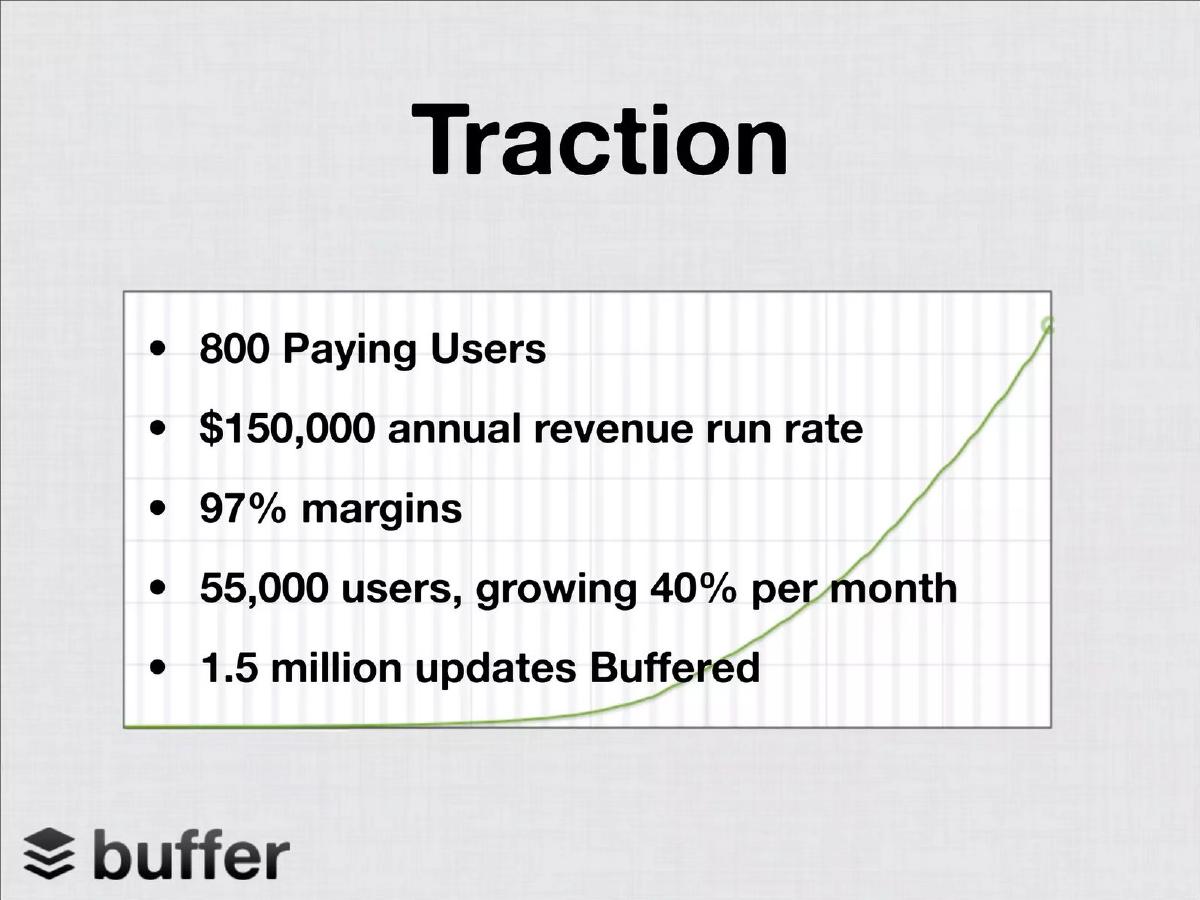
Seed (recorded). Tool for scheduling social media posts. Five figures over a growth curve.
Buffer deck, slide 5. Exact stored slide matched to this analysis.
Our analysis: Clear about money: it leads with the people who pay, which lets investors work out about 1.5% conversion and roughly $190 a year per paying user.
Evidence and limitation: Paying users, run rate and margin first, then total users with a monthly growth rate and usage. The background curve has no axis values.
What a founder can adapt: If anyone pays, lead with paying users and revenue, then show the wider audience.
Supporting analysis
What the deck claims: "800 Paying Users." "$150,000 annual revenue run rate." "97% margins." "55,000 users, growing 40% per month." "1.5 million updates Buffered."
Presentation choice: Putting paying users above total users shows the audience already turns into revenue.
When it does not fit: A decorative curve with no values; either label it or drop it.
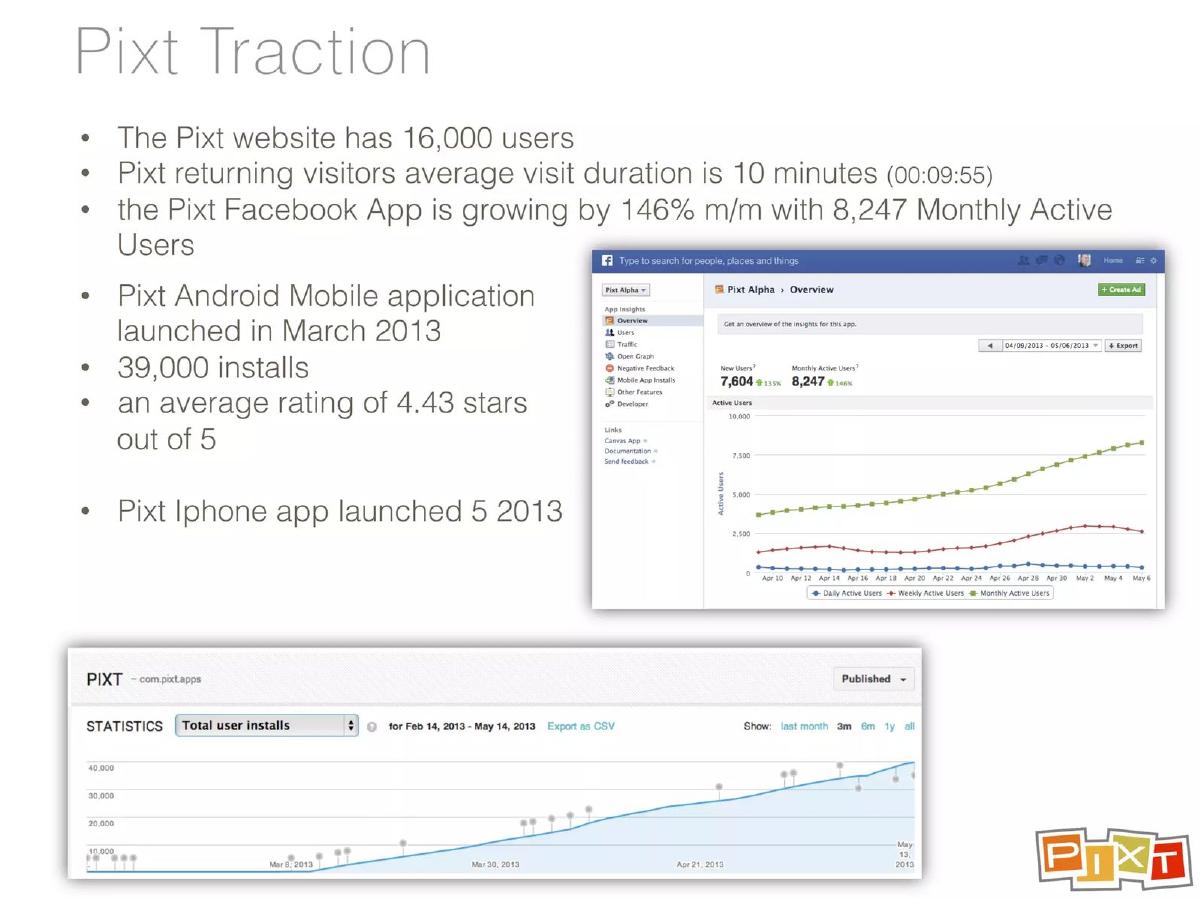
Seed (recorded). Photo sharing app on web, Facebook and Android. Bullet points with two dashboard screenshots.
Pixt deck, slide 5. Exact stored slide matched to this analysis.
Our analysis: The screenshots make the numbers checkable, but users are counted separately on each platform, so the total audience is unclear.
Evidence and limitation: Monthly active users, installs, visit length and app rating, with dated dashboard screenshots behind the main figures.
What a founder can adapt: Add a dated screenshot of the source behind your headline figure, and say whether users overlap across platforms.
Supporting analysis
What the deck claims: "The Pixt website has 16,000 users." "Pixt returning visitors average visit duration is 10 minutes (00:09:55)." "The Pixt Facebook App is growing by 146% m/m with 8,247 Monthly Active Users." "Pixt Android Mobile application launched in March 2013." "39,000 installs." "An average rating of 4.43 stars out of 5." Screenshots: Facebook app insights (April to May 2013) and Android total installs (February to May 2013).
Presentation choice: Showing the source dashboard is a quick way to make early figures credible.
When it does not fit: Listing a separate user count for each platform without a combined figure.
Seed (recorded). App for creating and sharing branded content. Four lines.
Loot deck, slide 3. Exact stored slide matched to this analysis.
Our analysis: Covers audience, activity and money briefly, but does not say who pays (users or brands) or how the run rate is calculated.
Evidence and limitation: Users, daily sign-ups, content created and a run rate; no dates beyond the year, and no engagement or paying-customer count.
What a founder can adapt: Say who the paying customer is and how many there are, next to the run rate.
Supporting analysis
What the deck claims: "60,000 users (adding 600-1,000 new users daily)." "350,000 pieces of branded content created and shared." "$120,000 run rate for 2015." "Featured in" TechCrunch and VentureBeat.
Presentation choice: Content created per user (about six here) is a simple engagement measure for a creation app.
When it does not fit: Press logos as traction; they show attention, not use.
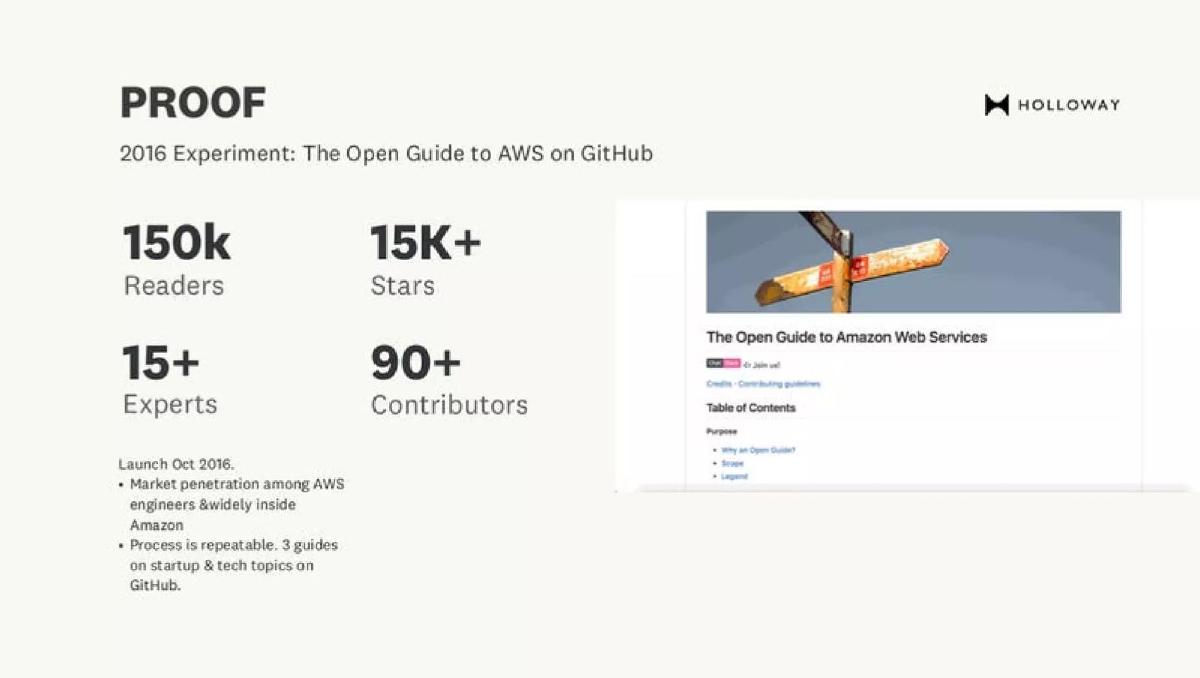
Seed (recorded). Publisher of practical guides. A 2016 experiment shown as proof, with a screenshot.
Holloway deck, slide 3. Exact stored slide matched to this analysis.
Our analysis: The weakest evidence here, included for contrast: it shows people will read the content for free, not that they will pay for it, and "widely inside Amazon" is not measured.
Evidence and limitation: Readers, GitHub stars and contributors for a free guide published before the company's paid product.
What a founder can adapt: Label experiments clearly, and add any sign of willingness to pay (pre-orders, email sign-ups, paid pilots).
Supporting analysis
What the deck claims: "PROOF." "2016 Experiment: The Open Guide to AWS on GitHub." "150k Readers." "15K+ Stars." "15+ Experts." "90+ Contributors." "Launch Oct 2016." "Market penetration among AWS engineers & widely inside Amazon." "Process is repeatable. 3 guides on startup & tech topics on GitHub."
Presentation choice: An early experiment can show demand when a company has no product yet, if it is labelled as an experiment, as it is here.
When it does not fit: Unmeasured claims such as "widely used"; give a number or leave it out.
After: 150,000 readers of a free guide since October 2016. [n] signed up for email updates; [n] pre-ordered the paid edition at [$].
What improved: Our illustrative rewrite; not Holloway's wording. Bracketed parts are placeholders to fill with real facts. It keeps the reader count and replaces the unmeasured claim with signs of willingness to pay.
What this guide adds
The library has media problem, solution, product and market guides, and a consumer app traction guide focused on downloads, active use and retention. This page looks at the problem specific to media and creator companies: audience figures (followers, subscribers, readers, pageviews) that look large but may not show engagement or revenue.
Sector labels come from the sector recorded for each published teardown (high confidence for Holloway and Loot, medium for the other four; Buffer is a social media publishing tool). None of these six slides appears in another guide.
Three questions behind an audience number
Engagement: reach, impressions, engagement rate, posts, comments or time spent (Almost Friday, Reddit, Pixt).
Who: age, gender or interest, which is what advertisers buy (Almost Friday, Reddit).
Money: paying users, run rate or revenue per user (Buffer, Loot).
Common mistakes
Followers alone. Add an engagement rate or active-user figure.
Totals added across accounts. Say how much the audiences overlap.
No date. Audience figures change fast; date each one.
Press logos as traction. Coverage is attention, not use.
Diagnostic checklist
Audience size by platform, with a date.
At least one engagement measure.
Audience traits if you sell to advertisers.
Paying users or revenue when they exist.
Frequently asked questions
How we chose these examples
Corpus: published pitch deck teardowns on StartupFundraising.com. Founder-uploaded private decks are excluded.
Selection (2026-09-27): we took teardowns whose recorded sector is media, with a stored slide image and slide text about users, subscribers, followers, readers, views or revenue. We read the candidates, left out market-size slides, a founder's earlier-apps slide (Sheena Allen), a customer case study (AdPushup), slides with no stored image (Manu), and consumer app slides already covered by the consumer app traction guide, and kept six that show different ways of presenting media traction. Holloway is included as the weakest example for contrast.
Sector is the category recorded for each teardown (high confidence for Holloway and Loot; medium for Almost Friday, Reddit, Buffer and Pixt). Stages as recorded: seed for five; Reddit, growth.
Review: stored slide images were checked on 2026-09-27 and matched to company, deck and slide number, and quoted text was read from the images (editorial model review). No person has yet completed an editorial review of this page.
Claims and figures are as shown on the slides; we have not verified them. Derived figures (Buffer conversion and revenue per paying user, Loot content per user) are our arithmetic from the slide figures. We make no claim that any slide caused a fundraising outcome.