Media and Creator Market Size Slides: 7 Real Examples
How media, music, advertising and creator-economy startups size their market. Seven real market slides compared: which ones narrow to a reachable segment.
Media Market Slide: Audiences, Creators and the Spend You Can Reach
Media industry totals are huge and easy to find: entertainment, advertising, music, streaming. On their own, they show a startup can quote a report. Investors look for the step from that total to the creators, listeners or advertisers the product actually serves, and what each is worth. The slides below range from a staged, sourced narrowing to a single broad headline.
TL;DR
Name the paying group (creators selling products, advertisers, subscribers), size the segment you start in, and show where you stand today. Elopage is the clearest example: current GMV of €200m, an intermediary €1.2bn, and a first target of €16-20bn for digital product sales in German-speaking Europe. Industry headlines such as Big Happy's US mobile ad forecast or Cryptsonic's $549bn digital content figure frame the space but don't show what the startup could earn.
Media market slides from real pitch decks
Each example shows the slide above its analysis and links to the full teardown. Slides that narrow to a reachable segment come first. Claims are as shown on the slides; comments and calculations are ours.
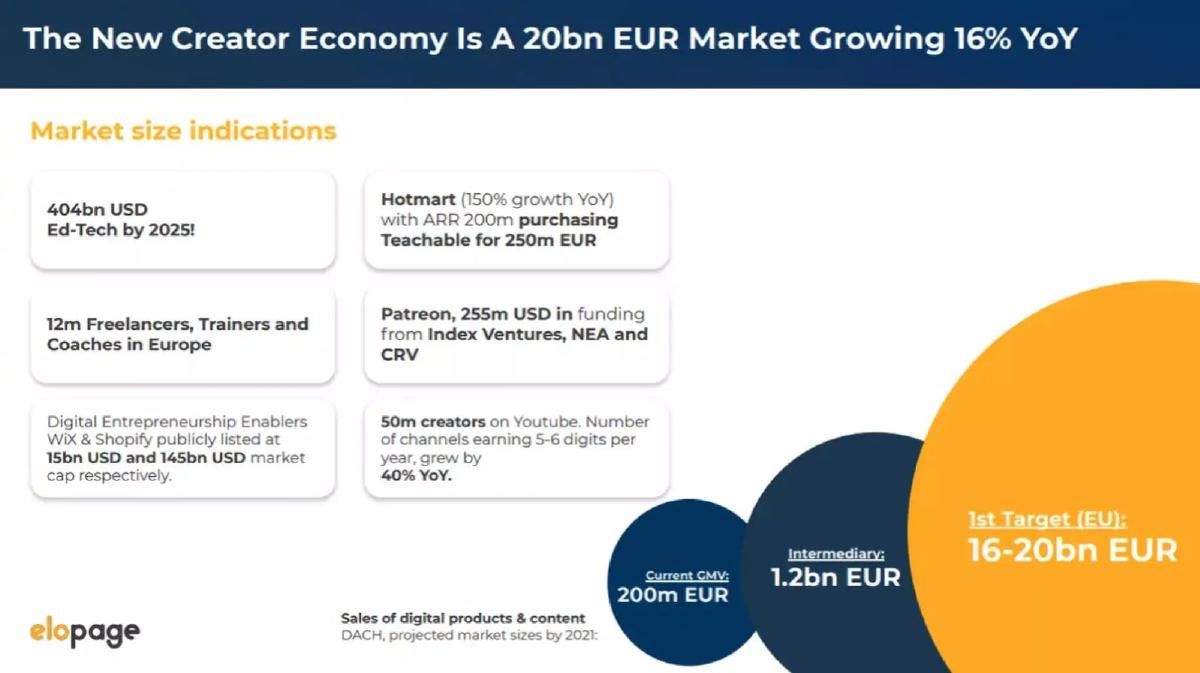
elopage market slide — slide 6
Platform for creators, coaches and trainers to sell digital products.
elopage deck, slide 6. Exact stored slide matched to this analysis.
Our analysis: Staged narrowing with current GMV shown.
Evidence and limitation: It names the unit (sales of digital products and content), the region, and the company's current position in the same money unit. Our calculation: €200m is about 1-1.25% of the €16-20bn first target. The side boxes mix funding rounds, acquisitions and an ed-tech total that don't add to the market, and the circles have no source.
What a founder can adapt: "Today: $[GMV]. Next: [segment] $[X]. First target: [region] $[Y] ([source, year])."
Supporting analysis
What the deck claims: "The New Creator Economy Is A 20bn EUR Market Growing 16% YoY." "Market size indications": "404bn USD Ed-Tech by 2025!"; "12m Freelancers, Trainers and Coaches in Europe"; "Hotmart (150% growth YoY) with ARR 200m purchasing Teachable for 250m EUR"; "Patreon, 255m USD in funding from Index Ventures, NEA and CRV"; "50m creators on Youtube." Circles: "Current GMV: 200m EUR"; "Intermediary: 1.2bn EUR"; "1st Target (EU): 16-20bn EUR." Caption: "Sales of digital products & content, DACH, projected market sizes by 2021."
Presentation choice: Investors see where the company is today against the target.
When it does not fit: Filling the slide with other companies' rounds.
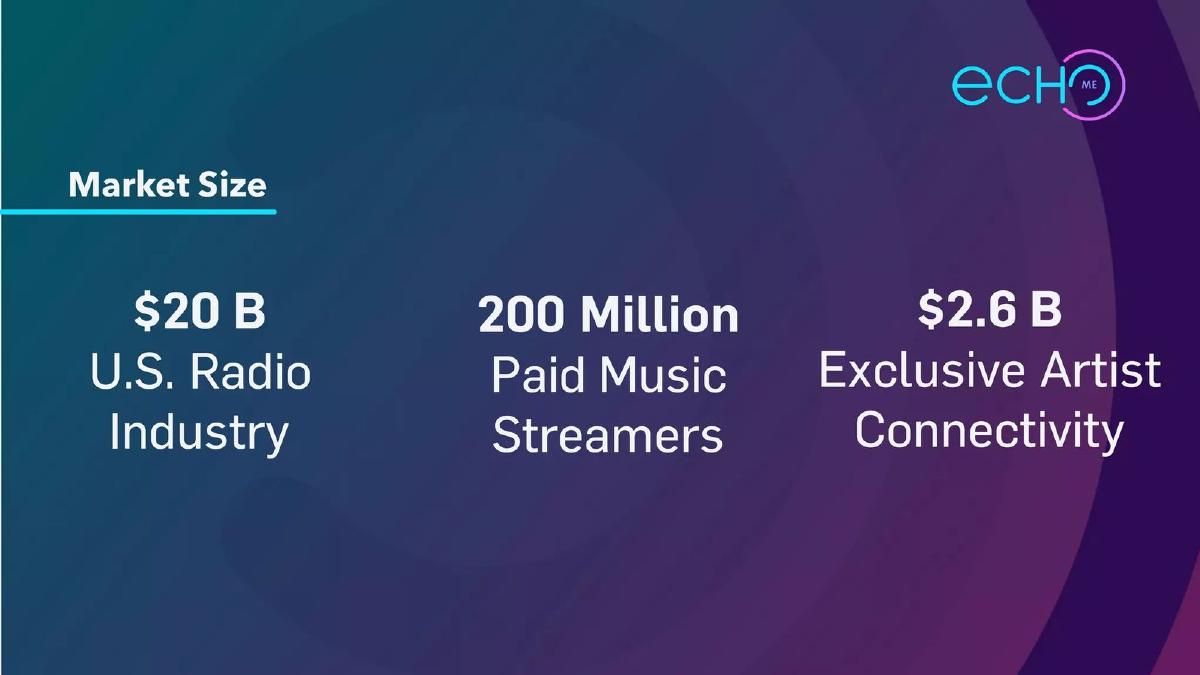
Echo deck, slide 6. Exact stored slide matched to this analysis.
Our analysis: Three segment figures in mixed units.
Evidence and limitation: Three figures, each naming a segment. Two are money and one is a count of people, and the slide doesn't say which one Echo earns from or how they relate. $2.6B for artist connectivity is the closest to the product but has no source or basis.
What a founder can adapt: "[N] paid streamers × [x]% × $[price] = $[X] ([source])."
Supporting analysis
What the deck claims: "Market Size." "$20 B U.S. Radio Industry." "200 Million Paid Music Streamers." "$2.6 B Exclusive Artist Connectivity."
Presentation choice: Naming the closest segment helps; explaining it would help more.
When it does not fit: Mixing people and dollars side by side.
On-demand vinyl manufacturing for independent artists.
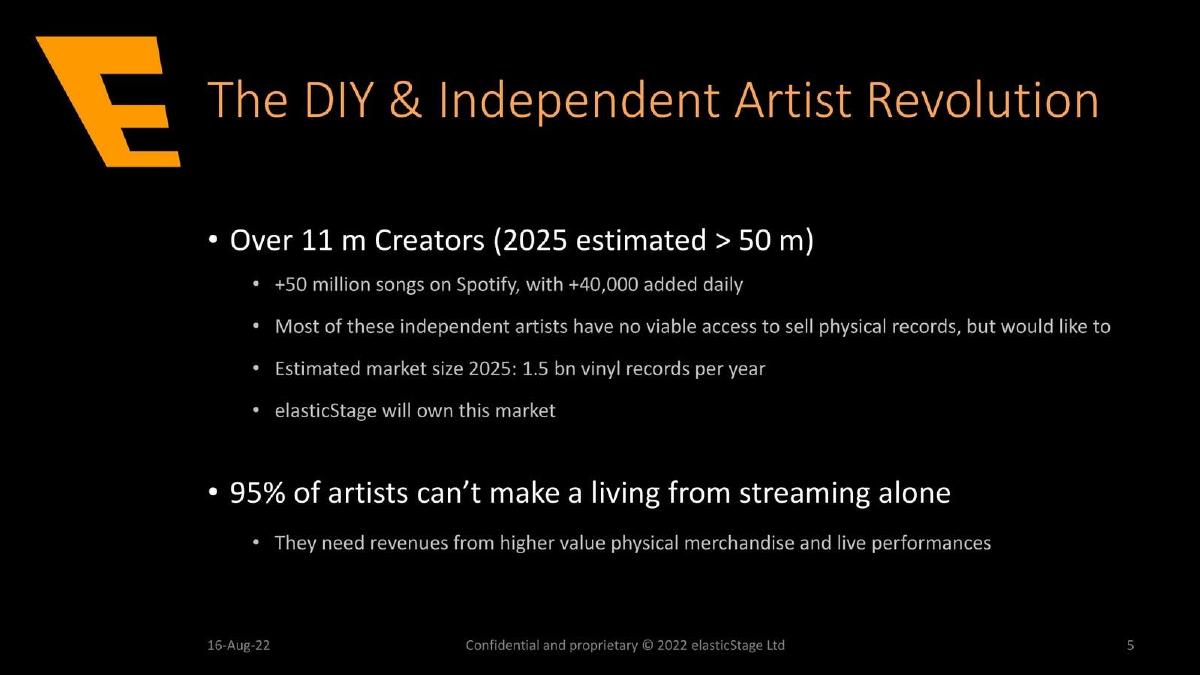
elasticStage deck, slide 5. Exact stored slide matched to this analysis.
Our analysis: Creator count and unit volume, no price.
Evidence and limitation: It names the group (independent artists) and sizes the market in records rather than money. Our calculation: 1.5bn records ÷ 50m creators = 30 records per creator a year. No price per record or source is given, so the money value is left for investors to work out, and "will own this market" is a claim, not a share.
What a founder can adapt: "[N] artists × [records] × $[margin] = $[X] ([source, year])."
Supporting analysis
What the deck claims: "The DIY & Independent Artist Revolution." "Over 11 m Creators (2025 estimated > 50 m)." "+50 million songs on Spotify, with +40,000 added daily." "Most of these independent artists have no viable access to sell physical records, but would like to." "Estimated market size 2025: 1.5 bn vinyl records per year." "elasticStage will own this market." "95% of artists can't make a living from streaming alone."
Presentation choice: Counting creators links the market to who buys.
When it does not fit: Unit volumes without a price.
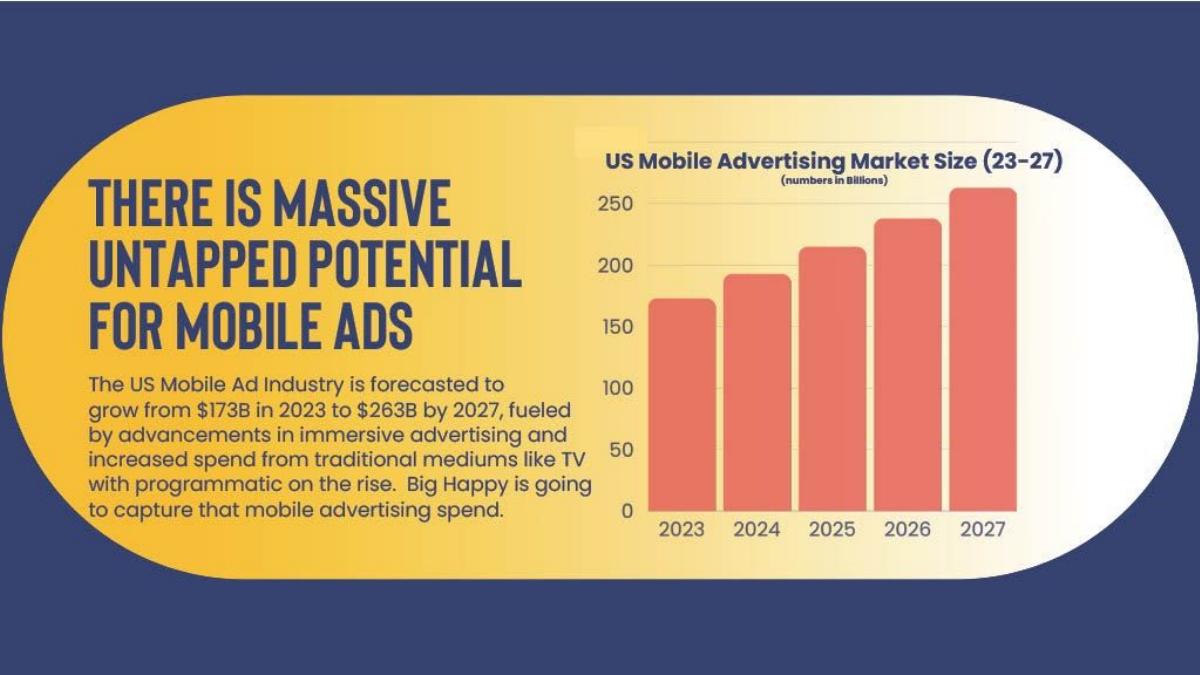
Big Happy deck, slide 4. Exact stored slide matched to this analysis.
Our analysis: Industry forecast with a growth chart.
Evidence and limitation: A clear region and a forecast. Our calculation: $173B to $263B over four years is about 11% a year. The market is the whole US mobile ad industry; the slide gives no source, no segment (format, advertiser type) and no share Big Happy could win.
What a founder can adapt: "US mobile ads $[X] ([source]); [format] $[Y]; our [N] advertisers × $[spend] = $[Z]."
Supporting analysis
What the deck claims: "There is massive untapped potential for mobile ads." "The US Mobile Ad Industry is forecasted to grow from $173B in 2023 to $263B by 2027, fueled by advancements in immersive advertising and increased spend from traditional mediums like TV with programmatic on the rise. Big Happy is going to capture that mobile advertising spend." Bar chart: "US Mobile Advertising Market Size (23-27), numbers in billions."
Presentation choice: A dated forecast frames growth; investors still need the segment.
When it does not fit: "We're going to capture that spend" without a share.
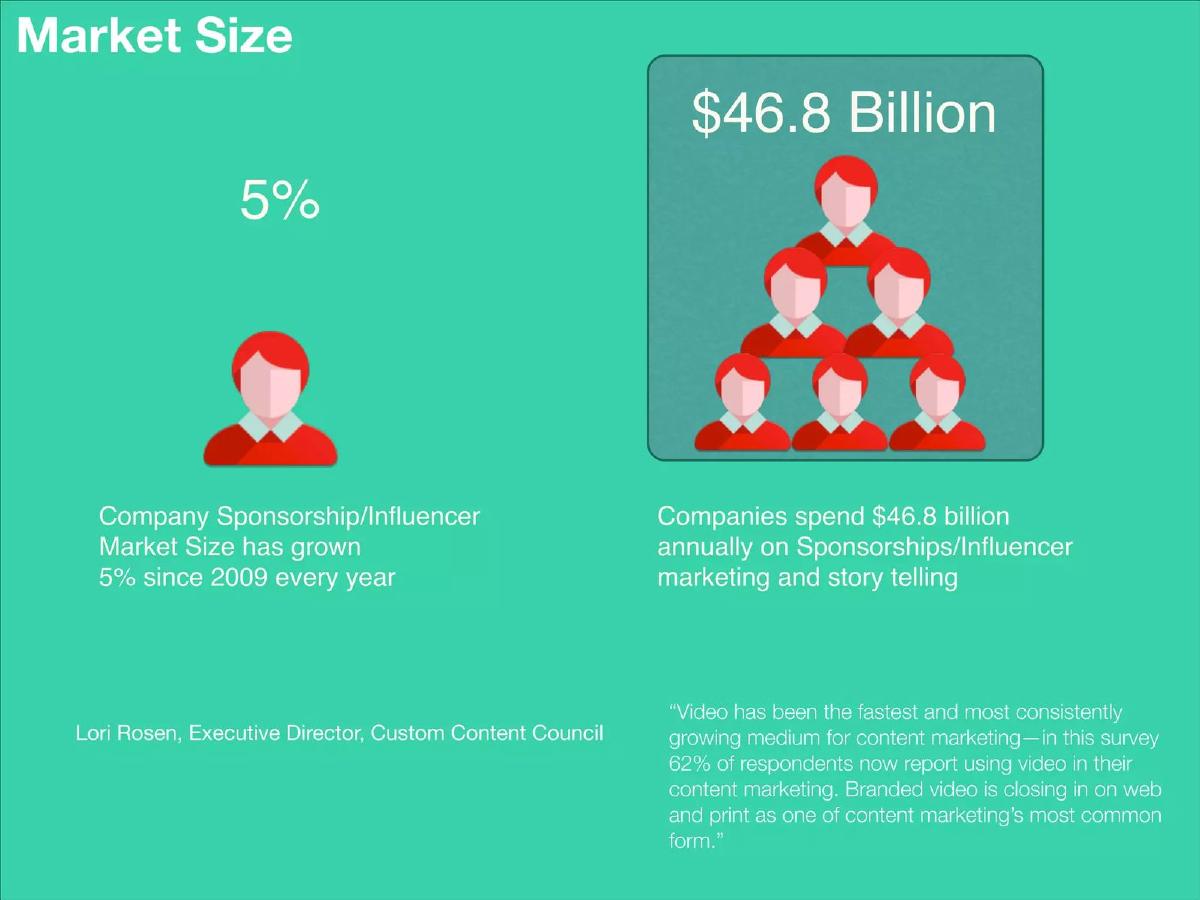
Brandslip deck, slide 6. Exact stored slide matched to this analysis.
Our analysis: Advertiser spend headline with a quote.
Evidence and limitation: It names the paying side (companies) and an annual spend, with an attributed quote. The $46.8B combines sponsorship, influencer marketing and storytelling with no region or year, and the slide doesn't narrow to the video sponsorships Brandslip sells.
What a founder can adapt: "Branded video spend [region] $[X] ([source, year]); [N] brands × $[spend] = $[Y]."
Supporting analysis
What the deck claims: "Market Size." "5%: Company Sponsorship/Influencer Market Size has grown 5% since 2009 every year." "$46.8 Billion: Companies spend $46.8 billion annually on Sponsorships/Influencer marketing and story telling." Quote attributed to Lori Rosen, Executive Director, Custom Content Council: "Video has been the fastest and most consistently growing medium for content marketing ... 62% of respondents now report using video in their content marketing."
Presentation choice: Naming the buyer helps; the category is still too broad.
When it does not fit: Combining several budget categories into one figure.
OwnAir deck, slide 3. Exact stored slide matched to this analysis.
Our analysis: Global → Europe → country, with a source.
Evidence and limitation: It moves from global traffic to European online spend to Italy, with a source for the charts. The Italy growth rate has no base figure, so the Italian market size isn't stated, and traffic share is not spending.
What a founder can adapt: "Online film spend Europe €[X] → Italy €[Y] ([source, year]); [N] subscribers × €[price] = €[Z]."
Supporting analysis
What the deck claims: "Market Opportunity." "Globally, Internet video traffic will be 55% of all consumer Internet traffic in 2016, growing at 34% CAGR." "Spending on audiovisual content through digital/online platforms and services in Europe rose by 20.1% in 2011, to a total of €1.2bn." "Overall, the sector in Italy is growing at an impressive 73.6% CAGR." Charts: Europe total consumer spending on home entertainment; retail value by format 2010-2016. Source: FutureSource Consulting.
Presentation choice: The narrowing direction is right; the last step lacks a number.
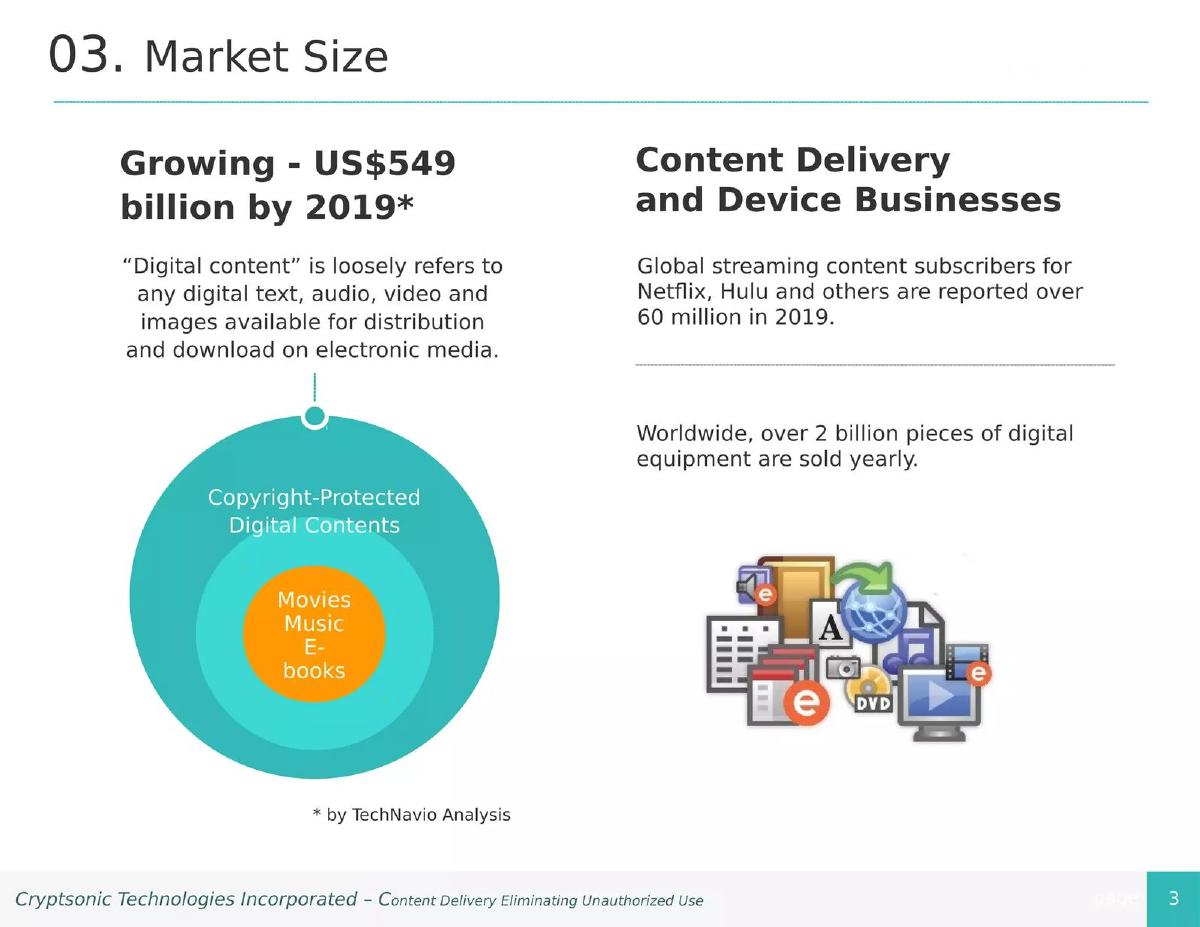
Cryptsonic deck, slide 4. Exact stored slide matched to this analysis.
Our analysis: A loosely defined content total.
Evidence and limitation: Weaker example. A sourced figure, but the slide itself says digital content is loosely defined, and $549B is all digital content, not spending on copy protection. The subscriber and device counts are different units with no link to what Cryptsonic would charge.
What a founder can adapt: "Content protection spend $[X] ([source, year]); [N] distributors × $[fee] = $[Y]."
Supporting analysis
What the deck claims: "03. Market Size." "Growing - US$549 billion by 2019*." "'Digital content' is loosely refers to any digital text, audio, video and images available for distribution and download on electronic media." Diagram: Copyright-Protected Digital Contents; Movies, Music, E-books. "Content Delivery and Device Businesses": "Global streaming content subscribers for Netflix, Hulu and others are reported over 60 million in 2019." "Worldwide, over 2 billion pieces of digital equipment are sold yearly." Footnote: "by TechNavio Analysis."
Presentation choice: A total that covers everything doesn't show a buyer.
When it does not fit: Using the content market as the tool market.
Before: "There is massive untapped potential for mobile ads. Big Happy is going to capture that mobile advertising spend."
After: "US mobile ads $[X] ([source]); [format] $[Y]; year 1: [N] advertisers × $[spend] = $[Z]."
What improved: Our illustrative rewrite of Big Happy's slide; bracketed text is a placeholder, not company fact.
What's different about media market sizing
Media revenue can come from audiences, advertisers or creators, and the same slide often mixes all three. Audience counts, ad budgets and creator numbers are different units. A useful slide picks the side that pays the startup, states the region, and keeps one unit through the calculation.
What investors check
Who pays and for what. Which region and segment is counted. Whether the figures are money, people or units sold. Whether the startup's current position is shown against the target. Whether sources and years are given.
How we read each slide
We quote the text on the slide images and mark our own arithmetic as ours. We have not checked any market figure or source. Page numbers are pages in the original deck file. All seven images were already stored and were checked pixel-for-pixel against fresh renders of the decks.
Common mistakes
Industry total as your market. Narrow to your payer and segment.
Mixed units. Keep money, people and items apart.
Growth rate with no base. Give the size too.
Other companies' rounds. Funding isn't market size.
Diagnostic checklist
Paying side named.
Segment and region stated.
One unit through the maths.
Current position shown.
Sources and years cited.
Frequently asked questions
How should a media or creator startup size its market?
Name who pays you, size that segment in your starting region, and show your current position in the same unit. elopage shows €200m current GMV against a €16-20bn first target.
Is the entertainment or ad industry total a good market size?
Only as context. Big Happy's US mobile ad forecast frames growth; investors then want the segment and share you can win.
How we chose these examples
Corpus: published pitch deck teardowns on StartupFundraising.com. Founder-uploaded private decks are excluded.
Selection (2026-09-26): we searched teardown slide text for market-size wording together with music, podcast, streaming, video, publishers, advertising, media, creator or content, kept slides from media, music, advertising and creator businesses with stored images, reviewed nine from the deck files and kept seven.
Excluded: Hearo.live p4 (a media and games total not linked to the product) and Blurbiz p3 (usage figures with no market size). Slides already used in other guides were not reused.
Page numbers are pages in the original deck files. All seven images were already stored and were checked pixel-for-pixel against fresh renders on 2026-09-26.
Market figures and sources are quoted from the slides and not independently verified. Calculations (shares, growth rates, per-creator figures) are ours and marked as such.
Review: slide images were checked on 2026-09-26 and matched to company, deck and page (editorial model review). No person has yet completed an editorial review of this page. We make no claim that any slide caused a fundraising outcome.