Lead Generation and Referral Fee Business Model Pitch Deck
How to present a lead generation or referral fee business model on a pitch deck: who pays, whether you charge per lead or per closed deal, the price.
How to Present a Lead Generation Business Model on a Pitch Deck
Six slides from real pitch decks show how founders explain earning money by sending customers to other businesses: a fixed price per lead, a finder's fee per customer, a share of the deal that closes, or a percentage of the client's ongoing revenue.
TL;DR
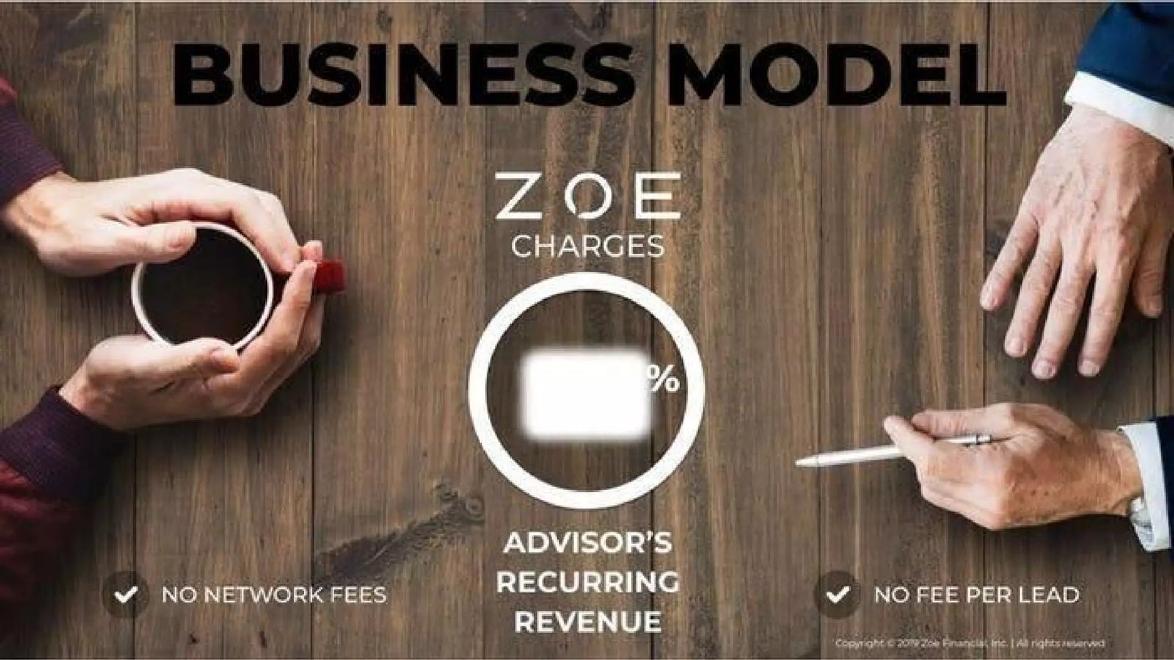
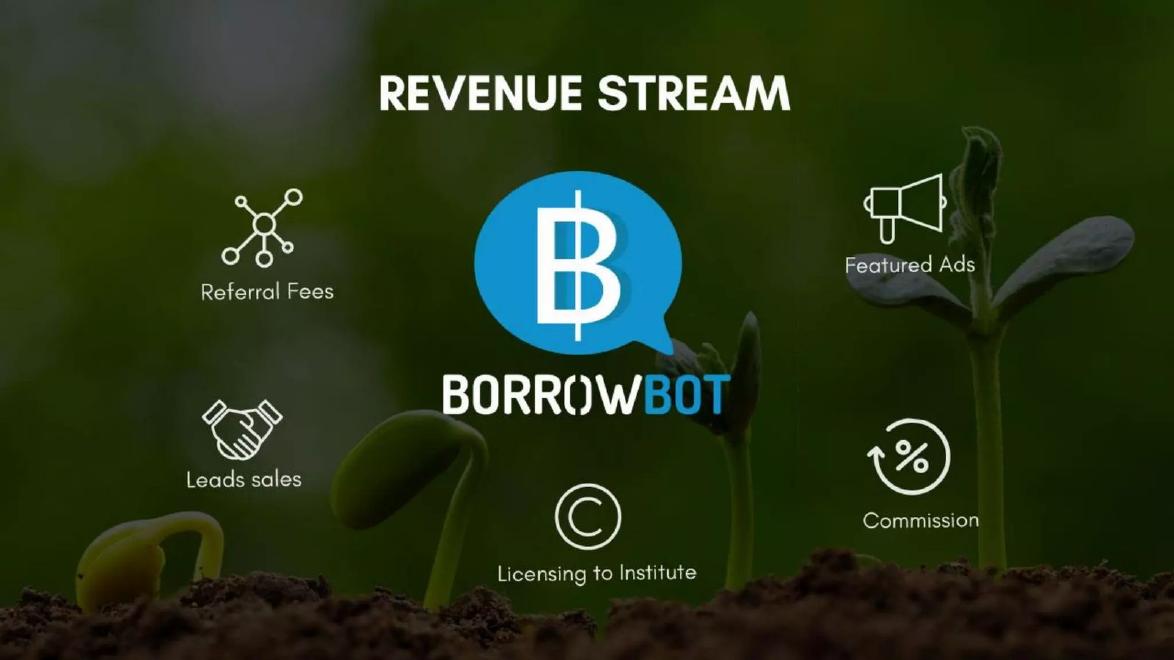
A lead generation business model slide should say who pays you, what they pay for (a lead, a customer who signs, or a share of the revenue that customer brings), the price, and how many leads or customers you expect to deliver. Neighborhood Match gives the clearest price list in this set: realtor leads at $20 to $30 each, rental finder's fees of $200 to $500 per customer, and display advertising at $0.08 per user. Pricecut works out daily income from pay per click, pay per impression, pay per sale and pay per lead, and its four lines add up to its $64,200 total, though only by assuming 1 million paying visits out of 26 million visitors. Mint shows that it earns a referral fee when a user switches bank, card or phone company, without rates. RealFriend takes a 25% referral fee from agents. Zoe Financial is the contrast: it charges no fee per lead and takes a share of the advisor's recurring revenue instead, with the percentage blurred. BorrowBot lists five income sources as icons with no numbers.
Lead generation business model slides from real pitch decks
Each example shows the exact stored slide above its analysis and links to the full teardown. Stage and year are given only where the deck states them. Figures are the company's own claims.
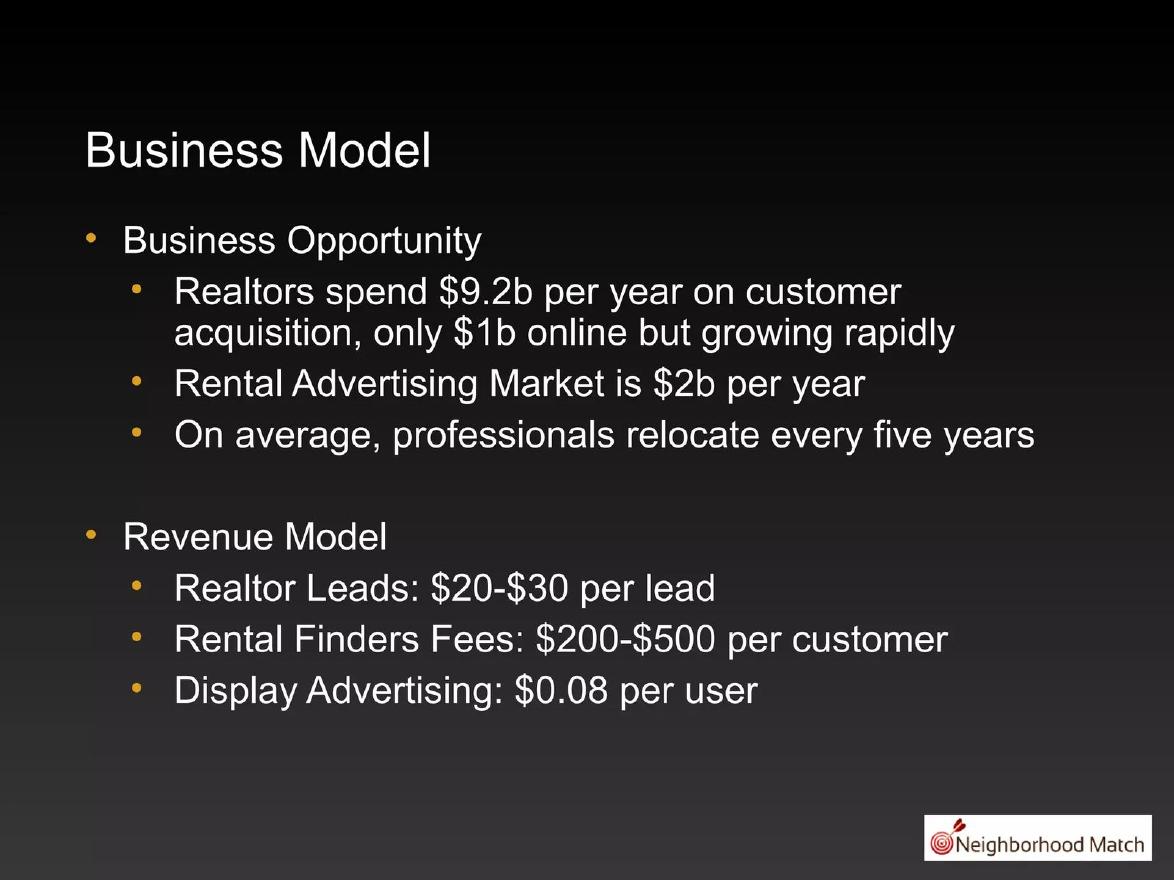
Neighborhood Match business model slide — slide 8
Matching people who are moving with neighbourhoods and housing.
Neighborhood Match deck, slide 8. Exact stored slide matched to this analysis.
Our analysis: The clearest price list: a per-lead price, a per-customer fee and an advertising rate on one slide.
Evidence and limitation: Prices with no volume behind them.
What a founder can adapt: Add how many leads and rental customers you expect per month.
Supporting analysis
What the deck claims: Realtors spend $9.2b per year on customer acquisition, only $1b online; rental advertising market $2b per year. Revenue model: realtor leads $20–$30 per lead; rental finder's fees $200–$500 per customer; display advertising $0.08 per user.
Presentation choice: The clearest price list: a per-lead price, a per-customer fee and an advertising rate on one slide.
When it does not fit: Prices with no volume behind them.
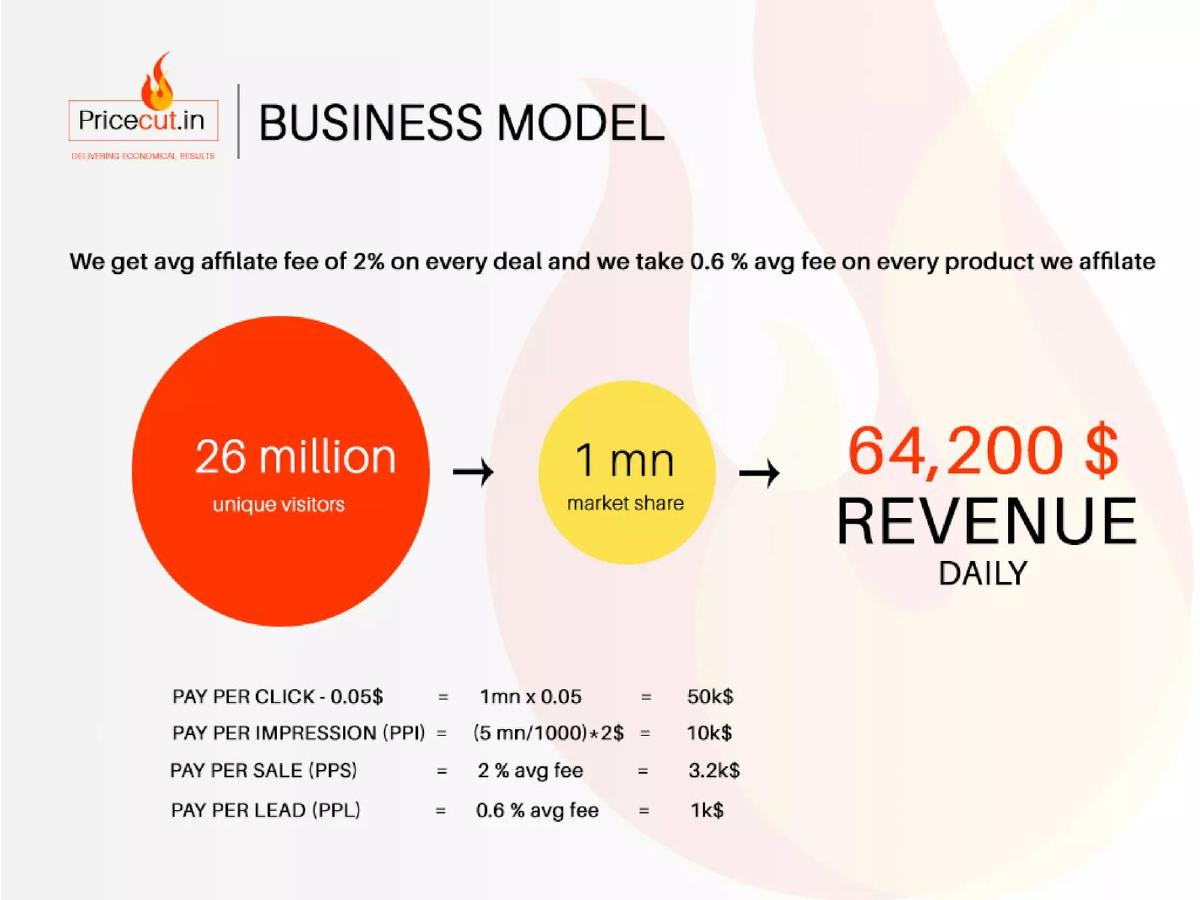
Pricecut deck, slide 6. Exact stored slide matched to this analysis.
Our analysis: The only slide that multiplies price by volume, and its four lines add up to the total.
Evidence and limitation: Resting the whole calculation on an unexplained volume.
What a founder can adapt: Explain where the 1 million paying visits comes from.
Supporting analysis
What the deck claims: Average affiliate fee 2% per deal, 0.6% per product. 26 million unique visitors → 1 mn market share → $64,200 revenue daily. Pay per click $0.05 × 1mn = $50k; pay per impression (5mn/1000) × $2 = $10k; pay per sale 2% = $3.2k; pay per lead 0.6% = $1k.
Presentation choice: The only slide that multiplies price by volume, and its four lines add up to the total.
When it does not fit: Resting the whole calculation on an unexplained volume.
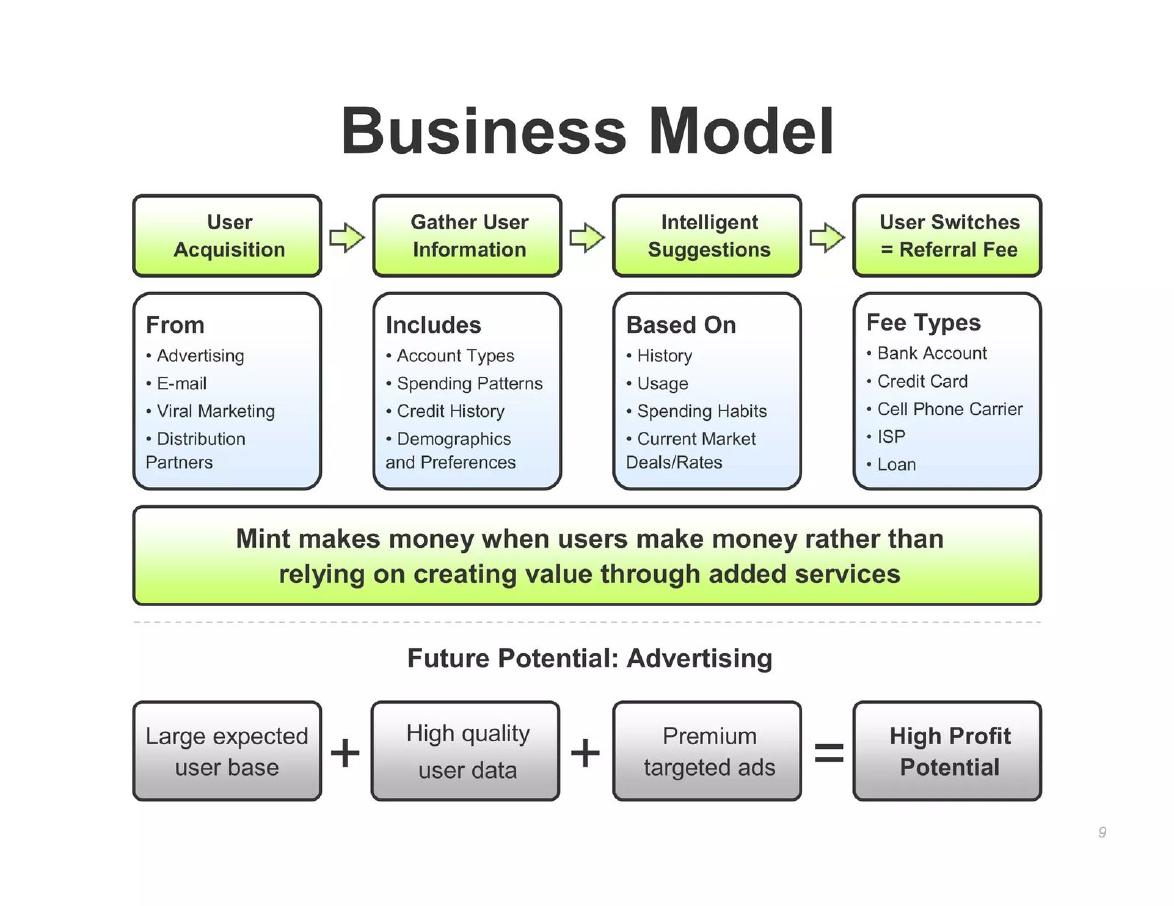
Mint deck, slide 9. Exact stored slide matched to this analysis.
Our analysis: Explains why the user acts and who pays when they do.
Evidence and limitation: A clear chain with no numbers at the end of it.
What a founder can adapt: Add a typical referral fee per product and the share of users expected to switch.
Supporting analysis
What the deck claims: User acquisition → gather user information → intelligent suggestions → user switches = referral fee. Fee types: bank account, credit card, cell phone carrier, ISP, loan. "Mint makes money when users make money." Future potential: advertising.
Presentation choice: Explains why the user acts and who pays when they do.
When it does not fit: A clear chain with no numbers at the end of it.
Most slides name who pays; few give the price and the volume together.
Example
Who pays
Charged on
Price stated
Volume stated
Neighborhood Match
Realtors, landlords
Per lead / per customer
Yes
No
Pricecut
Retailers
Click, impression, sale, lead
Yes
Yes (assumed)
Mint
Banks, carriers
Per switch
No
No
RealFriend
Agents
25% of agent commission
Rate only
No
Zoe Financial
Advisors
Share of recurring revenue
Blurred
No
BorrowBot
Not stated
Not stated
No
No
Key Takeaways
Name who pays you: the business receiving the lead, not the person you send.
Say whether you charge per lead, per customer who signs, or a share of the deal.
Give the price, or a range, for each kind of lead.
Show how many leads you deliver per month and how many become customers.
If income depends on the buyer closing the deal, say how often they close.
Test your lead generation slide before you send it
Answer these with numbers, even if they are targets.
Payer. Which businesses pay you, and how many do you work with?
Basis. Do you charge per lead, per customer who signs, or a share of the deal?
Price. What does each kind of lead or customer earn you?
Volume. How many leads do you deliver each month, and how many become customers?
Cost. What does it cost you to attract one lead?
Copyable framework: [Buyers] pay us [price] per [lead / signed customer / share of deal]; we deliver [n] a month at a cost of [amount] each, earning [amount] a month
Illustrative example 1 — written by us
Before: Referral fees. Leads sales. Licensing to institutions. Featured ads. Commission.
After: Lenders pay [price] per qualified borrower lead; [n] leads a month at [cost] each; [share]% of revenue
What improved: Our illustrative rewrite, not BorrowBot's text. Bracketed parts are placeholders, not company facts. It picks one income source and gives it a price and a volume.
What this guide covers
A lead generation business attracts people who want something (a home, a mortgage, a financial advisor, an insurance policy) and passes them to businesses that sell it. The business that receives the lead pays. The payment can be a fixed price per lead, whether or not the lead buys; a finder's fee once the person becomes a customer; a share of the commission or first payment from the closed deal; or a share of the customer's revenue for as long as they stay.
Investors look at lead generation businesses with two questions in mind. First, how much does one lead earn, and how much does it cost to attract? If a lead sells for $25 and costs $20 in advertising, there is little room for anything else. Second, who carries the risk that the lead doesn't buy? Charging per lead puts that risk on the buyer and gives steadier income. Charging per closed deal puts it on you, but each deal earns more and buyers are easier to sign up.
Our business model guides cover marketplaces, affiliate revenue, advertising and pricing, but none explains how to present lead and referral fees. The affiliate guide covers commission on products sold through your links; this guide covers businesses that pass people, not products, to a seller. We searched our corpus for pay per lead, cost per lead, lead fees and referral fees, and found 37 matches across 35 decks once mining slides about the metal lead were removed. Two strong slides, BounceHelp's $1.99 per lead and HouseLab's $50 per lead, are already used in other guides and are not repeated here. Six slides from six private companies were readable and differ enough to teach something.
Say who pays and what they pay for
In a lead generation business the person you help is usually not the person who pays. A renter uses the service for free; the realtor or landlord pays. The slide should make that clear in its first line, because an investor needs to know whose budget the money comes from.
Mint, the personal finance app, shows this as a four-step chain on its pre-launch business model slide: user acquisition (through advertising, email, viral marketing and distribution partners), gathering user information (account types, spending patterns, credit history, demographics), intelligent suggestions (based on history, usage, spending habits and current market deals and rates), and "User switches = referral fee". The fee types listed are bank accounts, credit cards, phone carriers, internet providers and loans. A banner states the logic: "Mint makes money when users make money rather than relying on creating value through added services." The slide makes the payer clear (the bank or carrier the user switches to) and explains why the user would act on the suggestion. What it doesn't give is the size of any fee or how many users switch.
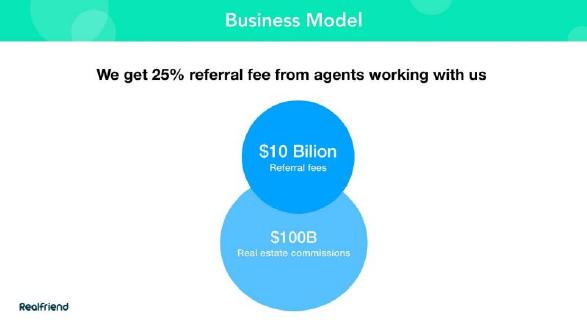
RealFriend, a real estate chatbot that helps people find apartments, puts its model in one sentence: "We get 25% referral fee from agents working with us." The payer is the agent, and the base is the agent's commission. Two circles below give the market: $10 billion in referral fees inside $100 billion of real estate commissions. The slide is clear about who pays and what share they pay, but it doesn't say how the $10 billion figure is reached, what an average referral is worth to RealFriend, or how many renters become agent clients.
Per lead, per customer or a share of the deal
The pricing choice shapes the whole business. A fixed price per lead is simple to sell and gives income as soon as the lead is delivered, but buyers will only pay for leads that are good. A fee per customer who signs earns more each time but depends on the buyer's ability to close. A share of the deal, or of ongoing revenue, earns the most but takes longest to collect.
Neighborhood Match, which matched people who were moving with neighbourhoods and housing, used both on one slide. Its revenue model lists realtor leads at $20 to $30 per lead, rental finder's fees at $200 to $500 per customer, and display advertising at $0.08 per user. That tells an investor a lot in three lines: a cheap per-lead price for buyers in the sales market, a much larger fee paid only when a renter signs, and a small advertising income on top. Above the revenue model the slide sizes the market: realtors spend $9.2 billion a year on customer acquisition, only $1 billion of it online; the rental advertising market is $2 billion a year; and professionals move on average every five years.
Zoe Financial, a service that matches people with independent financial advisors, sits at the other end. Its slide says "Zoe charges" a percentage of "advisor's recurring revenue", with the figure blurred, and adds two ticks: "No network fees" and "No fee per lead". Zoe chose to take a share of what the advisor earns from each client it sends, for as long as that client stays. That is easier to sell to advisors, who pay only for clients they actually win, and can be worth far more over time than a one-off lead price. The cost is that Zoe has to wait for that money and depends on the advisor keeping the client. An investor will want the percentage, the average client's assets and fees, and how long clients stay.
Give the price for each kind of lead
Leads for different products are worth very different amounts. A lead for a life insurance policy is worth more than a lead for a dental plan; a mortgage lead is worth more than a lead for a moving company. If you sell leads in more than one category, give a price or a range for each.
Neighborhood Match does this: realtor leads, rental finder's fees and display advertising each carry their own price. If some of the income is planned rather than earned, label it as future income on the slide so an investor does not read it as revenue you already have.
Show the volume behind the price
A price per lead becomes a business only when you multiply it by volume. The slide, or the financials that follow it, should show how many visitors you attract, how many become leads, and how many leads are sold.
Pricecut, an Indian price comparison site, is the only slide in this set that does the multiplication. It starts with "26 million unique visitors", then "1 mn market share", then "64,200 $ revenue daily". Underneath it shows four lines: pay per click at $0.05 times 1 million gives $50,000; pay per impression at (5 million ÷ 1,000) × $2 gives $10,000; pay per sale at a 2% average fee gives $3,200; pay per lead at a 0.6% average fee gives $1,000. The four lines add up to $64,200, matching the total. A line at the top adds that it earns an average affiliate fee of 2% on every deal and 0.6% on every product.
The arithmetic is consistent, which is more than many slides manage. The weakness is the assumption: the whole calculation rests on 1 million paying visits a day, which the slide labels "market share" and doesn't explain. It also shows that pay per lead is the smallest of its four income lines, which is worth knowing. A stronger version would say where the 1 million comes from (a conversion rate from the 26 million visitors, perhaps) and show the same calculation at a lower volume.
BorrowBot, a lending chatbot, shows the opposite. Its revenue stream slide has five icons around its logo: referral fees, leads sales, licensing to institutions, featured ads and commission. There are no prices, no volumes and no sense of which matters most. Five income sources with no numbers tells an investor only that the company hasn't yet chosen how it will make money.
A worked example: price per lead versus share of the deal
This example uses illustrative figures, not company data. Suppose you run a site that finds mortgage borrowers and passes them to brokers. Each month you attract 2,000 people who fill in your form, at an advertising cost of $15 each, or $30,000 in total.
Option one: you sell every lead for $40. Income is 2,000 × $40, which is $80,000 a month, and you collect it as soon as the leads are delivered. After the $30,000 advertising cost you keep $50,000 before other costs.
Option two: you charge nothing per lead and take a $1,000 fee on each mortgage that closes. If brokers close 5% of your leads, that is 100 mortgages and $100,000 a month, but paid weeks or months later, and only if the brokers do their job. If they close 3%, it is $60,000. Your income now depends on someone else's sales skill.
Put either option on your slide as a single line: leads per month, price or fee, conversion rate if it applies, and monthly income. Then show the cost of attracting each lead next to it. That is the calculation an investor will do anyway.
Common mistakes
No payer. Say which businesses pay you.
No price. Give a price or range per lead or customer.
No volume. Show leads per month and how many convert.
Lead cost ignored. Show what one lead costs to attract.
Every model at once. Say which income source comes first.
Diagnostic checklist
Who pays, named.
Per lead, per customer or share of deal, stated.
Price or range for each lead type.
Leads per month and conversion rate.
Cost to attract each lead.
Frequently asked questions
How we chose these examples
Corpus: published pitch deck teardowns on StartupFundraising.com. Founder-uploaded private decks are excluded.
Selection (2026-10-01; v2 2026-10-05 removed HealthJoy because a page of its deck carries a restriction notice): we searched extracted slide text for pay per lead, cost per lead, lead fees and referral fees (37 matches, 35 decks), removed mining slides about the metal lead, then read each candidate from images made from the original deck files.
Eligibility: each company was private when its deck was made. Zoe Financial (seed and a Series A in May 2021), RealFriend (seed round, March 2020) and Mint (private until acquired, never listed) were checked against public sources. Neighborhood Match, Pricecut and BorrowBot rest on their own early-stage decks and the absence of any known listing.
Not used: BounceHelp and HouseLab (their lead pricing slides already appear in other guides); Fat Joe's (used in the affiliate guide); Educate.me (deck file unavailable).
Arithmetic: Pricecut's four income lines ($50,000 + $10,000 + $3,200 + $1,000) sum to its $64,200 daily total; we checked this ourselves.
Overlap check: the affiliate business model guide covers commission on products sold; no guide covers lead and referral fees.
Review: all six slide images were inspected on 2026-10-01 and matched to company, deck and slide number (AI editorial model review). No person has yet completed an editorial review of this page. The worked example uses illustrative figures, not company data.
Figures are the companies' own claims; we did not verify underlying data. We make no claim that any slide caused a fundraising outcome.