Car and Mobility Startup Business Model Slide Examples: 6
How car, rental and vehicle software startups explain how they make money in a pitch deck: booking commissions, per-vehicle fees, co-leasing.
Car and Mobility Business Model Slide: Show the Fee per Car, Trip or Licence
Car and mobility startups earn money in very different ways: a cut of each rental booking, a monthly fee per vehicle, a lease shared between several drivers, a software licence paid per car built, or the margin on cars made for someone else. Each needs a different number on the slide. A strong business model slide names who pays, the fee, and what it is charged on: a booking, a vehicle, a month or a car built. A weak one describes how risky or attractive the model is without giving a single price.
TL;DR
Give the fee and what it is charged on. Wisecar prices each product, such as $3 a month per vehicle and $1 per service record, and puts competitors' prices beside its own. Get A Drive takes a 15–20% commission on each rental and charges for GPS tracking. Drive takes 25% of every booking. StradVision shows its income shifting from engineering fees towards per-vehicle licences, from 9:1 now to 5:5 in 2026. Orto describes an upfront fee, a monthly fee and resale of the car at the end of the term, but gives no figures. Fisker's slide promises profit on the first car but gives no prices at all, which is the gap to avoid.
Six mobility business model slides
Strongest first. Each example quotes the slide and notes what an investor can and cannot work out from it.
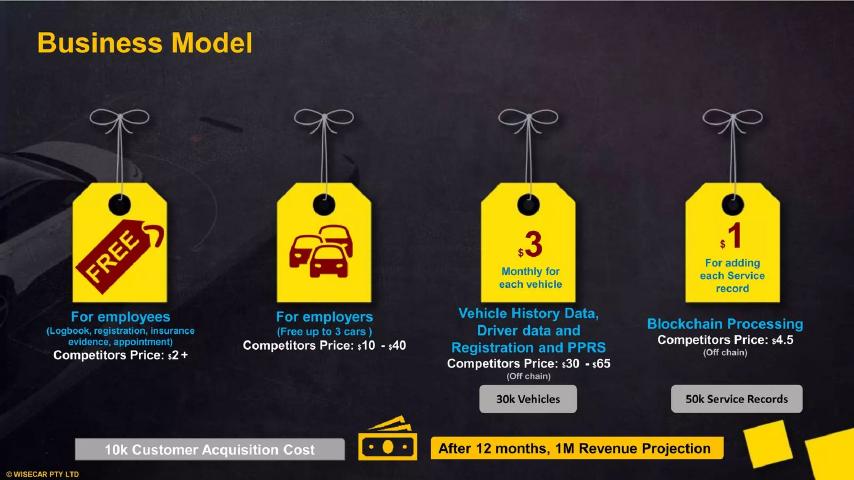
Wisecar business model slide — slide 9
Vehicle records and fleet software. Slide titled "Business Model".
Wisecar deck, slide 9. Exact stored slide matched to this analysis.
Our analysis: Every product has a price, what it is charged on and a competitor price beside it.
Evidence and limitation: Company prices and projection; competitor prices are not sourced.
What a founder can adapt: Price each product and say what it is charged on.
Supporting analysis
What the deck claims: Four price tags: "FREE" "For employees" ("Competitors Price: $2 +"); "For employers" "(Free up to 3 cars)" ("Competitors Price: $10 - $40"); "$3 Monthly for each vehicle", "Vehicle History Data, Driver data and Registration and PPRS" ("Competitors Price: $30 - $65", "30k Vehicles"); "$1 For adding each Service record", "Blockchain Processing" ("Competitors Price: $4.5", "50k Service Records"). Below: "10k Customer Acquisition Cost" and "After 12 months, 1M Revenue Projection".
Presentation choice: Investors can see the fee per vehicle and per record and roughly check the revenue target.
When it does not fit: Leaving out the currency and the sum behind the projection.
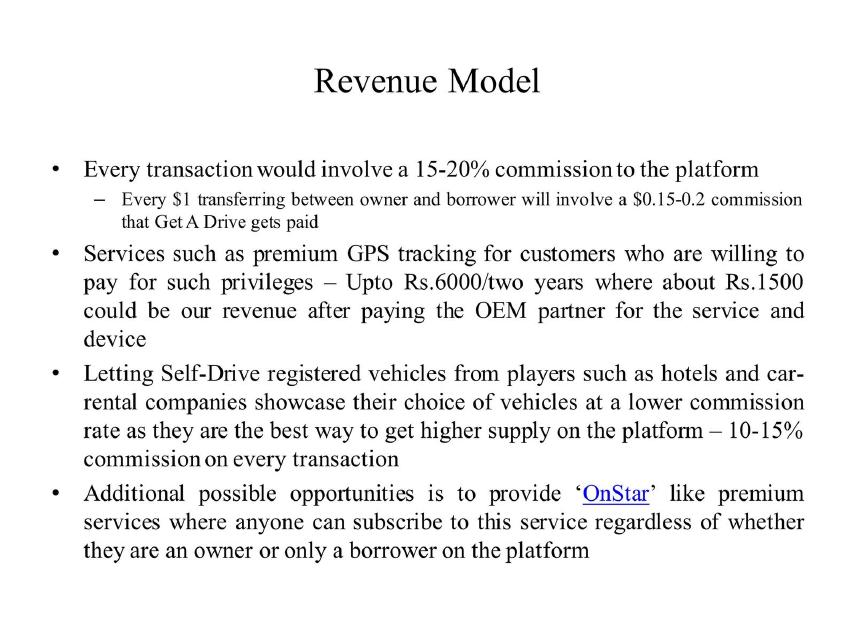
Peer-to-peer car rental platform in India. Slide titled "Revenue Model".
Get A Drive deck, slide 14. Exact stored slide matched to this analysis.
Our analysis: It gives a commission for each type of supplier and a price for an extra service.
Evidence and limitation: Company plan.
What a founder can adapt: Add the average booking value so the commission becomes money.
Supporting analysis
What the deck claims: "Every transaction would involve a 15-20% commission to the platform" ("Every $1 transferring between owner and borrower will involve a $0.15-0.2 commission"). Premium GPS tracking "Upto Rs.6000/two years" after paying the OEM partner "about Rs.1500". Hotels and rental companies listing vehicles at "10-15% commission on every transaction". A possible "OnStar"-like premium subscription.
Presentation choice: The lower rate for fleets explains how it plans to add cars quickly.
When it does not fit: Listing "possible opportunities" beside live revenue without labelling them.
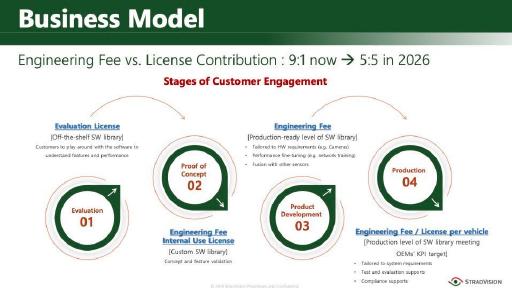
Camera software for driver assistance, sold to car makers. Slide titled "Business Model".
StradVision deck, slide 25. Exact stored slide matched to this analysis.
Our analysis: It shows how a car maker moves from trial to paying per vehicle, and how the income mix will change.
Evidence and limitation: Company plan; no prices.
What a founder can adapt: Add the licence fee per vehicle and the volumes behind the 2026 target.
Supporting analysis
What the deck claims: "Engineering Fee vs. License Contribution : 9:1 now → 5:5 in 2026". "Stages of Customer Engagement": "Evaluation License" ("Off-the-shelf SW library"), "Proof of Concept", "Engineering Fee Internal Use License", "Product Development", "Engineering Fee", "Production", "Engineering Fee / License per vehicle".
Presentation choice: The 9:1 to 5:5 target tells investors licence income should grow to half of revenue.
When it does not fit: A target mix with no fees, so the size of each part is unknown.
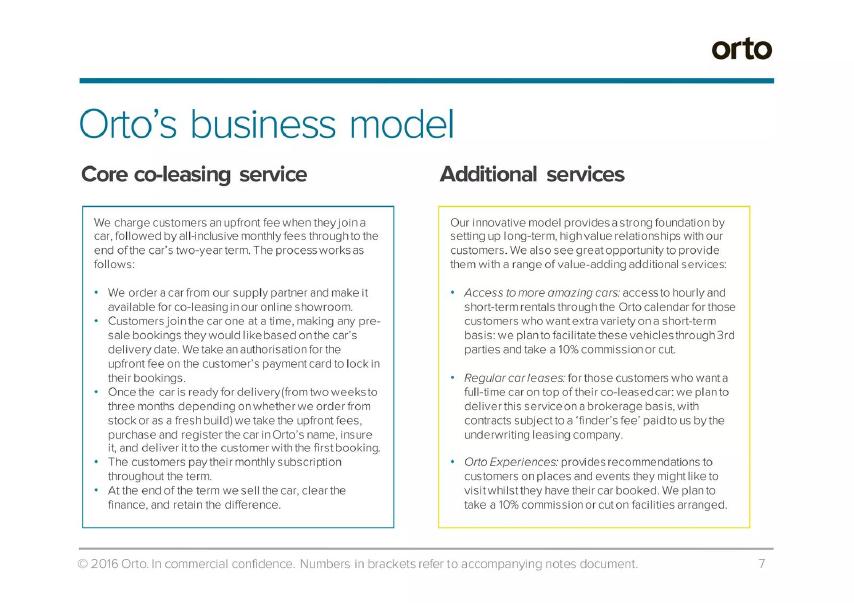
Car co-leasing service, 2016 deck. Slide titled "Orto's business model".
Orto deck, slide 7. Exact stored slide matched to this analysis.
Our analysis: It explains clearly who owns the car and where each kind of income comes from.
Evidence and limitation: Company description; no fees given. The slide footer refers to an accompanying notes document.
What a founder can adapt: Give the upfront fee, the monthly fee, the drivers per car and the resale value assumed.
Supporting analysis
What the deck claims: "Core co-leasing service": "We charge customers an upfront fee when they join a car, followed by all-inclusive monthly fees through to the end of the car's two-year term." "At the end of the term we sell the car, clear the finance, and retain the difference." "Additional services": short-term rentals where "we plan to facilitate these vehicles through 3rd parties and take a 10% commission or cut"; regular leases with "a 'finder's fee' paid to us by the underwriting leasing company"; "Orto Experiences" with "a 10% commission or cut on facilities arranged".
Presentation choice: Saying the company owns and resells the car tells investors where the risk sits.
When it does not fit: Putting all the figures in a separate notes document.
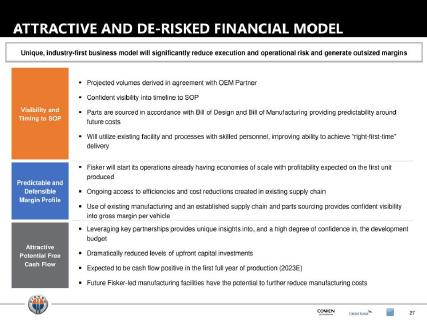
Electric vehicle maker, SPAC investor deck. Slide titled "Attractive and De-risked Financial Model".
Fisker deck, slide 27. Exact stored slide matched to this analysis.
Our analysis: It says why the model is lower risk, but gives no price, cost or margin per car.
Evidence and limitation: Company forecasts; no figures on the slide.
What a founder can adapt: Give the price, cost and margin per car and the planned volumes.
Supporting analysis
What the deck claims: "Unique, industry-first business model will significantly reduce execution and operational risk and generate outsized margins". "Projected volumes derived in agreement with OEM Partner". "Fisker will start its operations already having economies of scale with profitability expected on the first unit produced". "Expected to be cash flow positive in the first full year of production (2023E)".
Presentation choice: Using a partner's factory is a real difference, but investors need the numbers to judge it.
When it does not fit: Words like "outsized margins" with no margin shown.
Whether each slide gives a fee, says what it is charged on and adds a volume.
Example
Fee
Charged on
Volume given
Wisecar
Free, $3, $1
Vehicle per month; service record
30k vehicles, 50k records
Get A Drive
15–20%; 10–15%; Rs.6000
Booking; GPS for two years
No
StradVision
Not given
Engineering work; vehicle built
No
Drive
25%
Booking
No
Orto
Not given; 10% on extras
Joining fee, month, resale
No
Fisker
Not given
Car sold
No
Key Takeaways
Say what the fee is charged on: a booking, a vehicle, a month or a car built.
Give the fee as a price or a percentage.
Put competitors' prices beside yours if yours are lower.
Show how the mix of income will change over time.
Replace claims about margins with the figures behind them.
Build your mobility business model slide
Work out the fee and what it is charged on before you design the slide.
Payer. Who pays: drivers, car owners, fleets, employers or car makers?
Fee. What is the price or percentage, and is it per booking, per vehicle, per month or per car built?
Volume. How many bookings, vehicles or cars does the fee apply to?
Ownership. Who owns the car, and what do you assume it is worth at the end?
Copyable framework: [Payer] pays [fee] per [booking / vehicle / month / car]. Today we have [volume]; one car earns us [amount] a month.
Illustrative example 1 — written by us
Before: We receive a commission on every booking.
After: We take 20% of each rental. The average rental is $90 and each listed car is rented 6 times a month, so one car earns us about $108 a month.
What improved: Our illustrative rewrite; all figures are invented for the example. It turns the commission into money per car.
What this guide adds
The general business model guide covers revenue for any startup. This guide covers car, rental and vehicle software startups, where the cars themselves are expensive, someone has to own or finance them, and revenue can come from drivers, fleet owners, employers or car makers.
How we read each slide
We read each stored slide image and quote the text on it. We have not checked any company's prices, commissions, vehicle counts or revenue, and we make no claim that any slide affected a fundraising outcome.
The common mobility revenue models
Commission on bookings: a marketplace takes a share of each rental or trip, as Drive (25%) and Get A Drive (15–20%) do. The key numbers are the percentage, the average booking value and bookings per car per month.
Fee per vehicle: software charges a monthly price for each car it tracks, as Wisecar does at $3 a month. The key numbers are the price, the number of vehicles and how long customers stay.
Shared ownership or leasing: the company buys the car, charges drivers to use it and sells it at the end, as Orto describes. The key numbers are the fees, the purchase price and the resale value.
Licences paid per car built: a software supplier earns engineering fees during development, then a licence fee for each vehicle produced, as StradVision describes. The key numbers are the fee per vehicle and the production volumes it depends on.
Manufacturing: a car company sells vehicles and earns a margin on each one, as Fisker plans with a manufacturing partner. The key numbers are the price and margin per car and the number of cars.
What investors check on a mobility business model slide
Who owns the car? A booking marketplace that does not own cars needs far less money than one that buys them. Orto buys the car and recovers its cost from fees and resale, so investors will want the resale assumption.
What does one car earn in a month? A commission means little without the booking value and how often each car is rented.
How much depends on someone else's volumes? StradVision's per-vehicle licences rise with car makers' production, which it does not control.
Are cheaper prices believable? Wisecar puts each competitor price beside its own, so investors can see the gap, but will ask how it can charge so much less.
Common mistakes on mobility business model slides
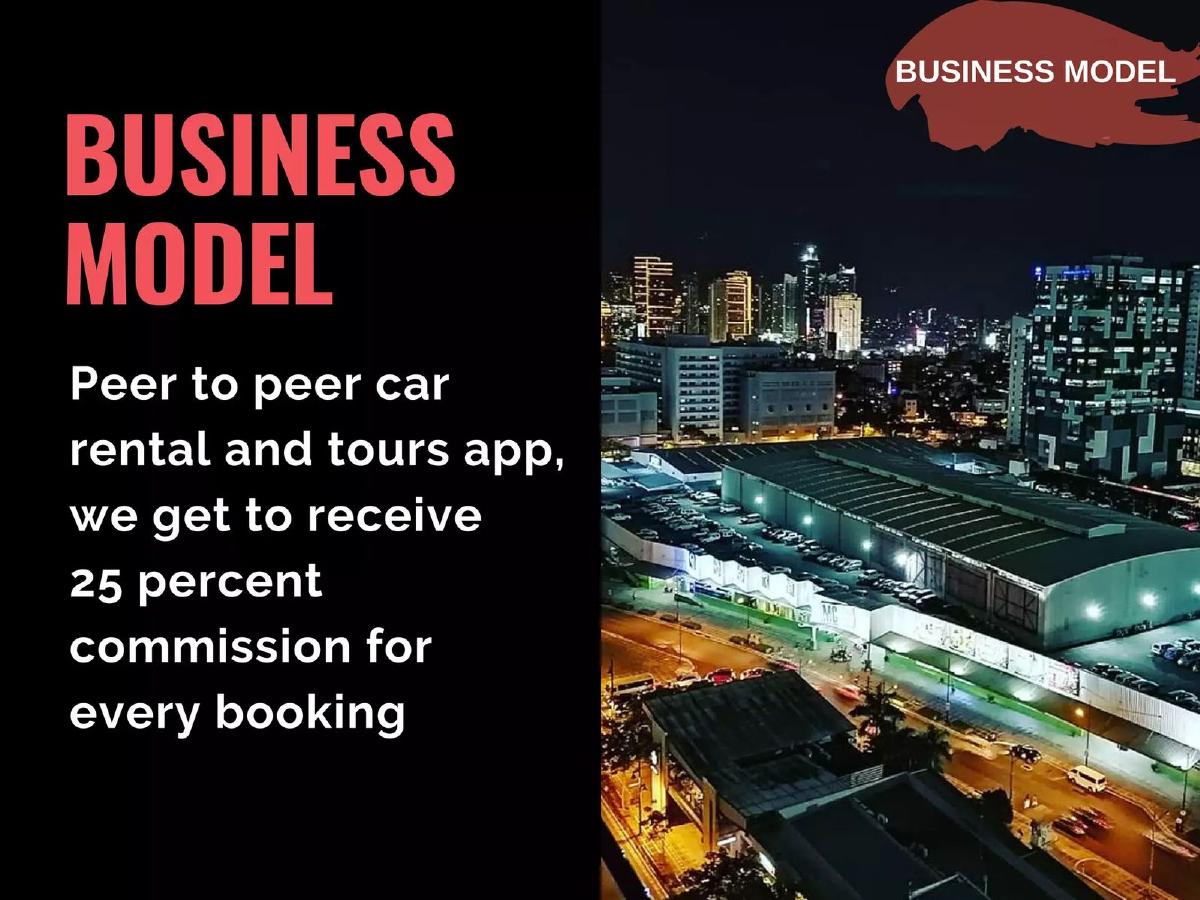
A commission with nothing else: Drive's slide gives 25% and a photo of a city, with no booking value or volume.
Describing the process instead of the money: Orto explains each step of its lease clearly, but gives none of the fees.
Claims instead of figures: Fisker's slide says profit is "expected on the first unit produced" but gives no price or margin per car.
A projection without a sum: Wisecar's "1M Revenue Projection" sits beside its prices but the slide does not show how they add up to it, and gives no currency.
Choosing which numbers to show
Start with the fee and what it is charged on. Then add one figure that turns it into money: the average booking, the number of vehicles, or the cars to be built.
If you take a commission, show what one car earns in a month: booking value times bookings times your cut.
If you own or lease cars, show the purchase price, the fees over the term and the resale value you assume.
If your income mix will change, as StradVision's does, give the split today and the target, with the year.
Adapting the slide to your type of mobility business
Rental and car-sharing marketplaces should show the commission, the average booking value and bookings per car per month.
Fleet and vehicle software should show the price per vehicle per month and how many vehicles are signed up.
Leasing and subscription companies should show the upfront fee, the monthly fee, the term and the resale value they assume.
Suppliers to car makers should show the engineering fee, the licence fee per vehicle and which car programmes it depends on.
Vehicle makers should show the price, cost and margin per car, and how many cars are planned each year.
Checking a projection against the prices
Wisecar's slide gives enough figures for a rough check. It shows 30,000 vehicles and a price of $3 a month per vehicle. If every one of those vehicles paid for a year, that would be about $1.08 million, close to the slide's "1M Revenue Projection". The 50,000 service records at $1 each would add about $50,000. That arithmetic is ours, not the slide's, and it assumes all 30,000 vehicles pay every month.
Putting that sum on the slide would make the projection easier to believe. Without it, investors have to guess which products the million comes from.
When the cars cost money before they earn it
Mobility businesses that buy, lease or build vehicles spend money long before customers pay. Orto pays for each car when it is delivered and recovers the cost over a two-year term and a final sale. Fisker depends on a partner's factory and planned volumes before the first car is sold. Investors will want to know how long it takes for one car to pay back what it cost, and what happens if fewer drivers sign up or the car sells for less at the end.
If your model works this way, add one line to the slide: the cost of a car, what it earns each month, and the month it pays back. Marketplaces that do not own cars, such as Drive and Get A Drive, can say so plainly, because it means each new car on the platform costs them little.
Software suppliers face a different wait. StradVision earns engineering fees first, and per-vehicle licences only once cars reach production, which can take years. Say when production starts for your first programmes, so investors can see when the larger income begins.
Common mistakes
A commission alone. Add the booking value and how often cars are rented.
Process without fees. Give the price at each step.
Claims instead of margins. Show the price, cost and margin per car.
Projection without a sum. Show how the prices add up to it.
Ownership left unclear. Say who owns and finances the cars.
Plans mixed with live revenue. Label what earns money today.
Diagnostic checklist
Payer named.
Fee given as a price or percentage.
What the fee is charged on stated.
A volume that turns the fee into money.
Car ownership and resale explained.
Live and planned revenue labelled.
Frequently asked questions
How do car and mobility startups make money?
Through commissions on bookings (Drive, 25%; Get A Drive, 15–20%), monthly fees per vehicle (Wisecar, $3), shared leases with resale at the end (Orto), licence fees per car built (StradVision), and margins on cars sold (Fisker).
What should a mobility business model slide include?
Who pays, the fee, what it is charged on, and one volume, such as bookings or vehicles, that turns the fee into money.
Should I show competitors' prices on the business model slide?
It helps when yours are clearly lower, as Wisecar shows. Say where the competitor prices come from, which Wisecar's slide does not.
What if my income depends on car makers' production?
Show the fee per vehicle and which programmes it depends on, and how your income mix will change, as StradVision does with its 9:1 to 5:5 target.
How we chose these examples
Corpus: published pitch deck teardowns on StartupFundraising.com. Founder-uploaded private decks are excluded.
Selection (2026-10-01): we searched extracted slide text across the full corpus for business model or revenue model slides that mention cars, vehicles, rentals or driving. We shortlisted 9 slides not used in other guides, viewed 8 and kept 6, each from a different company.
Not used: Drive (version deck) p5 (the same slide as the Drive deck used here), IMAN p8 (consumer lending rather than mobility) and Acerta p8 (deck file unavailable).
Review: stored slide images were read at full size on 2026-10-01 against company, deck and slide number (editorial model review). No person has yet completed an editorial review of this page. We did not verify any company's prices, commissions or revenue.